

#solanastrong
solanastrong
5.8M views
11,126 සාකච්ඡා කරමින්
උණුසුම්
නවතම

·
--
උසබ තත්ත්වය
#SolanaStrong #SolanaUSTD
O preço da Solana $SOL é cotado hoje em torno de US$ 119 (cerca de R$ 625), mantendo-se estável com variação leve nas últimas 24 horas.Analistas apontam um viés neutro a baixista no curto prazo (gráfico de 4 horas), mas com indicadores mistos e índice de Medo & Ganância na faixa de 67 (Ganância).Previsões de curto prazo compiladas por plataformas de análise indicam oscilações contidas na faixa de US$ 119 a US$ 120 para os próximos dias.O ecossistema continua focado em alta escalabilidade, transações rápidas de baixo custo e expansão de dApps e stablecoins, de olho em metas de longo prazo de adoção global...
#SolanaStrong #SolanaUSTD
O preço da Solana $SOL é cotado hoje em torno de US$ 119 (cerca de R$ 625), mantendo-se estável com variação leve nas últimas 24 horas.Analistas apontam um viés neutro a baixista no curto prazo (gráfico de 4 horas), mas com indicadores mistos e índice de Medo & Ganância na faixa de 67 (Ganância).Previsões de curto prazo compiladas por plataformas de análise indicam oscilações contidas na faixa de US$ 119 a US$ 120 para os próximos dias.O ecossistema continua focado em alta escalabilidade, transações rápidas de baixo custo e expansão de dApps e stablecoins, de olho em metas de longo prazo de adoção global...
O preço da Solana $SOL é cotado hoje em torno de US$ 119 (cerca de R$ 625), mantendo-se estável com variação leve nas últimas 24 horas.Analistas apontam um viés neutro a baixista no curto prazo (gráfico de 4 horas), mas com indicadores mistos e índice de Medo & Ganância na faixa de 67 (Ganância).Previsões de curto prazo compiladas por plataformas de análise indicam oscilações contidas na faixa de US$ 119 a US$ 120 para os próximos dias.O ecossistema continua focado em alta escalabilidade, transações rápidas de baixo custo e expansão de dApps e stablecoins, de olho em metas de longo prazo de adoção global...
1
945

Análise SOL/USDT — Gráfico de 4 horas
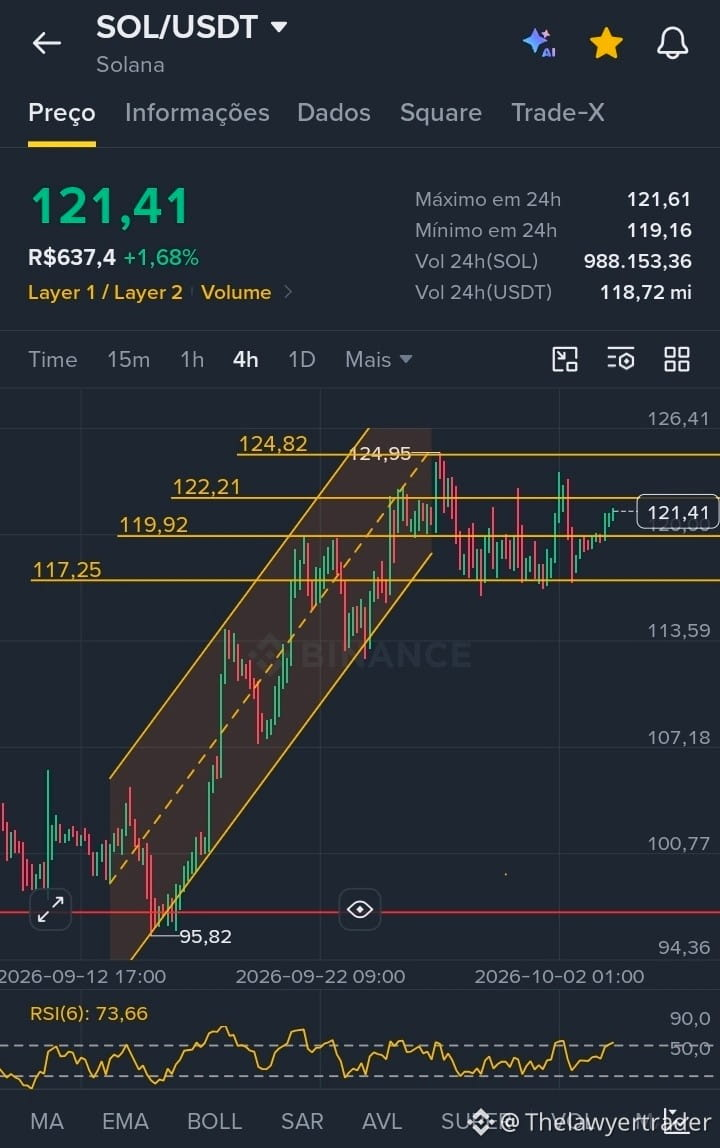
O Solana (SOL) opera em 121,41 USDT no gráfico de 4 horas, após romper um canal de alta e entrar em fase de consolidação lateral.
Padrão gráfico visível:
Canal de alta rompido seguido de lateralização entre 117,25 e 122,21.
Suportes: zona horizontal em 117,25.
Resistências locais: 122,21 e 124,82.
Indicadores:
RSI (6) em 73,66, indicando sobrecompra no curto prazo. Isso pede cautela com novas entradas agressivas até haver correção ou confirmação de suporte.
Probabilidade e cenário:
Padrão de consolidação (probabilidade média de continuação): o ativo aguarda um gatilho para definir direção.
Cenário de alta: rompimento sustentado acima de 122,21 com volume abriria caminho para 124,82.
Cenário de baixa: perda de 117,25 poderia levar a uma correção mais profunda, aliviando o RSI sobrecomprado.
Conclusão:
Momento de observação e gestão de risco. Sem confirmação de rompimento, o ideal é aguardar o preço respeitar suporte ou romper resistência com volume antes de posições mais agressivas.
⚠️ Análise meramente informativa, baseada em análise técnica. Não constitui recomendação de investimento. Criptoativos são voláteis, portanto, invista com responsabilidade.
#solana #SolanaStrong $SOL
Análise SOL/USDT — Gráfico de 4 horas
O Solana (SOL) opera em 121,41 USDT no gráfico de 4 horas, após romper um canal de alta e entrar em fase de consolidação lateral.
Padrão gráfico visível:
Canal de alta rompido seguido de lateralização entre 117,25 e 122,21.
Suportes: zona horizontal em 117,25.
Resistências locais: 122,21 e 124,82.
Indicadores:
RSI (6) em 73,66, indicando sobrecompra no curto prazo. Isso pede cautela com novas entradas agressivas até haver correção ou confirmação de suporte.
Probabilidade e cenário:
Padrão de consolidação (probabilidade média de continuação): o ativo aguarda um gatilho para definir direção.
Cenário de alta: rompimento sustentado acima de 122,21 com volume abriria caminho para 124,82.
Cenário de baixa: perda de 117,25 poderia levar a uma correção mais profunda, aliviando o RSI sobrecomprado.
Conclusão:
Momento de observação e gestão de risco. Sem confirmação de rompimento, o ideal é aguardar o preço respeitar suporte ou romper resistência com volume antes de posições mais agressivas.
⚠️ Análise meramente informativa, baseada em análise técnica. Não constitui recomendação de investimento. Criptoativos são voláteis, portanto, invista com responsabilidade.
#solana #SolanaStrong $SOL
O Solana (SOL) opera em 121,41 USDT no gráfico de 4 horas, após romper um canal de alta e entrar em fase de consolidação lateral.
Padrão gráfico visível:
Canal de alta rompido seguido de lateralização entre 117,25 e 122,21.
Suportes: zona horizontal em 117,25.
Resistências locais: 122,21 e 124,82.
Indicadores:
RSI (6) em 73,66, indicando sobrecompra no curto prazo. Isso pede cautela com novas entradas agressivas até haver correção ou confirmação de suporte.
Probabilidade e cenário:
Padrão de consolidação (probabilidade média de continuação): o ativo aguarda um gatilho para definir direção.
Cenário de alta: rompimento sustentado acima de 122,21 com volume abriria caminho para 124,82.
Cenário de baixa: perda de 117,25 poderia levar a uma correção mais profunda, aliviando o RSI sobrecomprado.
Conclusão:
Momento de observação e gestão de risco. Sem confirmação de rompimento, o ideal é aguardar o preço respeitar suporte ou romper resistência com volume antes de posições mais agressivas.
⚠️ Análise meramente informativa, baseada em análise técnica. Não constitui recomendação de investimento. Criptoativos são voláteis, portanto, invista com responsabilidade.
#solana #SolanaStrong $SOL
1
174

අර්ධ වශයෙන් සත්යයි

ලිපිය
📈 Solana (SOL) fecha Q3 com alta histórica de 48% e esmaga desempenho do BTC e XRP! Veja os dadosA Solana (SOL) estabilizou em 118,57 USDT, registrando uma leve oscilação lateral de acomodação nas últimas 24 horas. Após romper as principais resistências da semana, o ativo encontrou um forte ponto de equilíbrio técnico, defendendo confortavelmente o novo suporte acima do patamar de $116. O volume de negociações diárias segue robusto.
------------------------------
📊 1. Fechamento de Trimestre Histórico e Comparação de Mercado
* Desempenho no Q3 2026: Dados consolidados do mercado apontam que a Solana fechou o terceiro trimestre de 2026 com uma alta expressiva de 48%. O token disparou do piso de $80 em julho para consolidar sua permanência firme na casa dos três dígitos no fechamento de setembro.
* Ganhando de Gigantes: O rali trimestral da SOL superou com ampla folga o desempenho do Bitcoin (+36%) e do XRP (+37%) no mesmo período, reafirmando o favoritismo e a força do ecossistema frente ao mercado geral de altcoins.
⚙️ 2. Atualizações da Rede e Integração Multichain
* Chegada do Hyperliquid (HYPE): No ambiente de ecossistema, o ativo nativo da Hyperliquid, o HYPE, foi oficialmente implantado na blockchain da Solana utilizando a tecnologia de transporte de tokens Wormhole NTT. A integração permite que investidores da rede transacionem e guardem o ativo de forma descentralizada diretamente nas carteiras da SOL. [3]
* Monitoramento do Alpenglow: Com a versão do software Agave 4.3 em andamento, as redes de teste seguem avaliando as mudanças na dinâmica de blocos. A expectativa de longo prazo com o novo formato de consenso continua sendo atingir a finalidade de transação na escala de 150 milissegundos.
------------------------------
📊 Visão Geral de Mercado e Bandas Técnicas (SOL/USDT)
| Métrica de Mercado | Status Atual (3 de Outubro) | Impacto no Portfólio |
|---|---|---|
| Preço de Mercado | 118,57 USDT | Estabilização saudável para consolidação de fundos gráficos. |
| Zona de Suporte | 116,66 USDT | Piso de segurança imediato defendido pelos compradores de varejo. |
| Zona de Resistência | 123,73 USDT | O rompimento deste teto abre caminho para testar a máxima recente de $124. |
------------------------------
💡 Nota do Investidor: A consolidação estável na casa dos $118 valida a força da Solana após fechar um trimestre com quase 50% de ganho real em dólares.
*Esse post não é uma sugestão de investimento, faça sua própria pesquisa e análise de risco. (DYOR) #Binance #BinanceSquare #SolanaStrong #solana #TechnicalAnalysiss
📈 Solana (SOL) fecha Q3 com alta histórica de 48% e esmaga desempenho do BTC e XRP! Veja os dados
A Solana (SOL) estabilizou em 118,57 USDT, registrando uma leve oscilação lateral de acomodação nas últimas 24 horas. Após romper as principais resistências da semana, o ativo encontrou um forte ponto de equilíbrio técnico, defendendo confortavelmente o novo suporte acima do patamar de $116. O volume de negociações diárias segue robusto.
------------------------------
📊 1. Fechamento de Trimestre Histórico e Comparação de Mercado
* Desempenho no Q3 2026: Dados consolidados do mercado apontam que a Solana fechou o terceiro trimestre de 2026 com uma alta expressiva de 48%. O token disparou do piso de $80 em julho para consolidar sua permanência firme na casa dos três dígitos no fechamento de setembro.
* Ganhando de Gigantes: O rali trimestral da SOL superou com ampla folga o desempenho do Bitcoin (+36%) e do XRP (+37%) no mesmo período, reafirmando o favoritismo e a força do ecossistema frente ao mercado geral de altcoins.
⚙️ 2. Atualizações da Rede e Integração Multichain
* Chegada do Hyperliquid (HYPE): No ambiente de ecossistema, o ativo nativo da Hyperliquid, o HYPE, foi oficialmente implantado na blockchain da Solana utilizando a tecnologia de transporte de tokens Wormhole NTT. A integração permite que investidores da rede transacionem e guardem o ativo de forma descentralizada diretamente nas carteiras da SOL. [3]
* Monitoramento do Alpenglow: Com a versão do software Agave 4.3 em andamento, as redes de teste seguem avaliando as mudanças na dinâmica de blocos. A expectativa de longo prazo com o novo formato de consenso continua sendo atingir a finalidade de transação na escala de 150 milissegundos.
------------------------------
📊 Visão Geral de Mercado e Bandas Técnicas (SOL/USDT)
| Métrica de Mercado | Status Atual (3 de Outubro) | Impacto no Portfólio |
|---|---|---|
| Preço de Mercado | 118,57 USDT | Estabilização saudável para consolidação de fundos gráficos. |
| Zona de Suporte | 116,66 USDT | Piso de segurança imediato defendido pelos compradores de varejo. |
| Zona de Resistência | 123,73 USDT | O rompimento deste teto abre caminho para testar a máxima recente de $124. |
------------------------------
💡 Nota do Investidor: A consolidação estável na casa dos $118 valida a força da Solana após fechar um trimestre com quase 50% de ganho real em dólares.
*Esse post não é uma sugestão de investimento, faça sua própria pesquisa e análise de risco. (DYOR) #Binance #BinanceSquare #SolanaStrong #solana #TechnicalAnalysiss
------------------------------
📊 1. Fechamento de Trimestre Histórico e Comparação de Mercado
* Desempenho no Q3 2026: Dados consolidados do mercado apontam que a Solana fechou o terceiro trimestre de 2026 com uma alta expressiva de 48%. O token disparou do piso de $80 em julho para consolidar sua permanência firme na casa dos três dígitos no fechamento de setembro.
* Ganhando de Gigantes: O rali trimestral da SOL superou com ampla folga o desempenho do Bitcoin (+36%) e do XRP (+37%) no mesmo período, reafirmando o favoritismo e a força do ecossistema frente ao mercado geral de altcoins.
⚙️ 2. Atualizações da Rede e Integração Multichain
* Chegada do Hyperliquid (HYPE): No ambiente de ecossistema, o ativo nativo da Hyperliquid, o HYPE, foi oficialmente implantado na blockchain da Solana utilizando a tecnologia de transporte de tokens Wormhole NTT. A integração permite que investidores da rede transacionem e guardem o ativo de forma descentralizada diretamente nas carteiras da SOL. [3]
* Monitoramento do Alpenglow: Com a versão do software Agave 4.3 em andamento, as redes de teste seguem avaliando as mudanças na dinâmica de blocos. A expectativa de longo prazo com o novo formato de consenso continua sendo atingir a finalidade de transação na escala de 150 milissegundos.
------------------------------
📊 Visão Geral de Mercado e Bandas Técnicas (SOL/USDT)
| Métrica de Mercado | Status Atual (3 de Outubro) | Impacto no Portfólio |
|---|---|---|
| Preço de Mercado | 118,57 USDT | Estabilização saudável para consolidação de fundos gráficos. |
| Zona de Suporte | 116,66 USDT | Piso de segurança imediato defendido pelos compradores de varejo. |
| Zona de Resistência | 123,73 USDT | O rompimento deste teto abre caminho para testar a máxima recente de $124. |
------------------------------
💡 Nota do Investidor: A consolidação estável na casa dos $118 valida a força da Solana após fechar um trimestre com quase 50% de ganho real em dólares.
*Esse post não é uma sugestão de investimento, faça sua própria pesquisa e análise de risco. (DYOR) #Binance #BinanceSquare #SolanaStrong #solana #TechnicalAnalysiss
_jocielmartins_:
compre #Clo
2
2
1.9k

Here is the latest update for $SOL (SOL) on Binance today:
$SOL (SOL) Live Market Overview on Binance
Current Price: ~$121.60 USD
24-Hour Range: $118.94 – $121.68 USD
24-Hour Change: Up by approximately +1.5% to +1.7%
Market Position / Rank: Ranked #5 overall by market capitalization globally.
24-Hour Trading Volume: Over $1.5 Billion USD
Key Market Dynamics Today:
Trend: SOL is trading in a steady upward range, consolidating firmly above the $120 support zone.
Support Level: Immediate strong support is around $118.50 – $119.00.
Resistance Level: Immediate short-term resistance lies around $122.00 – $125.00.
#SolanaStrong
#sol板块
#SOLFI
#SolanaUSTD
#solanAnalysis
Here is the latest update for $SOL (SOL) on Binance today:
$SOL (SOL) Live Market Overview on Binance
Current Price: ~$121.60 USD
24-Hour Range: $118.94 – $121.68 USD
24-Hour Change: Up by approximately +1.5% to +1.7%
Market Position / Rank: Ranked #5 overall by market capitalization globally.
24-Hour Trading Volume: Over $1.5 Billion USD
Key Market Dynamics Today:
Trend: SOL is trading in a steady upward range, consolidating firmly above the $120 support zone.
Support Level: Immediate strong support is around $118.50 – $119.00.
Resistance Level: Immediate short-term resistance lies around $122.00 – $125.00.
#SolanaStrong
#sol板块
#SOLFI
#SolanaUSTD
#solanAnalysis
$SOL (SOL) Live Market Overview on Binance
Current Price: ~$121.60 USD
24-Hour Range: $118.94 – $121.68 USD
24-Hour Change: Up by approximately +1.5% to +1.7%
Market Position / Rank: Ranked #5 overall by market capitalization globally.
24-Hour Trading Volume: Over $1.5 Billion USD
Key Market Dynamics Today:
Trend: SOL is trading in a steady upward range, consolidating firmly above the $120 support zone.
Support Level: Immediate strong support is around $118.50 – $119.00.
Resistance Level: Immediate short-term resistance lies around $122.00 – $125.00.
#SolanaStrong
#sol板块
#SOLFI
#SolanaUSTD
#solanAnalysis
106

·
--
SOLANA ($SOL ) — TODAY’S UPDATE 👀
🔥 Why is SOL moving up?
📈 Institutional & ETF demand is supporting $SOL
⚡ Solana network activity remains strong
💥 Short positions getting closed can add buying pressure
🚀 Alpenglow upgrade is also keeping attention on Solana
⚠️ But there is a key battle around $120–$125 resistance.
If$SOL breaks and holds above this zone, momentum could strengthen.
If it gets rejected, traders may watch the $116–$119 support area.
💬 Are you BULLISH 🟢 or BEARISH 🔴 on SOL?
#Solana
{spot}(SOLUSDT)
#SolanaStrong
SOLANA ($SOL ) — TODAY’S UPDATE 👀
🔥 Why is SOL moving up?
📈 Institutional & ETF demand is supporting $SOL
⚡ Solana network activity remains strong
💥 Short positions getting closed can add buying pressure
🚀 Alpenglow upgrade is also keeping attention on Solana
⚠️ But there is a key battle around $120–$125 resistance.
If$SOL breaks and holds above this zone, momentum could strengthen.
If it gets rejected, traders may watch the $116–$119 support area.
💬 Are you BULLISH 🟢 or BEARISH 🔴 on SOL?
#Solana
#SolanaStrong
🔥 Why is SOL moving up?
📈 Institutional & ETF demand is supporting $SOL
⚡ Solana network activity remains strong
💥 Short positions getting closed can add buying pressure
🚀 Alpenglow upgrade is also keeping attention on Solana
⚠️ But there is a key battle around $120–$125 resistance.
If$SOL breaks and holds above this zone, momentum could strengthen.
If it gets rejected, traders may watch the $116–$119 support area.
💬 Are you BULLISH 🟢 or BEARISH 🔴 on SOL?
#Solana
#SolanaStrong
75

Solana Has the Setup, But Price Still Needs Proof.
Solana’s institutional stack is no longer theoretical.
In October 2025, Bitwise launched BSOL, the first U.S. spot Solana staking ETF, followed by Grayscale’s GSOL.
By 2026, multiple Solana ETF products were filing and reporting with the SEC. Solana also now hosts $4B+ in institutional RWAs.
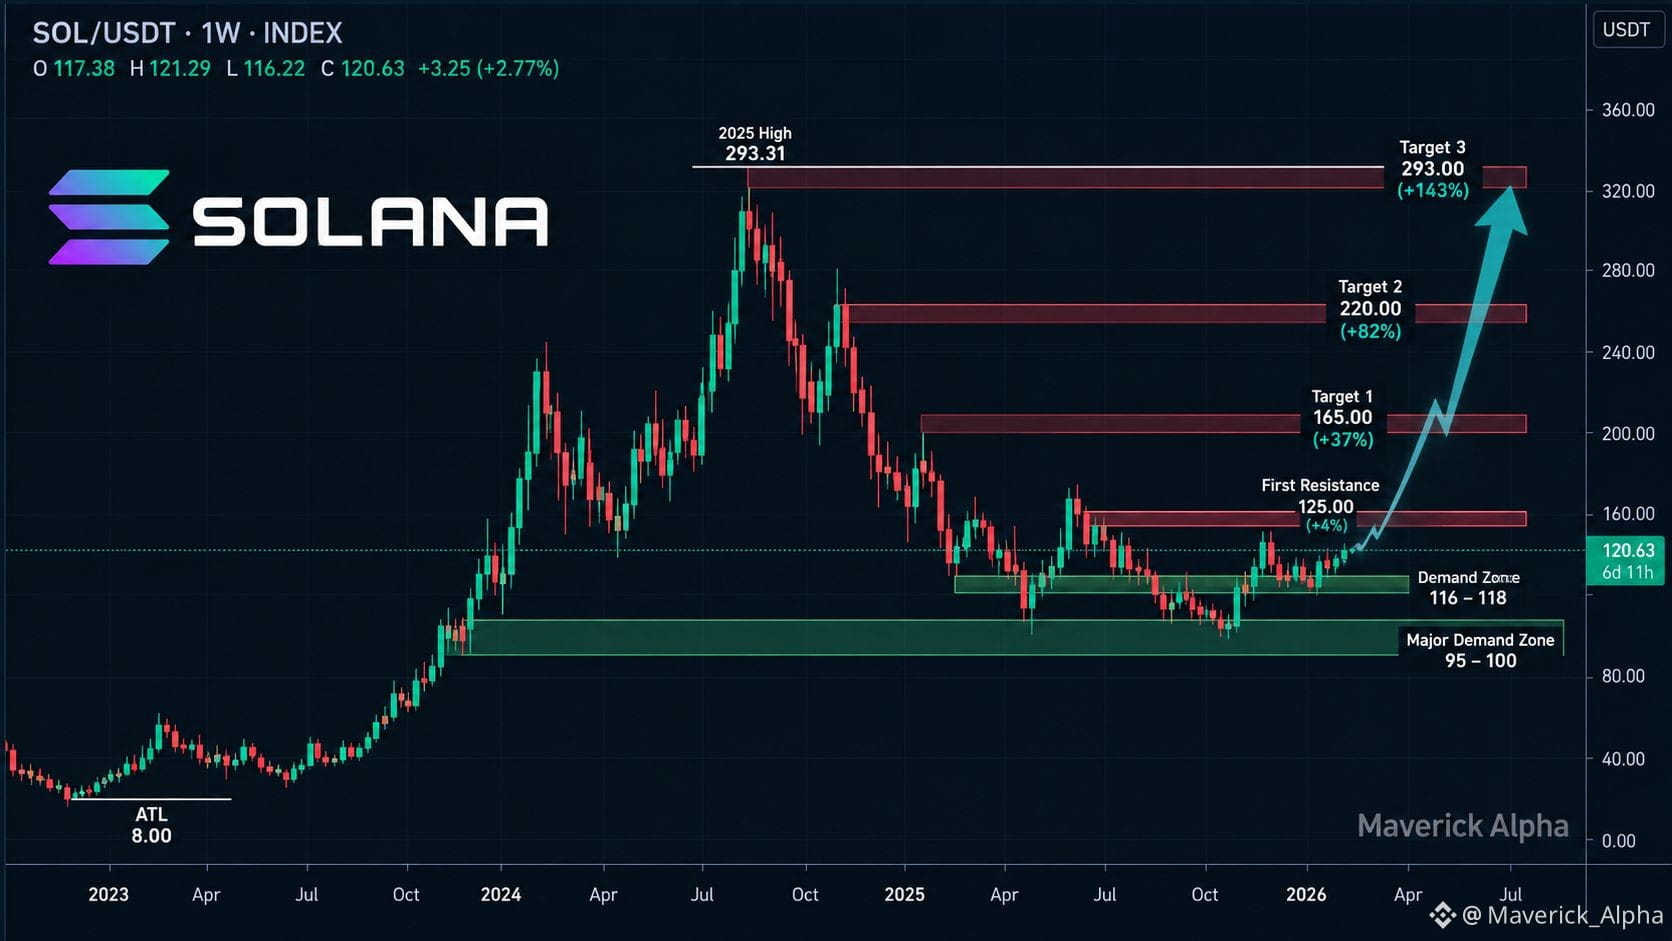
Price reality: SOL is around $120, roughly 240× above its $0.50 ATL, but still about 59% below the $293.31 peak.
None of the institutional progress has fully shown up in price.
This is a watch, not a long.
The level that matters: $116–118. Lose it and the current recovery structure weakens.
First sign sentiment’s turning: $125 reclaim.
The market now wants sustained ETF flows, real on-chain usage and measurable economic activity — not another announcement.
#SolanaStrong
$SOL
{future}(SOLUSDT)
Solana Has the Setup, But Price Still Needs Proof.
Solana’s institutional stack is no longer theoretical.
In October 2025, Bitwise launched BSOL, the first U.S. spot Solana staking ETF, followed by Grayscale’s GSOL.
By 2026, multiple Solana ETF products were filing and reporting with the SEC. Solana also now hosts $4B+ in institutional RWAs.
Price reality: SOL is around $120, roughly 240× above its $0.50 ATL, but still about 59% below the $293.31 peak.
None of the institutional progress has fully shown up in price.
This is a watch, not a long.
The level that matters: $116–118. Lose it and the current recovery structure weakens.
First sign sentiment’s turning: $125 reclaim.
The market now wants sustained ETF flows, real on-chain usage and measurable economic activity — not another announcement.
#SolanaStrong
$SOL
Solana’s institutional stack is no longer theoretical.
In October 2025, Bitwise launched BSOL, the first U.S. spot Solana staking ETF, followed by Grayscale’s GSOL.
By 2026, multiple Solana ETF products were filing and reporting with the SEC. Solana also now hosts $4B+ in institutional RWAs.
Price reality: SOL is around $120, roughly 240× above its $0.50 ATL, but still about 59% below the $293.31 peak.
None of the institutional progress has fully shown up in price.
This is a watch, not a long.
The level that matters: $116–118. Lose it and the current recovery structure weakens.
First sign sentiment’s turning: $125 reclaim.
The market now wants sustained ETF flows, real on-chain usage and measurable economic activity — not another announcement.
#SolanaStrong
$SOL
1
89

·
--
$SOL #SolanaStrong @Square-Creator-e4e0d3c67ef6
Solana (SOL) Price Outlook: What’s Next for the Layer-1 Giant? 🚀
Solana ($SOL) remains a standout performer in the crypto ecosystem, driven by high throughput, low transaction fees, and rapid adoption across DeFi, NFTs, and Web3 payments. With market activity picking up, traders and long-term investors are keeping a close eye on key levels.
📊 Technical & On-Chain Indicators
Moving Averages: SOL’s long-term trend remains healthy, with its 200-day Simple Moving Average (SMA) sloping upward and serving as a crucial macro support floor.
Relative Strength Index (RSI): Sitting in the neutral 30–70 zone, indicating room for a decisive move in either direction without being overbought or oversold.
Network Health: Low transaction costs and steady network activity continue to support developer retention and dApp deployment, providing strong structural support
$SOL #SolanaStrong @_SOLANA_
Solana (SOL) Price Outlook: What’s Next for the Layer-1 Giant? 🚀
Solana ($SOL ) remains a standout performer in the crypto ecosystem, driven by high throughput, low transaction fees, and rapid adoption across DeFi, NFTs, and Web3 payments. With market activity picking up, traders and long-term investors are keeping a close eye on key levels.
📊 Technical & On-Chain Indicators
Moving Averages: SOL’s long-term trend remains healthy, with its 200-day Simple Moving Average (SMA) sloping upward and serving as a crucial macro support floor.
Relative Strength Index (RSI): Sitting in the neutral 30–70 zone, indicating room for a decisive move in either direction without being overbought or oversold.
Network Health: Low transaction costs and steady network activity continue to support developer retention and dApp deployment, providing strong structural support
Solana (SOL) Price Outlook: What’s Next for the Layer-1 Giant? 🚀
Solana ($SOL ) remains a standout performer in the crypto ecosystem, driven by high throughput, low transaction fees, and rapid adoption across DeFi, NFTs, and Web3 payments. With market activity picking up, traders and long-term investors are keeping a close eye on key levels.
📊 Technical & On-Chain Indicators
Moving Averages: SOL’s long-term trend remains healthy, with its 200-day Simple Moving Average (SMA) sloping upward and serving as a crucial macro support floor.
Relative Strength Index (RSI): Sitting in the neutral 30–70 zone, indicating room for a decisive move in either direction without being overbought or oversold.
Network Health: Low transaction costs and steady network activity continue to support developer retention and dApp deployment, providing strong structural support

107

🟢UP TRADING BASED ON CURRENT SUPPORT 🚀
$SOL 15m chart, here are key price levels for a long trade based on current support and resistance levels:
Entry Price : $119.50 – $119.67
Stop Loss : $116.30
Take Profit 1 : $121.00
Take Profit 2 : $123.50
...............
$ETH 15-minute chart provided:
Trade Setup (Long / Up Trade):
Entry Price : $2,680.00 – $2,681.00
Stop Loss : $2,648.00
Take Profit 1 : $2,728.00
Take Profit 2 : $2,775.00
(Always manage your risk carefully and adjust leverage or position size to fit your risk tolerance.)
..............
$BTC 15m chart provided in the screenshot, here are trade parameters for a long (up) trade:
EP : 84,800.00 – 84,840.00
SL : 83,600.00
TP1 : 86,400.00
TP2 : 87,200.00
Always practice risk management by setting appropriate position sizing and moving your SL to break-even once TP1 is reached. DYOR
{spot}(ETHUSDT)
{future}(BTCUSDT)
{future}(SOLUSDT)
#USRussiaUkraineTalksReportedlyIncludeLukoilOilDeal
#SECProposesCryptoCustodyRules
#NvidiaHitsRecordHighUp2.4%
#SolanaStrong
#BTC走势分析
🟢UP TRADING BASED ON CURRENT SUPPORT 🚀
$SOL 15m chart, here are key price levels for a long trade based on current support and resistance levels:
Entry Price : $119.50 – $119.67
Stop Loss : $116.30
Take Profit 1 : $121.00
Take Profit 2 : $123.50
...............
$ETH 15-minute chart provided:
Trade Setup (Long / Up Trade):
Entry Price : $2,680.00 – $2,681.00
Stop Loss : $2,648.00
Take Profit 1 : $2,728.00
Take Profit 2 : $2,775.00
(Always manage your risk carefully and adjust leverage or position size to fit your risk tolerance.)
..............
$BTC 15m chart provided in the screenshot, here are trade parameters for a long (up) trade:
EP : 84,800.00 – 84,840.00
SL : 83,600.00
TP1 : 86,400.00
TP2 : 87,200.00
Always practice risk management by setting appropriate position sizing and moving your SL to break-even once TP1 is reached. DYOR
#USRussiaUkraineTalksReportedlyIncludeLukoilOilDeal
#SECProposesCryptoCustodyRules
#NvidiaHitsRecordHighUp2.4%
#SolanaStrong
#BTC走势分析
$SOL 15m chart, here are key price levels for a long trade based on current support and resistance levels:
Entry Price : $119.50 – $119.67
Stop Loss : $116.30
Take Profit 1 : $121.00
Take Profit 2 : $123.50
...............
$ETH 15-minute chart provided:
Trade Setup (Long / Up Trade):
Entry Price : $2,680.00 – $2,681.00
Stop Loss : $2,648.00
Take Profit 1 : $2,728.00
Take Profit 2 : $2,775.00
(Always manage your risk carefully and adjust leverage or position size to fit your risk tolerance.)
..............
$BTC 15m chart provided in the screenshot, here are trade parameters for a long (up) trade:
EP : 84,800.00 – 84,840.00
SL : 83,600.00
TP1 : 86,400.00
TP2 : 87,200.00
Always practice risk management by setting appropriate position sizing and moving your SL to break-even once TP1 is reached. DYOR
#USRussiaUkraineTalksReportedlyIncludeLukoilOilDeal
#SECProposesCryptoCustodyRules
#NvidiaHitsRecordHighUp2.4%
#SolanaStrong
#BTC走势分析
BULLISH
69%
BEARISH
31%
32 ඡන්ද • ඡන්දය අවසන්
1
6
8
573

·
--
⚡ $SOL — WATCH THE VOLUME, NOT JUST THE CANDLE
Solana remains one of the major altcoins I keep on the watchlist.
But here's the key question:
Is $SOL gaining REAL participation, or is the market simply reacting to short-term momentum?
I'm watching:
📊 SOL trading volume
📈 Relative strength
💧 Liquidity
🔥 Momentum vs. BTC & ETH
A strong move backed by sustained volume is much more interesting than a quick pump followed by fading activity.
No guaranteed targets. No blind calls.
Let the market confirm the move.
Are you watching $SOL for the next major altcoin rotation?
👇 Bullish, bearish, or waiting for confirmation?
#SOL #SolanaStrong #crypto #altcoins #BTC #ETH #BinanceSquare #CryptoTrading #MarketAnalysis #DYOR
{future}(SOLUSDT)
⚡ $SOL — WATCH THE VOLUME, NOT JUST THE CANDLE
Solana remains one of the major altcoins I keep on the watchlist.
But here's the key question:
Is $SOL gaining REAL participation, or is the market simply reacting to short-term momentum?
I'm watching:
📊 SOL trading volume
📈 Relative strength
💧 Liquidity
🔥 Momentum vs. BTC & ETH
A strong move backed by sustained volume is much more interesting than a quick pump followed by fading activity.
No guaranteed targets. No blind calls.
Let the market confirm the move.
Are you watching $SOL for the next major altcoin rotation?
👇 Bullish, bearish, or waiting for confirmation?
#SOL #SolanaStrong #crypto #altcoins #BTC #ETH #BinanceSquare #CryptoTrading #MarketAnalysis #DYOR
Solana remains one of the major altcoins I keep on the watchlist.
But here's the key question:
Is $SOL gaining REAL participation, or is the market simply reacting to short-term momentum?
I'm watching:
📊 SOL trading volume
📈 Relative strength
💧 Liquidity
🔥 Momentum vs. BTC & ETH
A strong move backed by sustained volume is much more interesting than a quick pump followed by fading activity.
No guaranteed targets. No blind calls.
Let the market confirm the move.
Are you watching $SOL for the next major altcoin rotation?
👇 Bullish, bearish, or waiting for confirmation?
#SOL #SolanaStrong #crypto #altcoins #BTC #ETH #BinanceSquare #CryptoTrading #MarketAnalysis #DYOR
57

@Square-Creator-810195574 /@Square-Creator-5e2421402 — Short Market Analysis
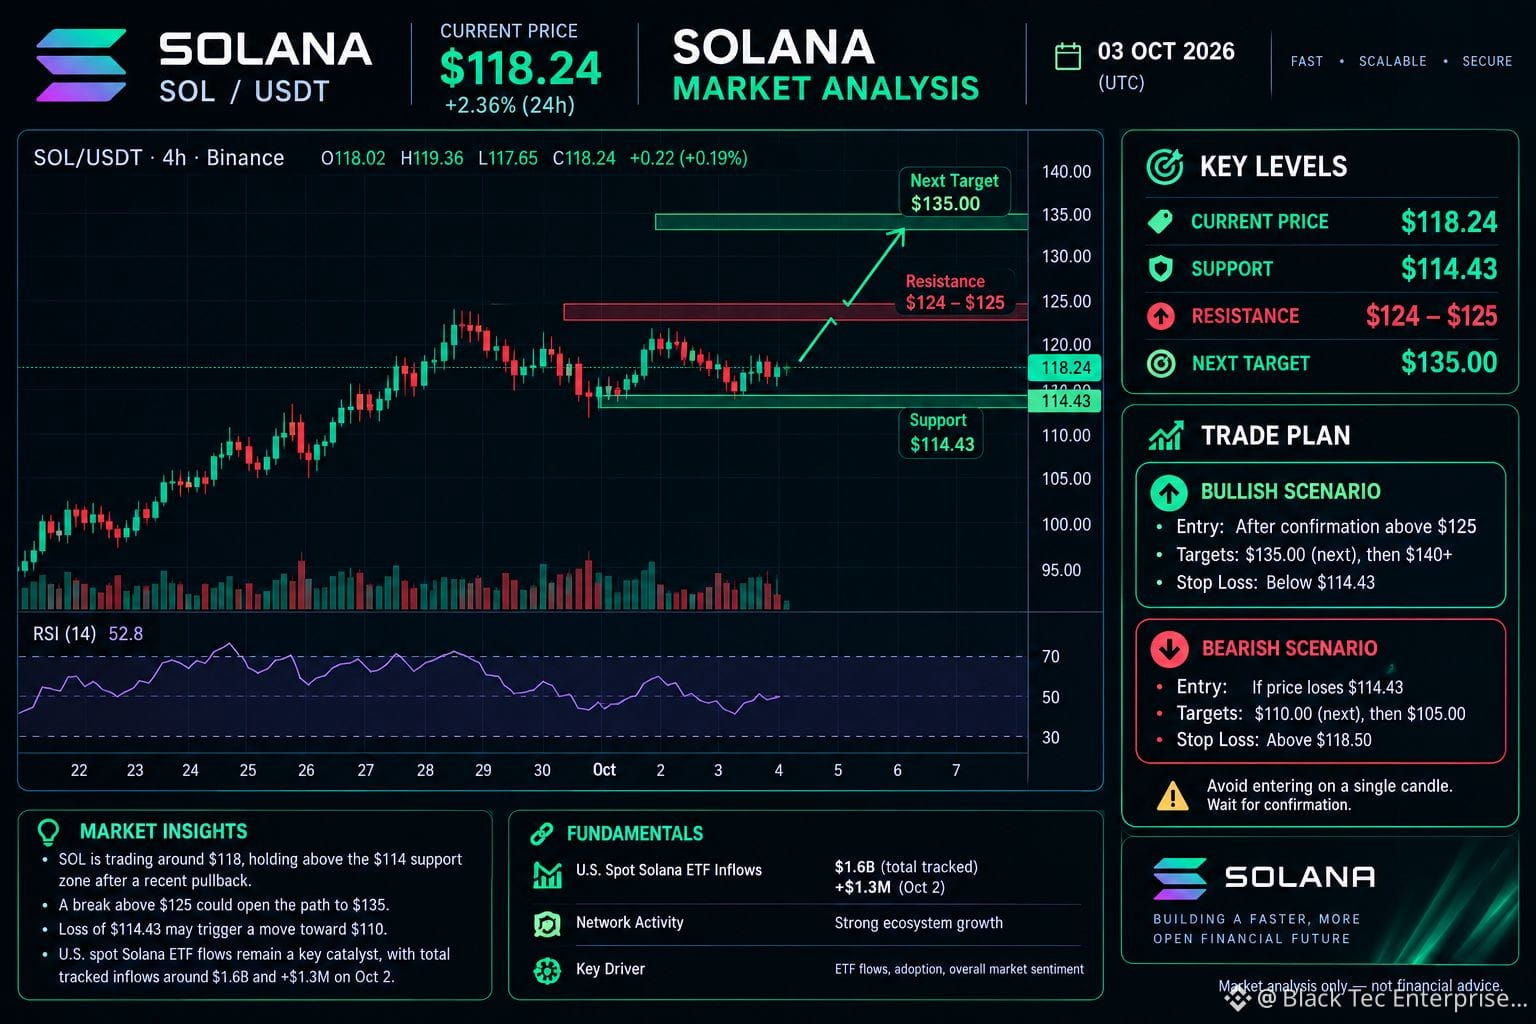
Price: ~$118.24
Support: $114.43
Resistance: $124–$125
Target: $135
SOL is holding above the key $114.43 support. A confirmed breakout above $125 could open the path toward $135, while losing $114.43 may bring downside pressure toward $110. ETF flows remain an important catalyst.
{spot}(SOLUSDT)
#SolanaStrong #USSeptemberPayrollsAdd29KUnemploymentRises4.2% #sol板块 #SolanaUSTD #solanAnalysis
@soL /@usdt- — Short Market Analysis
Price: ~$118.24
Support: $114.43
Resistance: $124–$125
Target: $135
SOL is holding above the key $114.43 support. A confirmed breakout above $125 could open the path toward $135, while losing $114.43 may bring downside pressure toward $110. ETF flows remain an important catalyst.
#SolanaStrong #USSeptemberPayrollsAdd29KUnemploymentRises4.2% #sol板块 #SolanaUSTD #solanAnalysis
Price: ~$118.24
Support: $114.43
Resistance: $124–$125
Target: $135
SOL is holding above the key $114.43 support. A confirmed breakout above $125 could open the path toward $135, while losing $114.43 may bring downside pressure toward $110. ETF flows remain an important catalyst.
#SolanaStrong #USSeptemberPayrollsAdd29KUnemploymentRises4.2% #sol板块 #SolanaUSTD #solanAnalysis
279

·
--
⚡ SOLANA'S QUIET COMEBACK: 46% Up in a Month, Schwab Just Jumped In
SOL sits around $102 after ending a brutal 10-month losing streak with a 46% August surge. Charles Schwab now offers SOL trading; daily fees hit a record $33.2M.
Why it's moving: Ecosystem tokens like RAY up 60%+, holding above all major EMAs.
Levels: ⚠️ MACD cooling — a pause wouldn't mean reversal
👉 Is SOL's comeback just getting started? 📈
$SOL
{spot}(SOLUSDT)
#SolanaStrong
⚡ SOLANA'S QUIET COMEBACK: 46% Up in a Month, Schwab Just Jumped In
SOL sits around $102 after ending a brutal 10-month losing streak with a 46% August surge. Charles Schwab now offers SOL trading; daily fees hit a record $33.2M.
Why it's moving: Ecosystem tokens like RAY up 60%+, holding above all major EMAs.
Levels: ⚠️ MACD cooling — a pause wouldn't mean reversal
👉 Is SOL's comeback just getting started? 📈
$SOL
#SolanaStrong
SOL sits around $102 after ending a brutal 10-month losing streak with a 46% August surge. Charles Schwab now offers SOL trading; daily fees hit a record $33.2M.
Why it's moving: Ecosystem tokens like RAY up 60%+, holding above all major EMAs.
Levels: ⚠️ MACD cooling — a pause wouldn't mean reversal
👉 Is SOL's comeback just getting started? 📈
$SOL
#SolanaStrong
82

·
--
$SOL
{spot}(SOLUSDT)
Solana (SOL): Ready for the Next Big Breakout? 🔥
The crypto market is buzzing, and $SOL is holding the spotlight! Thanks to its lightning-fast transaction speeds, ultra-low fees, and an incredibly resilient ecosystem, Solana continues to show massive strength.
What is your price prediction for SOL this month? Are we heading straight for a new All-Time High? Drop your thoughts below!
#Binance #SolanaStrong #aman_922
#BinanceSquare #BinanceUpdates
$SOL
Solana (SOL): Ready for the Next Big Breakout? 🔥
The crypto market is buzzing, and $SOL is holding the spotlight! Thanks to its lightning-fast transaction speeds, ultra-low fees, and an incredibly resilient ecosystem, Solana continues to show massive strength.
What is your price prediction for SOL this month? Are we heading straight for a new All-Time High? Drop your thoughts below!
#Binance #SolanaStrong #aman_922
#BinanceSquare #BinanceUpdates
Solana (SOL): Ready for the Next Big Breakout? 🔥
The crypto market is buzzing, and $SOL is holding the spotlight! Thanks to its lightning-fast transaction speeds, ultra-low fees, and an incredibly resilient ecosystem, Solana continues to show massive strength.
What is your price prediction for SOL this month? Are we heading straight for a new All-Time High? Drop your thoughts below!
#Binance #SolanaStrong #aman_922
#BinanceSquare #BinanceUpdates
4
407

Solana (SOL) — current situation
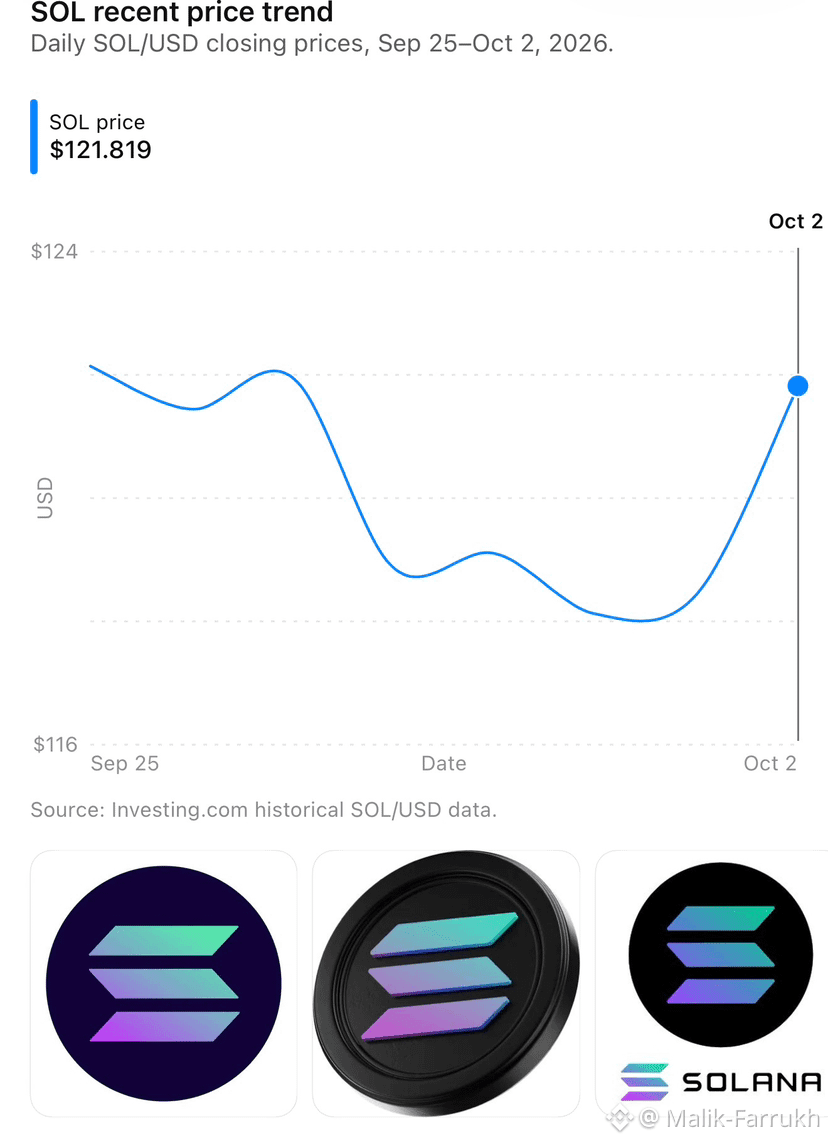
* Price: about $122, up roughly 3–4% today.
* Short-term trend: SOL has recovered from around $118 and is testing the $123–124 area.
* Recent catalyst: Forward Industries reported increasing its SOL holdings to 8.5 million SOL, while Robinhood announced plans for SOL perpetual futures.
* Risk: Crypto remains highly volatile; the current move does not guarantee that the uptrend will continu
#SolanaStrong
#USSeptemberPayrollsAdd29KUnemploymentRises4.2%
#AmazonPlansToSell$8BNvidiaChips
#solanAnalysis
Solana (SOL) — current situation
* Price: about $122, up roughly 3–4% today.
* Short-term trend: SOL has recovered from around $118 and is testing the $123–124 area.
* Recent catalyst: Forward Industries reported increasing its SOL holdings to 8.5 million SOL, while Robinhood announced plans for SOL perpetual futures.
* Risk: Crypto remains highly volatile; the current move does not guarantee that the uptrend will continu
#SolanaStrong
#USSeptemberPayrollsAdd29KUnemploymentRises4.2%
#AmazonPlansToSell$8BNvidiaChips
#solanAnalysis
* Price: about $122, up roughly 3–4% today.
* Short-term trend: SOL has recovered from around $118 and is testing the $123–124 area.
* Recent catalyst: Forward Industries reported increasing its SOL holdings to 8.5 million SOL, while Robinhood announced plans for SOL perpetual futures.
* Risk: Crypto remains highly volatile; the current move does not guarantee that the uptrend will continu
#SolanaStrong
#USSeptemberPayrollsAdd29KUnemploymentRises4.2%
#AmazonPlansToSell$8BNvidiaChips
#solanAnalysis
2
514
Análise SOL/USDT — (Gráfico 4h)
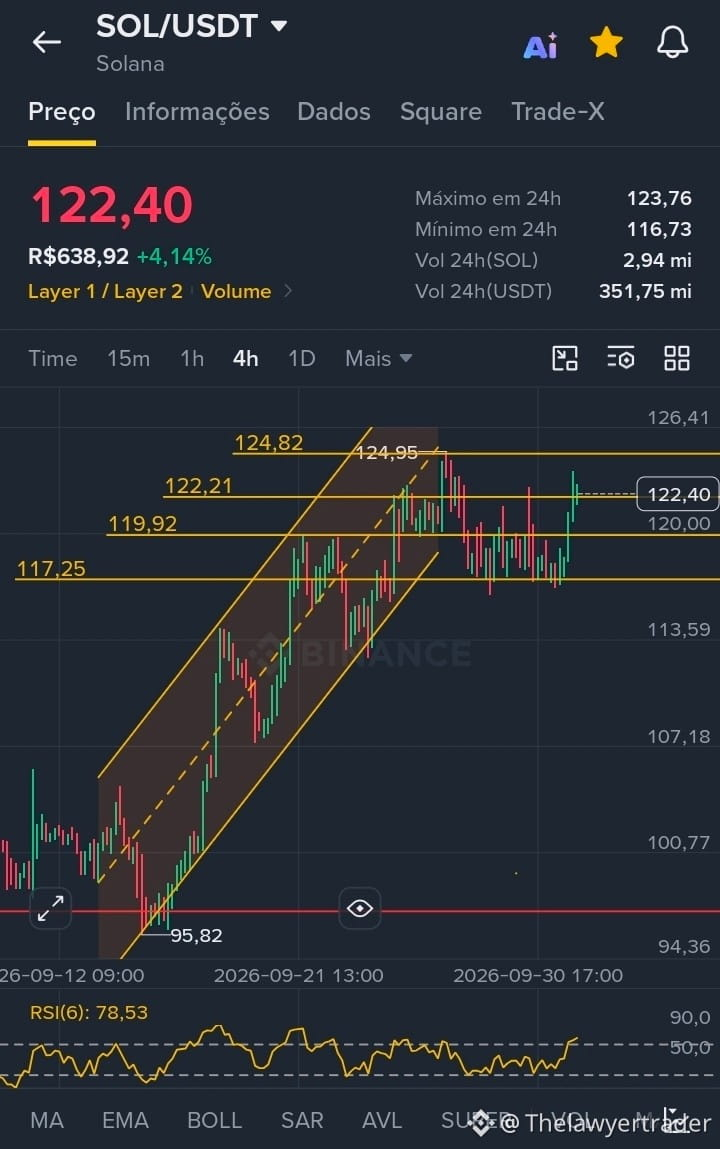
O SOL/USDT opera em 122,40 USDT, com alta de 4,14% nas últimas 24h, dentro de um contexto de canal de alta no gráfico de 4 horas. O preço recentemente rompeu a resistência superior desse canal e, após uma correção lateral, voltou a testar o patamar atual.
Padrão gráfico visível e probabilidade: há um padrão de canal de alta claramente identificável, com probabilidade moderada (cerca de 60%) de continuidade da tendência caso o preço sustente o rompimento da resistência. A confirmação depende do fechamento consistente acima da região de 122,21 a 124,82.
Níveis de referência:
Resistências: 122,21, 124,82 e 124,95
Suportes: 119,92, 117,25
Indicadores:
O RSI(6) em 78,53 sinaliza condição de sobrecompra (acima de 70), o que recomenda cautela quanto a possíveis correções de curto prazo após a alta recente.
Volume (24h):
2,94 milhões de SOL e 351,75 milhões de USDT negociados.
O cenário segue construtivo no médio prazo, mas o nível de sobrecompra pede gestão de risco e atenção à confirmação do rompimento.
Este conteúdo é informativo e não constitui recomendação de investimento.
#SolanaStrong $SOL
Análise SOL/USDT — (Gráfico 4h)
O SOL/USDT opera em 122,40 USDT, com alta de 4,14% nas últimas 24h, dentro de um contexto de canal de alta no gráfico de 4 horas. O preço recentemente rompeu a resistência superior desse canal e, após uma correção lateral, voltou a testar o patamar atual.
Padrão gráfico visível e probabilidade: há um padrão de canal de alta claramente identificável, com probabilidade moderada (cerca de 60%) de continuidade da tendência caso o preço sustente o rompimento da resistência. A confirmação depende do fechamento consistente acima da região de 122,21 a 124,82.
Níveis de referência:
Resistências: 122,21, 124,82 e 124,95
Suportes: 119,92, 117,25
Indicadores:
O RSI(6) em 78,53 sinaliza condição de sobrecompra (acima de 70), o que recomenda cautela quanto a possíveis correções de curto prazo após a alta recente.
Volume (24h):
2,94 milhões de SOL e 351,75 milhões de USDT negociados.
O cenário segue construtivo no médio prazo, mas o nível de sobrecompra pede gestão de risco e atenção à confirmação do rompimento.
Este conteúdo é informativo e não constitui recomendação de investimento.
#SolanaStrong $SOL
O SOL/USDT opera em 122,40 USDT, com alta de 4,14% nas últimas 24h, dentro de um contexto de canal de alta no gráfico de 4 horas. O preço recentemente rompeu a resistência superior desse canal e, após uma correção lateral, voltou a testar o patamar atual.
Padrão gráfico visível e probabilidade: há um padrão de canal de alta claramente identificável, com probabilidade moderada (cerca de 60%) de continuidade da tendência caso o preço sustente o rompimento da resistência. A confirmação depende do fechamento consistente acima da região de 122,21 a 124,82.
Níveis de referência:
Resistências: 122,21, 124,82 e 124,95
Suportes: 119,92, 117,25
Indicadores:
O RSI(6) em 78,53 sinaliza condição de sobrecompra (acima de 70), o que recomenda cautela quanto a possíveis correções de curto prazo após a alta recente.
Volume (24h):
2,94 milhões de SOL e 351,75 milhões de USDT negociados.
O cenário segue construtivo no médio prazo, mas o nível de sobrecompra pede gestão de risco e atenção à confirmação do rompimento.
Este conteúdo é informativo e não constitui recomendação de investimento.
#SolanaStrong $SOL
4
3.2k

·
--
උසබ තත්ත්වය
3. Is $SOL bullish or bearish today?
Short-term momentum is positive, with SOL rising alongside the broader crypto market. A report published today also highlighted increased SOL holdings at Forward Industries, which reported approximately 8.5 million SOL and SOL-equivalent tokens. This does not guarantee further price increases.
Bullish scenario: SOL breaks above $125 and holds that level.
Bearish scenario: SOL loses the $115 support area.
Wait-and-watch scenario: SOL remains between $115 and $125 without a confirmed breakout.
Avoid entering a trade based only on one green candle, particularly when using futures leverage.
4. What do you want to check next?Solana (SOL)
$122.36
1. Today's market overview
24-hour high: $122.44
24-hour low: $116.83
Market capitalization: Approximately $72 billion.
Trading volume: Approximately $3.7 billion in 24 hours.
2. Important price levels
Resistance zone
$123–$125
A break above this area could open the way toward $130, but confirmation is needed.
Support zone
$115–$117
#SolanaStrong #SOLFI
{spot}(SOLUSDT)
3. Is $SOL bullish or bearish today?
Short-term momentum is positive, with SOL rising alongside the broader crypto market. A report published today also highlighted increased SOL holdings at Forward Industries, which reported approximately 8.5 million SOL and SOL-equivalent tokens. This does not guarantee further price increases.
Bullish scenario: SOL breaks above $125 and holds that level.
Bearish scenario: SOL loses the $115 support area.
Wait-and-watch scenario: SOL remains between $115 and $125 without a confirmed breakout.
Avoid entering a trade based only on one green candle, particularly when using futures leverage.
4. What do you want to check next?Solana (SOL)
$122.36
1. Today's market overview
24-hour high: $122.44
24-hour low: $116.83
Market capitalization: Approximately $72 billion.
Trading volume: Approximately $3.7 billion in 24 hours.
2. Important price levels
Resistance zone
$123–$125
A break above this area could open the way toward $130, but confirmation is needed.
Support zone
$115–$117
#SolanaStrong #SOLFI
Short-term momentum is positive, with SOL rising alongside the broader crypto market. A report published today also highlighted increased SOL holdings at Forward Industries, which reported approximately 8.5 million SOL and SOL-equivalent tokens. This does not guarantee further price increases.
Bullish scenario: SOL breaks above $125 and holds that level.
Bearish scenario: SOL loses the $115 support area.
Wait-and-watch scenario: SOL remains between $115 and $125 without a confirmed breakout.
Avoid entering a trade based only on one green candle, particularly when using futures leverage.
4. What do you want to check next?Solana (SOL)
$122.36
1. Today's market overview
24-hour high: $122.44
24-hour low: $116.83
Market capitalization: Approximately $72 billion.
Trading volume: Approximately $3.7 billion in 24 hours.
2. Important price levels
Resistance zone
$123–$125
A break above this area could open the way toward $130, but confirmation is needed.
Support zone
$115–$117
#SolanaStrong #SOLFI
Vicky Yadav P:
At what price its can reach please let me know
1
131

·
--
උසබ තත්ත්වය
{spot}(SOLUSDT)
CRYPTO MARKET UPDATE & TECHNICAL ANALYSIS: SOLANA (SOL) GAINING MOMENTUM
Market Overview: Solana (SOL) Ignites Bullish Breakout on Binance
Solana (SOL) is showing a strong structural recovery today, gaining +4.8% over the last 24 hours to trade firmly around the $120.00 region. Following a brief consolidation near its local bottom, institutional interest and steady retail buying pressure have triggered a fresh upward expansion.
Technical Analysis: 1-Hour Chart Breakdown
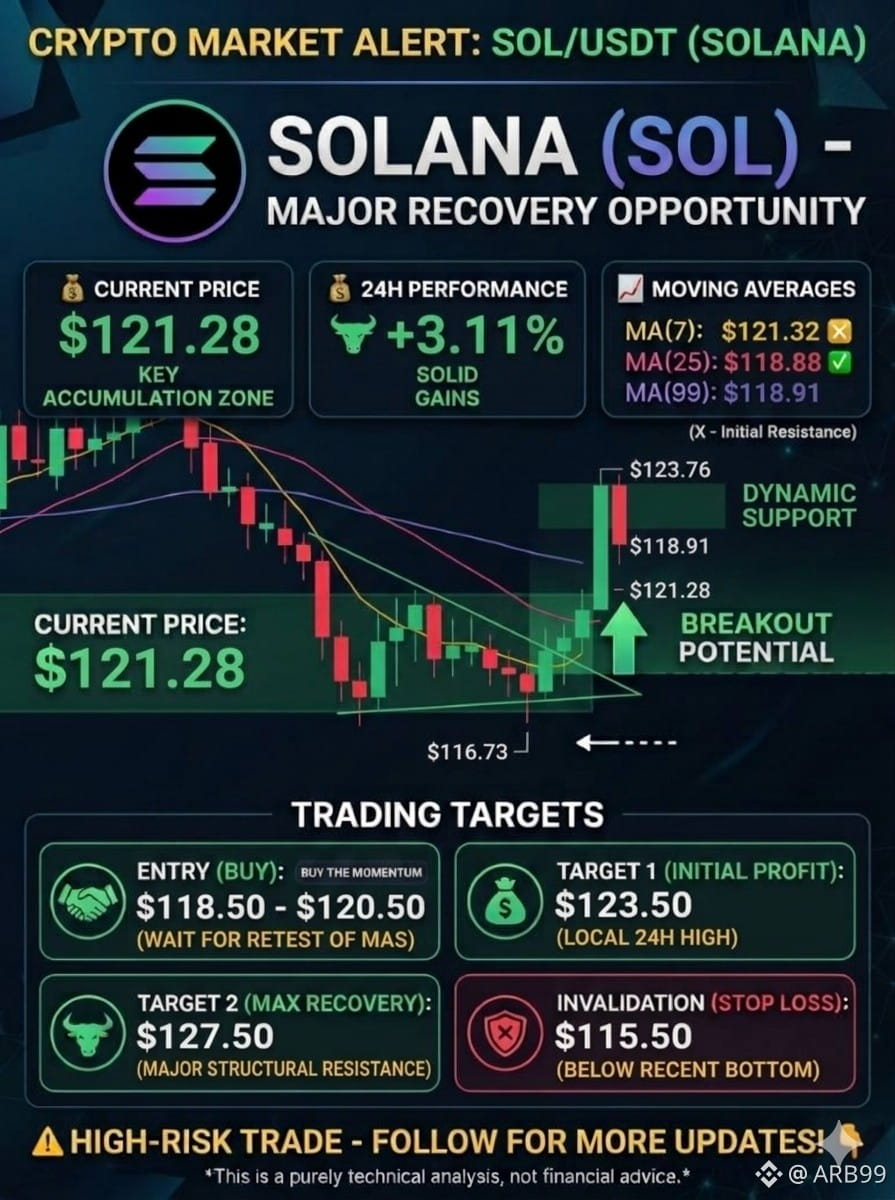
* Technical Support Defended: After stabilizing at a solid local base of $112.50, SOL successfully managed to print higher lows on the 1-hour chart, indicating that sellers have completely exhausted their momentum.
* Breaking Key Moving Averages: The asset has crossed above its immediate dynamic resistances—the MA(7) at $116.80 and the MA(25) at $118.20. It is currently challenging the overhead MA(99) resistance near $121.50 for a clean breakout confirmation.
* Sustained Buying Volume: Trading volume on Binance remains strongly positive, pointing to a continuation toward the next major resistance zones.
------------------------------------------------------------------
POTENTIAL TRADING SETUP (SPOT / SWING TRADE)
As Solana maintains a clean uptrend, taking a position on a mild pullback or around the current consolidation range offers a high-probability trade opportunity.
* Current Price: $120.00
* Strategic Entry Zone: $116.00 – $119.00
(Ideal entry on immediate momentum or a soft retest of the hourly support lines)
* Take-Profit Target 1: $128.00 (Immediate horizontal resistance)
* Take-Profit Target 2: $135.00 (Major swing high liquidity sweep)
* Strict Stop-Loss: $111.00
(Invalidation level placed securely below the recent swing bottom of $112.50)
------------------------------------------------------------------
Risk Disclaimer: Crypto trading involves high market volatility and financial risk. This analysis is for educational and tracking purposes only. Ensure proper capital allocation and risk management before executing orders.
#solana #SolanaStrong #SolanaUSTD
CRYPTO MARKET UPDATE & TECHNICAL ANALYSIS: SOLANA (SOL) GAINING MOMENTUM
Market Overview: Solana (SOL) Ignites Bullish Breakout on Binance
Solana (SOL) is showing a strong structural recovery today, gaining +4.8% over the last 24 hours to trade firmly around the $120.00 region. Following a brief consolidation near its local bottom, institutional interest and steady retail buying pressure have triggered a fresh upward expansion.
Technical Analysis: 1-Hour Chart Breakdown
* Technical Support Defended: After stabilizing at a solid local base of $112.50, SOL successfully managed to print higher lows on the 1-hour chart, indicating that sellers have completely exhausted their momentum.
* Breaking Key Moving Averages: The asset has crossed above its immediate dynamic resistances—the MA(7) at $116.80 and the MA(25) at $118.20. It is currently challenging the overhead MA(99) resistance near $121.50 for a clean breakout confirmation.
* Sustained Buying Volume: Trading volume on Binance remains strongly positive, pointing to a continuation toward the next major resistance zones.
------------------------------------------------------------------
POTENTIAL TRADING SETUP (SPOT / SWING TRADE)
As Solana maintains a clean uptrend, taking a position on a mild pullback or around the current consolidation range offers a high-probability trade opportunity.
* Current Price: $120.00
* Strategic Entry Zone: $116.00 – $119.00
(Ideal entry on immediate momentum or a soft retest of the hourly support lines)
* Take-Profit Target 1: $128.00 (Immediate horizontal resistance)
* Take-Profit Target 2: $135.00 (Major swing high liquidity sweep)
* Strict Stop-Loss: $111.00
(Invalidation level placed securely below the recent swing bottom of $112.50)
------------------------------------------------------------------
Risk Disclaimer: Crypto trading involves high market volatility and financial risk. This analysis is for educational and tracking purposes only. Ensure proper capital allocation and risk management before executing orders.
#solana #SolanaStrong #SolanaUSTD
Market Overview: Solana (SOL) Ignites Bullish Breakout on Binance
Solana (SOL) is showing a strong structural recovery today, gaining +4.8% over the last 24 hours to trade firmly around the $120.00 region. Following a brief consolidation near its local bottom, institutional interest and steady retail buying pressure have triggered a fresh upward expansion.
Technical Analysis: 1-Hour Chart Breakdown
* Technical Support Defended: After stabilizing at a solid local base of $112.50, SOL successfully managed to print higher lows on the 1-hour chart, indicating that sellers have completely exhausted their momentum.
* Breaking Key Moving Averages: The asset has crossed above its immediate dynamic resistances—the MA(7) at $116.80 and the MA(25) at $118.20. It is currently challenging the overhead MA(99) resistance near $121.50 for a clean breakout confirmation.
* Sustained Buying Volume: Trading volume on Binance remains strongly positive, pointing to a continuation toward the next major resistance zones.
------------------------------------------------------------------
POTENTIAL TRADING SETUP (SPOT / SWING TRADE)
As Solana maintains a clean uptrend, taking a position on a mild pullback or around the current consolidation range offers a high-probability trade opportunity.
* Current Price: $120.00
* Strategic Entry Zone: $116.00 – $119.00
(Ideal entry on immediate momentum or a soft retest of the hourly support lines)
* Take-Profit Target 1: $128.00 (Immediate horizontal resistance)
* Take-Profit Target 2: $135.00 (Major swing high liquidity sweep)
* Strict Stop-Loss: $111.00
(Invalidation level placed securely below the recent swing bottom of $112.50)
------------------------------------------------------------------
Risk Disclaimer: Crypto trading involves high market volatility and financial risk. This analysis is for educational and tracking purposes only. Ensure proper capital allocation and risk management before executing orders.
#solana #SolanaStrong #SolanaUSTD
51

·
--
Solana ($SOL ) is trading around $120–$121 today, with short-term momentum improving after a move from roughly $120 toward $123.
Fundamentally, $SOL has several active catalysts, including the Alpenglow upgrade targeting ~150ms finality and continued institutional/ETF activity.
#SolanaStrong #sol板块 #NFPWatch #Crypto_Jobs🎯
Solana ($SOL ) is trading around $120–$121 today, with short-term momentum improving after a move from roughly $120 toward $123.
Fundamentally, $SOL has several active catalysts, including the Alpenglow upgrade targeting ~150ms finality and continued institutional/ETF activity.
#SolanaStrong #sol板块 #NFPWatch #Crypto_Jobs🎯
Fundamentally, $SOL has several active catalysts, including the Alpenglow upgrade targeting ~150ms finality and continued institutional/ETF activity.
#SolanaStrong #sol板块 #NFPWatch #Crypto_Jobs🎯
58

·
--
උසබ තත්ත්වය
$SOL IS KNOCKING ON THE DOOR OF $124.
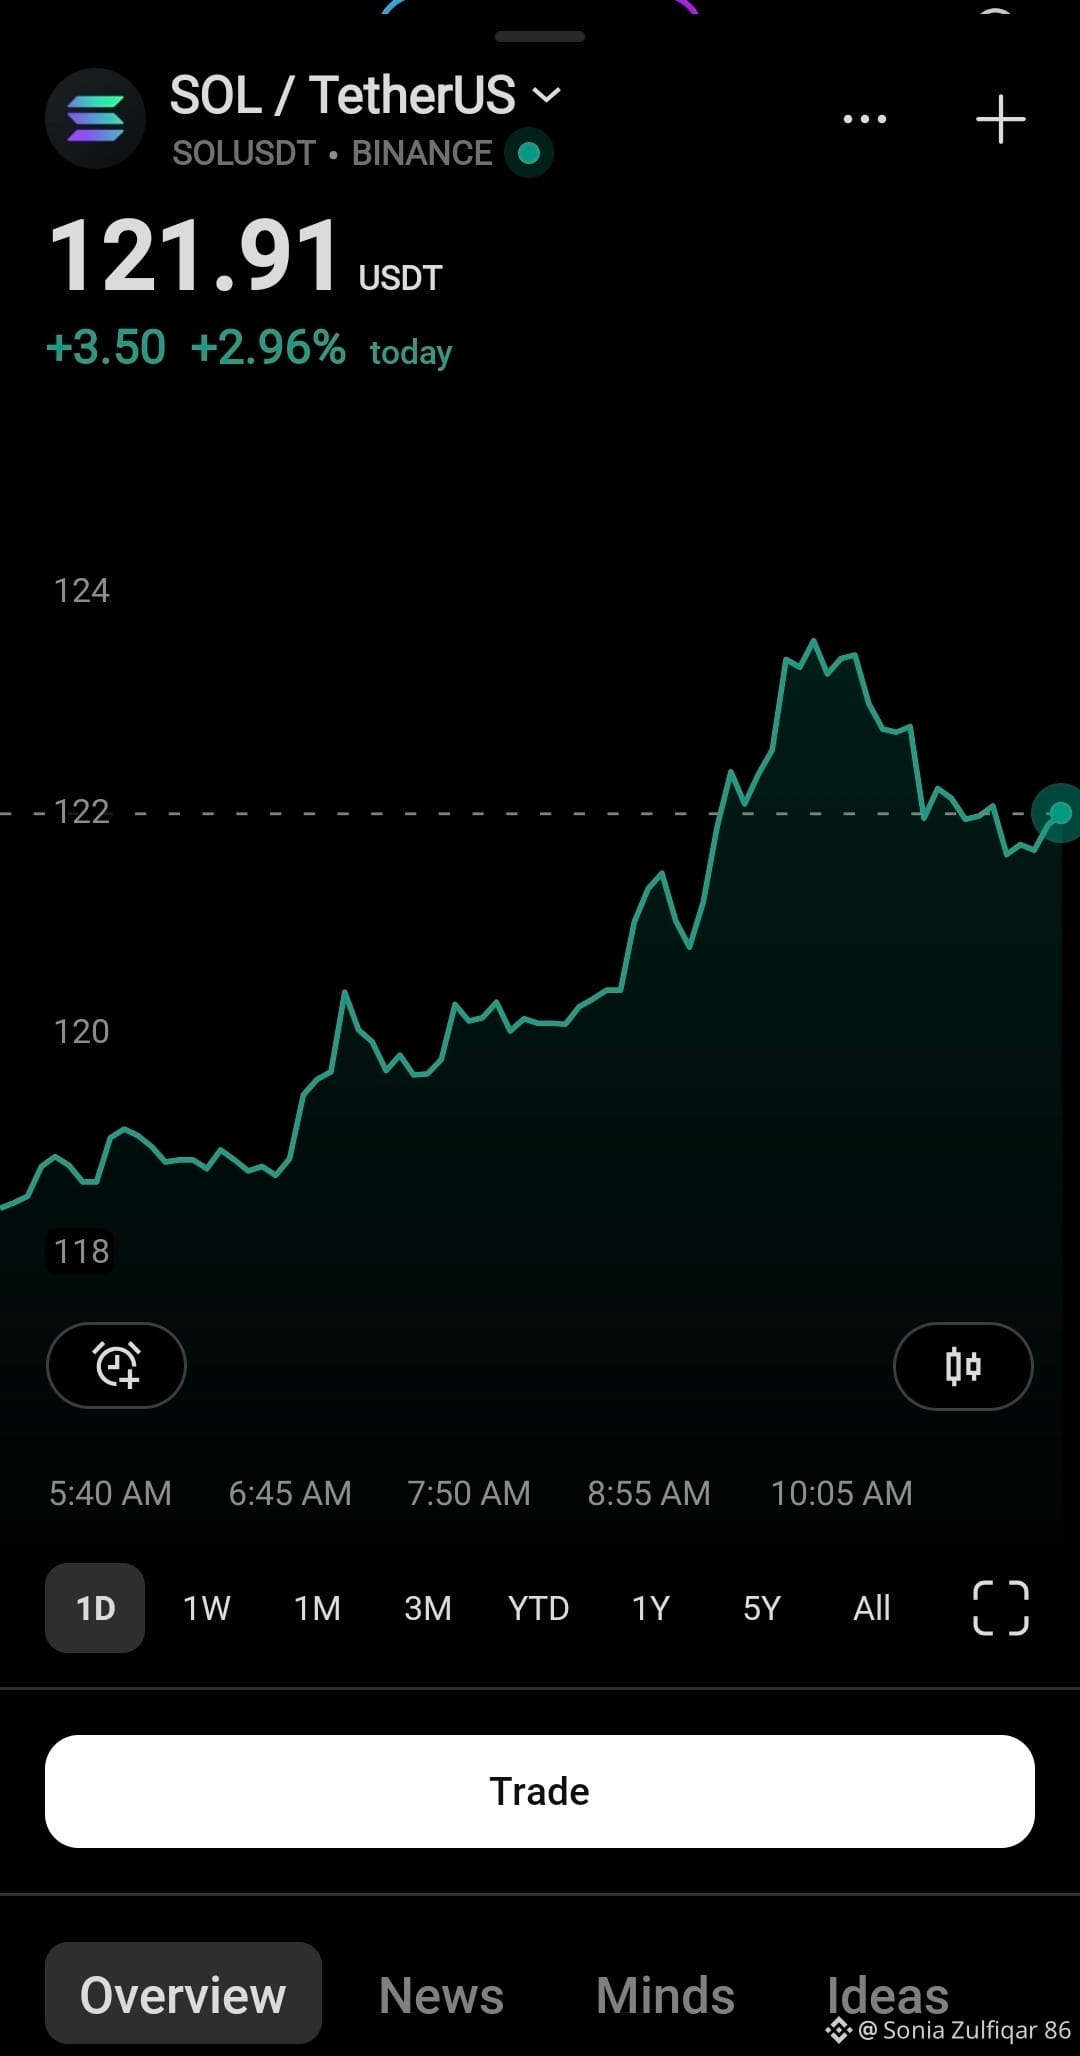
$SOL just pushed to $121.90, up ~3% today, and the momentum is getting interesting.
The level I’m watching now 👇
🎯 $123–$124 → breakout zone
🚀 Hold above $124 → $125+ comes into focus
🛡️ $120–$121 → key support
I’m not chasing here. I want to see how SOL reacts around $124. A clean breakout could change the setup quickly.
SOL holders: breakout or rejection at $124? 👀👇
#SolanaStrong #SolanaUSTD
{spot}(SOLUSDT)
$SOL IS KNOCKING ON THE DOOR OF $124.
$SOL just pushed to $121.90, up ~3% today, and the momentum is getting interesting.
The level I’m watching now 👇
🎯 $123–$124 → breakout zone
🚀 Hold above $124 → $125+ comes into focus
🛡️ $120–$121 → key support
I’m not chasing here. I want to see how SOL reacts around $124. A clean breakout could change the setup quickly.
SOL holders: breakout or rejection at $124? 👀👇
#SolanaStrong #SolanaUSTD
$SOL just pushed to $121.90, up ~3% today, and the momentum is getting interesting.
The level I’m watching now 👇
🎯 $123–$124 → breakout zone
🚀 Hold above $124 → $125+ comes into focus
🛡️ $120–$121 → key support
I’m not chasing here. I want to see how SOL reacts around $124. A clean breakout could change the setup quickly.
SOL holders: breakout or rejection at $124? 👀👇
#SolanaStrong #SolanaUSTD
1
74
·
--
උසබ තත්ත්වය
$SOL
⚡ Alpenglow upgrade: Solana is testing an upgrade that could reduce finality from ~13 seconds to about 150 ms.
🚀 Network getting faster: Slot target has been reduced from 400ms → 250ms.
💵 ETF demand: U.S. spot SOL ETFs had accumulated about $1.61B in net inflows by Sept. 29.
🏦 Real-world adoption: Solana recently launched Open USD, with more than $1B committed to liquidity.
📈 Tokenized assets: Solana is expanding into tokenized stocks, funds and institutional finance.
Main things to watch: 🔥 Alpenglow + ETF flows + stablecoin/payments growth.#SolanaUSTD #SolanaStrong
{spot}(SOLUSDT)
$SOL
⚡ Alpenglow upgrade: Solana is testing an upgrade that could reduce finality from ~13 seconds to about 150 ms.
🚀 Network getting faster: Slot target has been reduced from 400ms → 250ms.
💵 ETF demand: U.S. spot SOL ETFs had accumulated about $1.61B in net inflows by Sept. 29.
🏦 Real-world adoption: Solana recently launched Open USD, with more than $1B committed to liquidity.
📈 Tokenized assets: Solana is expanding into tokenized stocks, funds and institutional finance.
Main things to watch: 🔥 Alpenglow + ETF flows + stablecoin/payments growth.#SolanaUSTD #SolanaStrong
⚡ Alpenglow upgrade: Solana is testing an upgrade that could reduce finality from ~13 seconds to about 150 ms.
🚀 Network getting faster: Slot target has been reduced from 400ms → 250ms.
💵 ETF demand: U.S. spot SOL ETFs had accumulated about $1.61B in net inflows by Sept. 29.
🏦 Real-world adoption: Solana recently launched Open USD, with more than $1B committed to liquidity.
📈 Tokenized assets: Solana is expanding into tokenized stocks, funds and institutional finance.
Main things to watch: 🔥 Alpenglow + ETF flows + stablecoin/payments growth.#SolanaUSTD #SolanaStrong
74

අර්ධ වශයෙන් සත්යයි
#SolanaStrong
Solana ($SOL ) climbing to $122 represents a crucial bullish pivot, as it has successfully broken out above the heavy $120 macro resistance necklines. The asset is breaking its local downtrend of lower highs and shifting from a neutral consolidation phase into an active breakout configuration.
Technical Breakdown: Reclaiming the Drivers Seat
The Breakout Signal: Trading firmly at $122 confirms that bulls have absorbed the localized exchange distribution and retail profit-taking. This breakout clears the path toward the local peak at $124.95, above which the primary targets shift directly to $130 to $135.
New Support Benchmarks:
The previous rigid resistance at $119.60–$120 has now flipped into the primary immediate demand zone. Beneath that, strong moving average structures (including the 200-day SMA at $118.48) serve as secondary structural floors.
RSI and Momentum Expansion: With the price pushing past $120, the daily RSI is tilting upwards out of its neutral bound. This trajectory implies that the upward drive has verified volume backing and room to run before entering technically overbought territory.
Fundamental Alignment
This push to $122 coincides with highly supportive on-chain conditions. The combination of $188 million in weekly spot ETF inflows, a record-high $17.3 billion stablecoin pool, and accelerating momentum for the upcoming Alpenglow upgrade (slashing slot/confirmation times toward 150–200ms) is providing the fundamental tailwinds to sustain these higher price brackets.
Summary Strategy Outlook
The flip of $120 to support turns the short-term bias decisively bullish. If you are looking to trade or adjust your spot bags from here, how you proceed depends on your timeframe.
$SOL
$BTC
#SolanaStrong
Solana ($SOL ) climbing to $122 represents a crucial bullish pivot, as it has successfully broken out above the heavy $120 macro resistance necklines. The asset is breaking its local downtrend of lower highs and shifting from a neutral consolidation phase into an active breakout configuration.
Technical Breakdown: Reclaiming the Drivers Seat
The Breakout Signal: Trading firmly at $122 confirms that bulls have absorbed the localized exchange distribution and retail profit-taking. This breakout clears the path toward the local peak at $124.95, above which the primary targets shift directly to $130 to $135.
New Support Benchmarks:
The previous rigid resistance at $119.60–$120 has now flipped into the primary immediate demand zone. Beneath that, strong moving average structures (including the 200-day SMA at $118.48) serve as secondary structural floors.
RSI and Momentum Expansion: With the price pushing past $120, the daily RSI is tilting upwards out of its neutral bound. This trajectory implies that the upward drive has verified volume backing and room to run before entering technically overbought territory.
Fundamental Alignment
This push to $122 coincides with highly supportive on-chain conditions. The combination of $188 million in weekly spot ETF inflows, a record-high $17.3 billion stablecoin pool, and accelerating momentum for the upcoming Alpenglow upgrade (slashing slot/confirmation times toward 150–200ms) is providing the fundamental tailwinds to sustain these higher price brackets.
Summary Strategy Outlook
The flip of $120 to support turns the short-term bias decisively bullish. If you are looking to trade or adjust your spot bags from here, how you proceed depends on your timeframe.
$SOL
$BTC
Solana ($SOL ) climbing to $122 represents a crucial bullish pivot, as it has successfully broken out above the heavy $120 macro resistance necklines. The asset is breaking its local downtrend of lower highs and shifting from a neutral consolidation phase into an active breakout configuration.
Technical Breakdown: Reclaiming the Drivers Seat
The Breakout Signal: Trading firmly at $122 confirms that bulls have absorbed the localized exchange distribution and retail profit-taking. This breakout clears the path toward the local peak at $124.95, above which the primary targets shift directly to $130 to $135.
New Support Benchmarks:
The previous rigid resistance at $119.60–$120 has now flipped into the primary immediate demand zone. Beneath that, strong moving average structures (including the 200-day SMA at $118.48) serve as secondary structural floors.
RSI and Momentum Expansion: With the price pushing past $120, the daily RSI is tilting upwards out of its neutral bound. This trajectory implies that the upward drive has verified volume backing and room to run before entering technically overbought territory.
Fundamental Alignment
This push to $122 coincides with highly supportive on-chain conditions. The combination of $188 million in weekly spot ETF inflows, a record-high $17.3 billion stablecoin pool, and accelerating momentum for the upcoming Alpenglow upgrade (slashing slot/confirmation times toward 150–200ms) is providing the fundamental tailwinds to sustain these higher price brackets.
Summary Strategy Outlook
The flip of $120 to support turns the short-term bias decisively bullish. If you are looking to trade or adjust your spot bags from here, how you proceed depends on your timeframe.
$SOL
$BTC
116
තවත් අන්තර්ගතයන් ගවේෂණය කිරීමට ඇතුල් වන්න
Binance චතුරශ්රය හි ගෝලීය ක්රිප්ටෝ පරිශීලකයින් හා එක්වන්න
⚡️ ක්රිප්ටෝ පිළිබඳ නවතම සහ ප්රයෝජනවත් තොරතුරු ලබා ගන්න.
💬 ලොව විශාලතම ක්රිප්ටෝ හුවමාරුව මගින් විශ්වාස කෙරේ.
👍 සත්යායනය කරන ලද නිර්මාණකරුවන්ගෙන් සැබෑ විදසුන් සොයා ගන්න.
විද්යුත් තැපෑල / දුරකථන අංකය
නැගී එන මාතෘකා
1
#BNBSurpasses$790
10,808 views
88 සාකච්ඡා කරමින්
2
#ZamaRises15.99%ToIntradayHigh$0.09
5,444 views
74 සාකච්ඡා කරමින්
3
#BitcoinSpotETFsDraw$6.34BInflowsInQ3
3,728 views
60 සාකච්ඡා කරමින්
4
#EthereumValidatorExitQueueJumps392%
57,493 views
707 සාකච්ඡා කරමින්
5
#IMFApprovesElSalvador$138MWithBitcoinWaiver
7,668 views
43 සාකච්ඡා කරමින්
6
#SECHaltsCryptoETFReviewsAmidFundingLapse
211,010 views
1,606 සාකච්ඡා කරමින්
7
#ZcashETFPostsFirstWeeklyOutflow$93.6M
89,340 views
246 සාකච්ඡා කරමින්
8
#GreekPoliceBustCryptoScamRingArrest17
339,756 views
2,271 සාකච්ඡා කරමින්
9
#BitcoinRejectedAt$87K
206,735 views
305 සාකච්ඡා කරමින්
10
#FedOctoberRateHikeOddsFallTo17%
337,610 views
2,388 සාකච්ඡා කරමින්