

#cryptoanalysis"
cryptoanalysis"
1.5M නැරඹීම්
4,555 සාකච්ඡා කරමින්
උණුසුම්
නවතම

·
--
📊 $DODO : Is the Momentum Building Up?
$DODO is showing signs of a recovery, but can buyers keep it going? 👀
💰 Price: ~$0.02348 (≈ ₹2.05)
🟢 24h Change: +6.6%
📈 24h Volume: ~$12.45 million
🏦 Market Cap: ~$23.48 million
📊 24h High / Low: $0.02400 / $0.02196
Market data: CoinMarketCap snapshot, October 26, 2026. Prices can change rapidly.
🔍 What I'm Watching
DODO is moving upward, but the next move matters more than today's green candle.
🐂 Bullish: A sustained move above $0.0240 with strong buying volume could support further upside.
🐻 Bearish: A drop below $0.0220 could signal weakening momentum.
💭 My Take: I'm interested, but I'm not calling it a confirmed reversal yet. Let's see whether buyers can hold their ground.
What do you think—is $DODO ready for another move, or will sellers take control? 👇
📈 Live chart: [DODO on CoinMarketCap](https://coinmarketcap.com/currencies/dodo/?utm_source=chatgpt.com)
{spot}(DODOUSDT)
#DODO #cryptouniverseofficial #altcoins #DeFi #CryptoAnalysis" #BinanceSquareFamily #priceaction
📊 $DODO : Is the Momentum Building Up?
$DODO is showing signs of a recovery, but can buyers keep it going? 👀
💰 Price: ~$0.02348 (≈ ₹2.05)
🟢 24h Change: +6.6%
📈 24h Volume: ~$12.45 million
🏦 Market Cap: ~$23.48 million
📊 24h High / Low: $0.02400 / $0.02196
Market data: CoinMarketCap snapshot, October 26, 2026. Prices can change rapidly.
🔍 What I'm Watching
DODO is moving upward, but the next move matters more than today's green candle.
🐂 Bullish: A sustained move above $0.0240 with strong buying volume could support further upside.
🐻 Bearish: A drop below $0.0220 could signal weakening momentum.
💭 My Take: I'm interested, but I'm not calling it a confirmed reversal yet. Let's see whether buyers can hold their ground.
What do you think—is $DODO ready for another move, or will sellers take control? 👇
📈 Live chart: [DODO on CoinMarketCap](https://coinmarketcap.com/currencies/dodo/?utm_source=chatgpt.com)
#DODO #cryptouniverseofficial #altcoins #DeFi #CryptoAnalysis" #BinanceSquareFamily #priceaction

169

·
--
බෙයාරිෂ්
$BTC coin has recently fallen below the $80,000 level amid market uncertainty and geopolitical tensions. Buyers are trying to stabilize the price, but selling pressure remains a concern. Traders are watching whether BTC can reclaim key resistance levels or experience another decline.
Bitcoin is at a critical point. Short-term momentum is weak, so traders should watch support levels closely before considering a trade. A recovery above resistance would strengthen the bullish case.
My suggestion: Avoid rushing into a trade; wait for confirmation of a breakout or breakdown. Cryptocurrency prices are highly volatile, and this analysis is educational, not financial advice.
{spot}(BTCUSDT)
#BTC #bitcoin #CryptoMarket #CryptoAnalysis" #EarningsSeason
$BTC coin has recently fallen below the $80,000 level amid market uncertainty and geopolitical tensions. Buyers are trying to stabilize the price, but selling pressure remains a concern. Traders are watching whether BTC can reclaim key resistance levels or experience another decline.
Bitcoin is at a critical point. Short-term momentum is weak, so traders should watch support levels closely before considering a trade. A recovery above resistance would strengthen the bullish case.
My suggestion: Avoid rushing into a trade; wait for confirmation of a breakout or breakdown. Cryptocurrency prices are highly volatile, and this analysis is educational, not financial advice.
#BTC #bitcoin #CryptoMarket #CryptoAnalysis" #EarningsSeason

54

·
--
උසබ තත්ත්වය
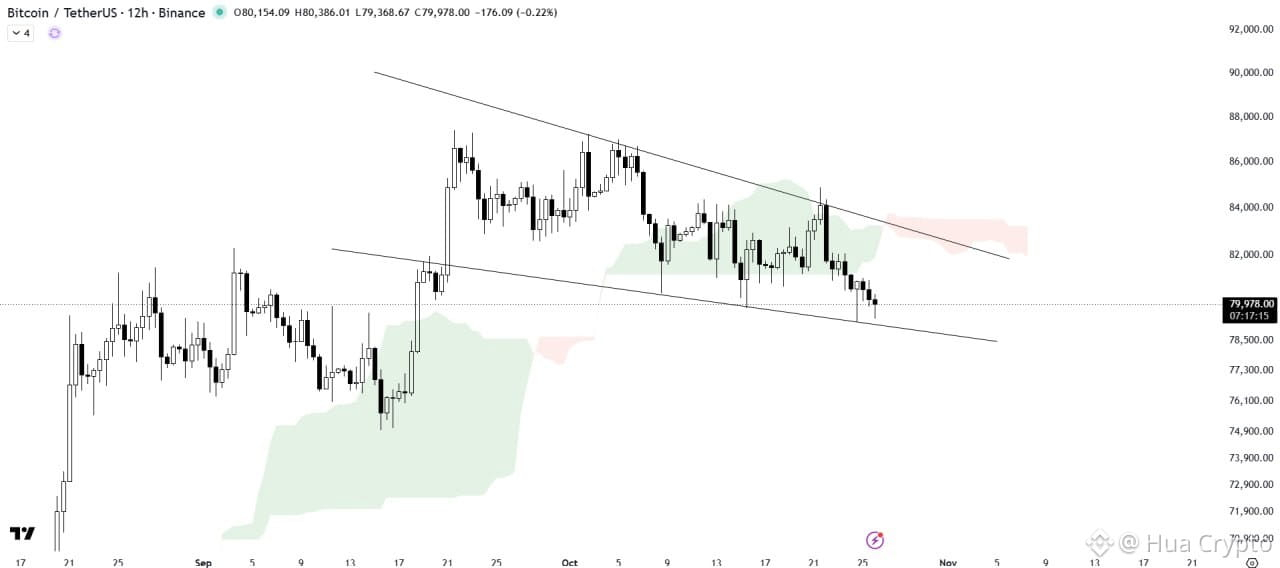
🚨 $BTC /USDT — A BIG MOVE COULD BE LOADING!
Bitcoin is compressing inside a Falling Wedge Pattern, and the battle between bulls and bears is heating up. BTC is still holding above the wedge’s support trendline, keeping a potential bullish breakout scenario alive.
📈 BULLISH SCENARIO: If BTC breaks above the wedge resistance and clears the Ichimoku Cloud, it could signal a bullish trend shift and open the door for further upside momentum.
📉 BEARISH SCENARIO: A decisive breakdown below wedge support could invalidate the pattern and expose Bitcoin to another leg down.
🎯 KEY LEVELS TO WATCH: • Ichimoku Cloud — Major resistance • Wedge Resistance — Breakout trigger • Wedge Support — Critical downside level
👀 THE NEXT MOVE MATTERS. Will Bitcoin break out to the upside or lose support?
Stay patient, watch the confirmation, and manage your risk wisely.
#BTC #Bitcoin #BTCUSDT #CryptoAnalysis" s #TechnicalAnalysis_Tickeron #CryptoMarketAlert
69

·
--
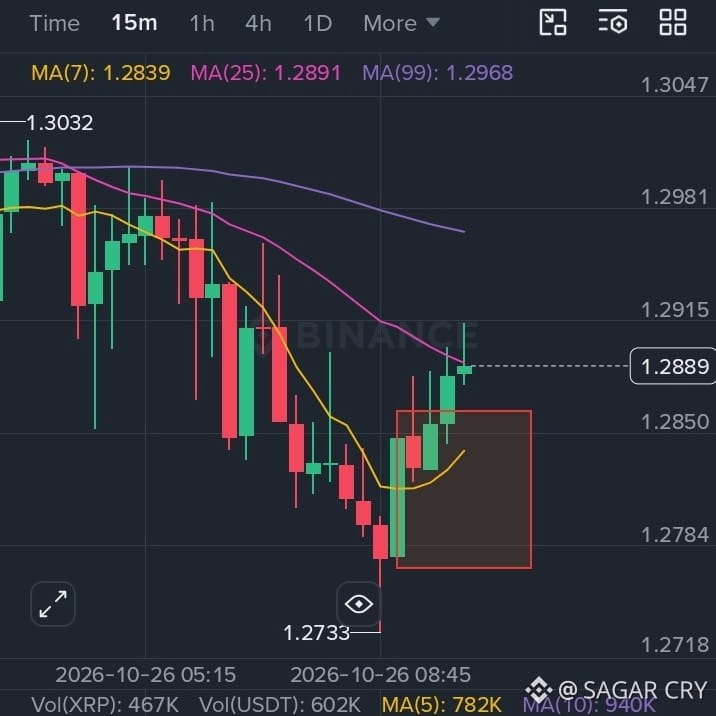
🚀 XRP/USDT Bullish Order Block Setup! 📈🔥
"Mastering Price Action on Binance Mobile! 🎯
Check out this clean live setup right from the Binance app. The market dropped, tested our marked Order Block zone precisely, and reacted with powerful bullish momentum! 📉➡️📈
Asset & Timeframe: XRP/USDT (15m Chart Setup)
Strategy: Spotting Smart Money liquidity zones directly on mobile.
Patience and precise zone-marking are the real keys to trading success. Are you guys trading this move too? Let me know in the comments! 👇
#XRP #BinanceSquare #CryptoTrading #OrderBlock #PriceAction #CryptoAnalysis" $XRP
{spot}(XRPUSDT)
🚀 XRP/USDT Bullish Order Block Setup! 📈🔥
"Mastering Price Action on Binance Mobile! 🎯
Check out this clean live setup right from the Binance app. The market dropped, tested our marked Order Block zone precisely, and reacted with powerful bullish momentum! 📉➡️📈
Asset & Timeframe: XRP/USDT (15m Chart Setup)
Strategy: Spotting Smart Money liquidity zones directly on mobile.
Patience and precise zone-marking are the real keys to trading success. Are you guys trading this move too? Let me know in the comments! 👇
#XRP #BinanceSquare #CryptoTrading #OrderBlock #PriceAction #CryptoAnalysis" $XRP
77

ලිපිය
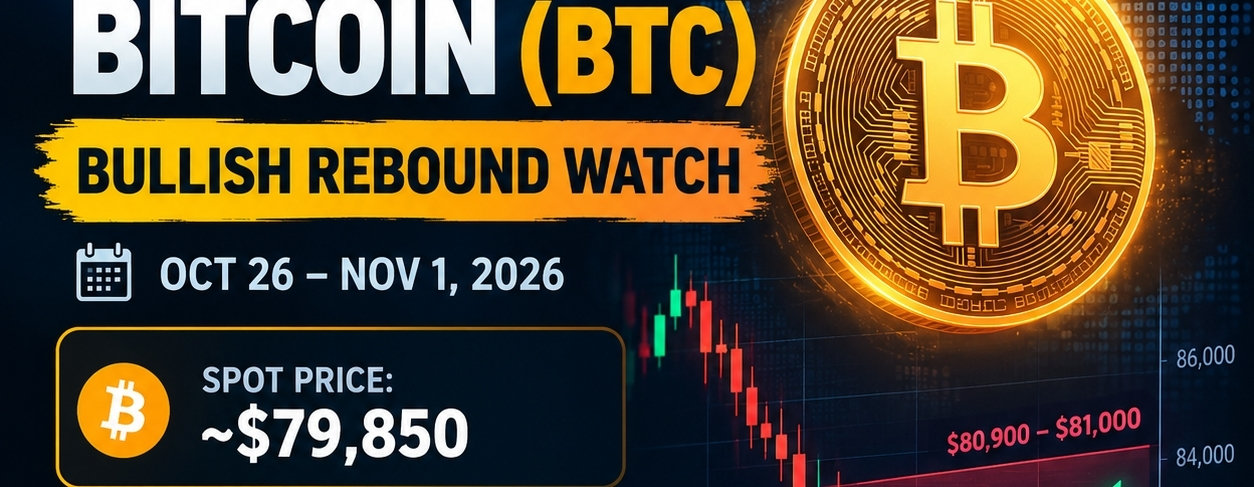
BITCOIN (BTC): WILL BTC REBOUND THIS WEEK?🚀 ₿ BITCOIN (BTC): WILL BTC REBOUND THIS WEEK? 🔥
📊 BTC Market Outlook | October 26 – November 1, 2026
Bitcoin is hovering around the $80K zone, and the next move could be crucial for the market!
💰 Current Price: Approximately $79,850
🟢 Key Support: $79,200–$80,000
🔴 Key Resistance: $80,900–$81,000
📈 MY BULLISH SCENARIO:
If BTC holds its support zone and buyers push the price above $81,000, we could see a potential recovery this week.
🔥 What I'm watching:
✅ Buyers defending the $79,200–$80,000 zone
✅ A breakout above $81,000
✅ Increasing buying volume
✅ Strong follow-through after the breakout
⚠️ BE CAREFUL: If BTC loses its support zone, the price could fall further. The bullish scenario is not confirmed yet.
🎯 My question to the BTC community:
What do you think?
🚀 BTC to $83K–$85K this week?
🐻 Or another correction below $79K?
Drop your prediction in the comments! 👇
Not financial advice. This is a market scenario, not a guaranteed predicti$XRP on. Always do your own research (DYOR).
$BTC
#Bitcoin #BTC #CryptoAnalysis" #BinanceSquareTalks #CryptoMarket $NVDAB
{spot}(BTCUSDT)
BITCOIN (BTC): WILL BTC REBOUND THIS WEEK?
🚀 ₿ BITCOIN (BTC): WILL BTC REBOUND THIS WEEK? 🔥
📊 BTC Market Outlook | October 26 – November 1, 2026
Bitcoin is hovering around the $80K zone, and the next move could be crucial for the market!
💰 Current Price: Approximately $79,850
🟢 Key Support: $79,200–$80,000
🔴 Key Resistance: $80,900–$81,000
📈 MY BULLISH SCENARIO:
If BTC holds its support zone and buyers push the price above $81,000, we could see a potential recovery this week.
🔥 What I'm watching:
✅ Buyers defending the $79,200–$80,000 zone
✅ A breakout above $81,000
✅ Increasing buying volume
✅ Strong follow-through after the breakout
⚠️ BE CAREFUL: If BTC loses its support zone, the price could fall further. The bullish scenario is not confirmed yet.
🎯 My question to the BTC community:
What do you think?
🚀 BTC to $83K–$85K this week?
🐻 Or another correction below $79K?
Drop your prediction in the comments! 👇
Not financial advice. This is a market scenario, not a guaranteed predicti$XRP on. Always do your own research (DYOR).
$BTC
#Bitcoin #BTC #CryptoAnalysis" #BinanceSquareTalks #CryptoMarket $NVDAB
81

·
--
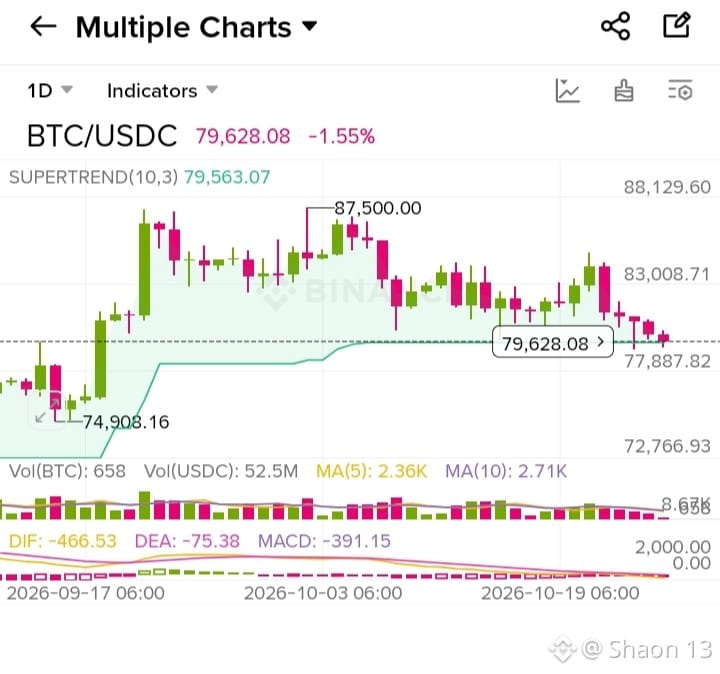
BTC/USDC Technical Analysis (1D Chart)
🔹 Current Price: $79,628.08 (-1.55%)
🔹 Trend Overview: The market is currently showing consolidation with a slight downward correction, hovering near a crucial support zone.
📊 Key Technical Indicators Breakdown:
Supertrend (10,3):
Level: $79,563.07
Analysis: Price is currently trading right around the Supertrend line, acting as an immediate psychological and technical pivot point. Holding above this level is vital for a bullish continuation.
MACD Indicator:
DIF: -466.53 | DEA: -75.38 | MACD Histogram: -391.15
Analysis: The MACD lines remain in negative territory with weak momentum, indicating that sellers are currently putting short-term pressure on the market, requiring patience before a strong reversal.
Moving Averages (MA):
MA(5): 2.36K | MA(10): 2.71K
Analysis: Volume moving averages reflect a cooling-off period following previous volatility near the local highs.
🎯 Key Levels to Watch:
Resistance: $83,008 – $87,500 (Breakout above this range could trigger a strong rally towards higher targets)
Support: $77,887 – $74,908 (Crucial demand zones to watch for potential bounce-backs)
💡 Market Sentiment: Neutral to Cautious. Keep an eye on volume changes and how the price reacts around the Supertrend support!
Disclaimer: This analysis is for educational purposes only and does not constitute financial advice. Always do your own research (DYOR) before trading.
Tags: #bitcoin #BTC #CryptoAnalysis" #BinanceSquareFamily #TechnicalAnalysise
{spot}(BTCUSDT)
$BTC $BTC
BTC/USDC Technical Analysis (1D Chart)
🔹 Current Price: $79,628.08 (-1.55%)
🔹 Trend Overview: The market is currently showing consolidation with a slight downward correction, hovering near a crucial support zone.
📊 Key Technical Indicators Breakdown:
Supertrend (10,3):
Level: $79,563.07
Analysis: Price is currently trading right around the Supertrend line, acting as an immediate psychological and technical pivot point. Holding above this level is vital for a bullish continuation.
MACD Indicator:
DIF: -466.53 | DEA: -75.38 | MACD Histogram: -391.15
Analysis: The MACD lines remain in negative territory with weak momentum, indicating that sellers are currently putting short-term pressure on the market, requiring patience before a strong reversal.
Moving Averages (MA):
MA(5): 2.36K | MA(10): 2.71K
Analysis: Volume moving averages reflect a cooling-off period following previous volatility near the local highs.
🎯 Key Levels to Watch:
Resistance: $83,008 – $87,500 (Breakout above this range could trigger a strong rally towards higher targets)
Support: $77,887 – $74,908 (Crucial demand zones to watch for potential bounce-backs)
💡 Market Sentiment: Neutral to Cautious. Keep an eye on volume changes and how the price reacts around the Supertrend support!
Disclaimer: This analysis is for educational purposes only and does not constitute financial advice. Always do your own research (DYOR) before trading.
Tags: #bitcoin #BTC #CryptoAnalysis" #BinanceSquareFamily #TechnicalAnalysise
$BTC $BTC
1
48

·
--
₿ BITCOIN 4H ANALYSIS | BTC/USDT 📊
Bitcoin is showing short-term selling pressure, and traders should watch the support zone closely.
📉 If support breaks, further downside is possible.
📈 If support holds, a bullish bounce could happen.
🎯 Wait for confirmation before entering a trade.
🔥 WHAT'S NEXT FOR BITCOIN?
🚀 BULLISH or 🔻 BEARISH?
{future}(BTCUSDT)
Comment your prediction below! 👇
#bitcoin #BinanceSquareFamily #CryptoAnalysis" #BitcoinTrading #CryptoCommunity
₿ BITCOIN 4H ANALYSIS | BTC/USDT 📊
Bitcoin is showing short-term selling pressure, and traders should watch the support zone closely.
📉 If support breaks, further downside is possible.
📈 If support holds, a bullish bounce could happen.
🎯 Wait for confirmation before entering a trade.
🔥 WHAT'S NEXT FOR BITCOIN?
🚀 BULLISH or 🔻 BEARISH?
Comment your prediction below! 👇
#bitcoin #BinanceSquareFamily #CryptoAnalysis" #BitcoinTrading #CryptoCommunity

1
176

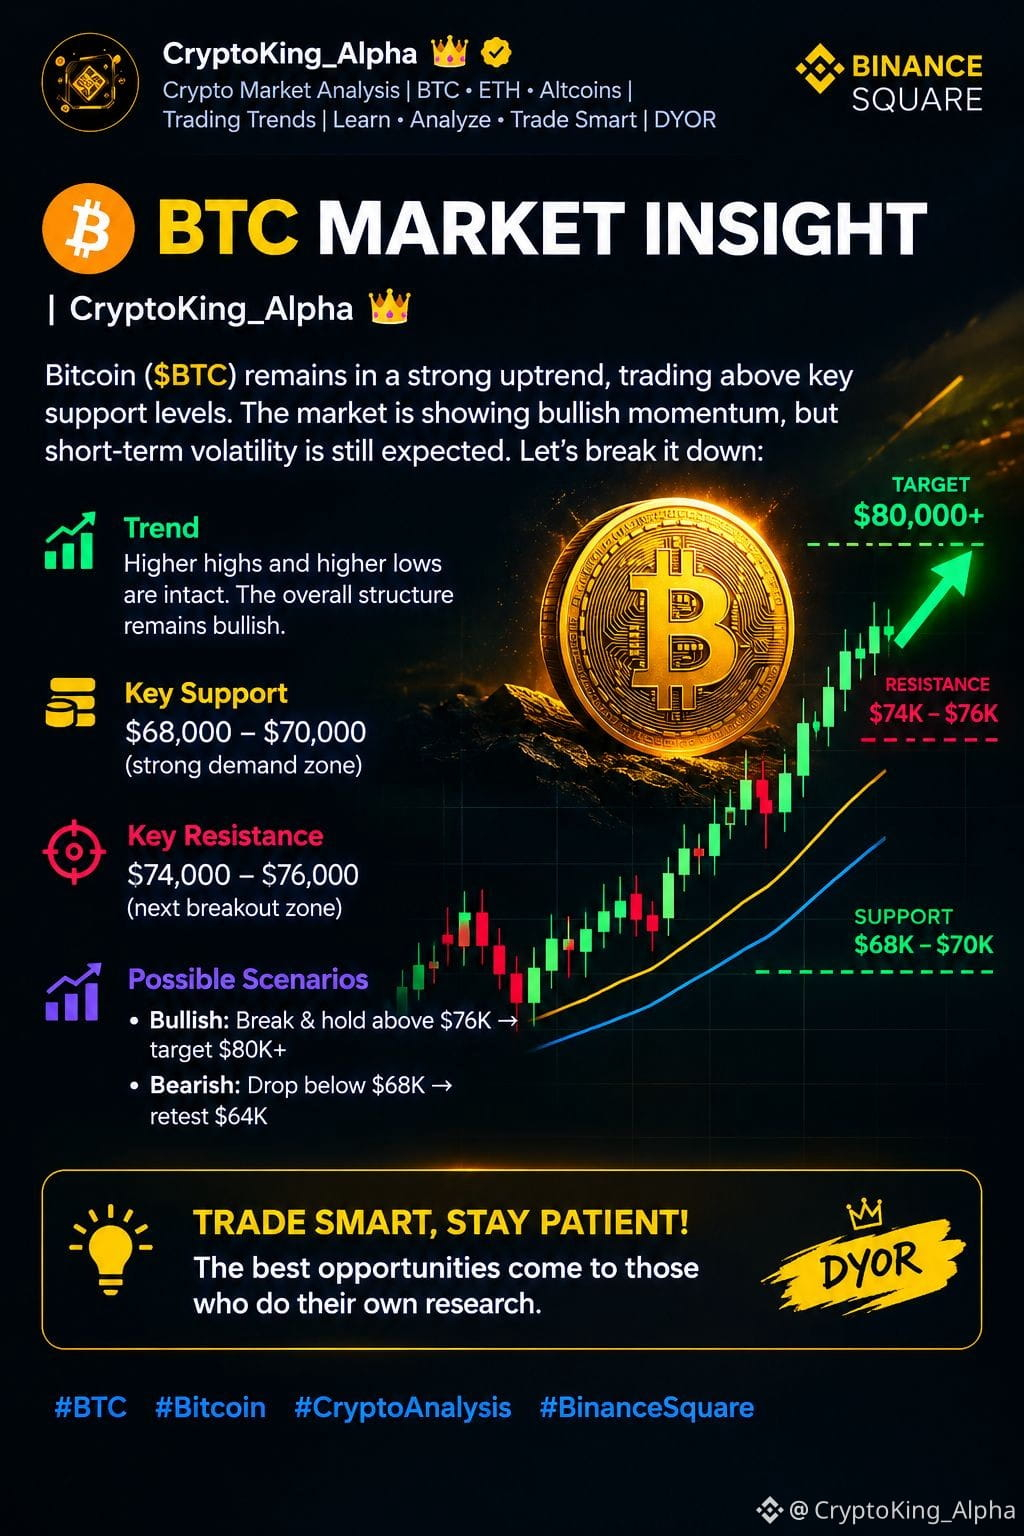
📊 BTC Market Insight | CryptoKing_Alpha 👑
Bitcoin ($BTC ) traders should watch market structure, volume, and key support and resistance levels before making a decision.
📈 Bullish scenario: A confirmed breakout with strong volume may indicate further upside.
📉 Bearish scenario: Losing key support may lead to a deeper pullback.
✅ Avoid emotional trading
✅ Use proper risk management
✅ Wait for confirmation
✅ Always do your own research (DYOR)
💬 What’s your view on BTC right now — bullish or bearish? Share your analysis below!
$BTC #BTC #bitcoin #CryptoAnalysis" #BinanceSquare
72

·
--
🚀 MONERO ($XMR ) — COIN OF THE DAY 🔥
📅 October 25, 2026
💎 Why Monero Is Getting Attention
🔹 Privacy-focused cryptocurrency 🔐
🔹 Strong market movement today 📈
🔹 Traders are watching its momentum 👀
🔹 A key coin to watch in the privacy-coin sector ⚡
💭 My View: If bullish momentum continues, $XMR could attract more attention. But confirmation from price action and trading volume is important.
🔥 Is Monero ready for another move up?
💬 Share your thoughts below!
#Monero #XMR #Crypto #Binance #CryptoAnalysis"

123

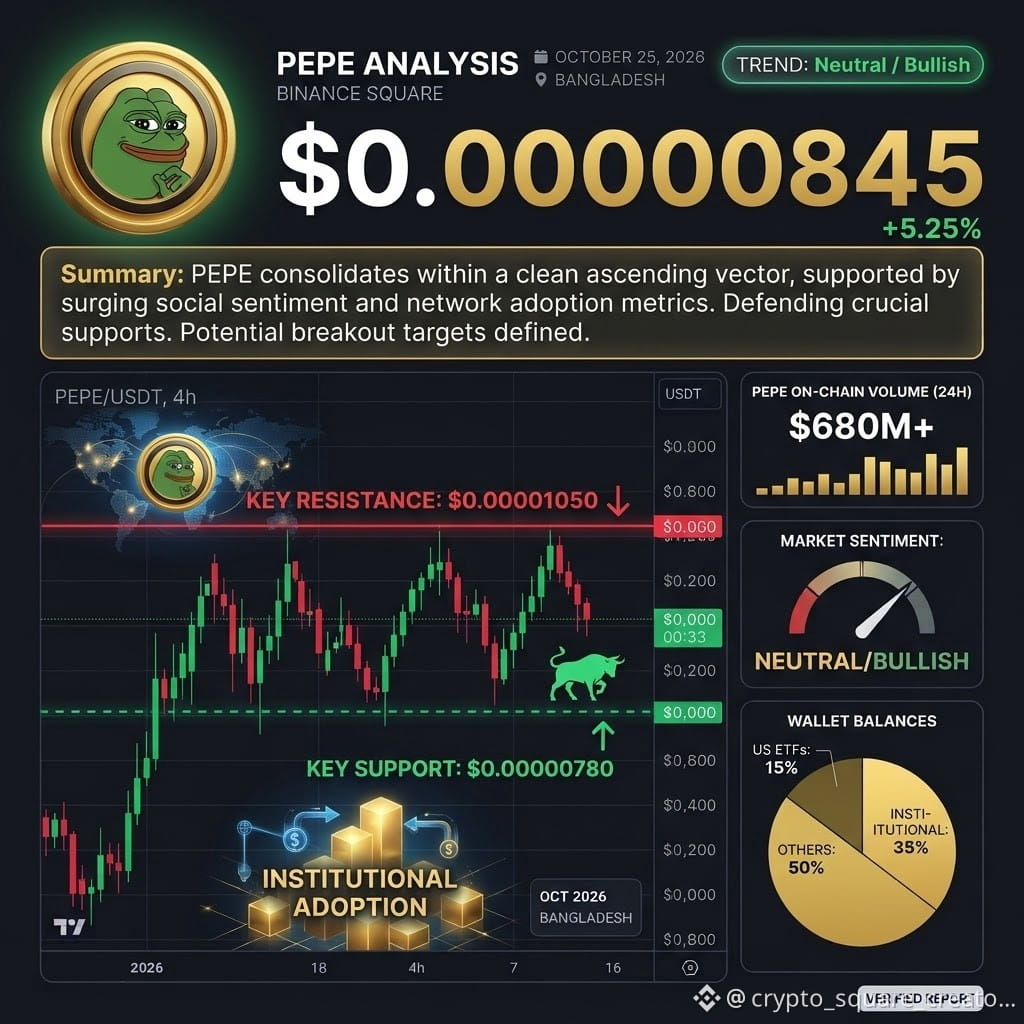
$PEPE 🐸 PEPE HOLDS RANGE: Social Momentum Drives Consolidation!
Pepe ($PEPE) is currently trading at a verified price of $0.00000442, exhibiting a NEUTRAL / BULLISH market structure.
Key Support: $0.00000410
Key Resistance: $0.00000480
Why It Moves: $PEPE is consolidating within a tight accumulation range. Sustained social sentiment and steady retail trading volume are successfully defending critical lower support bases, balancing out broad market profit-taking.
Will meme coin volume spark a breakout past immediate resistance this week? Drop your targets below! 👇
#pepe #memecoin #CryptoAnalysis" #Trading #BinanceSquareTalks #ALTCOİNS
{spot}(PEPEUSDT)
#CryptoNews
Not financial advice.@pepecoineth
$PEPE 🐸 PEPE HOLDS RANGE: Social Momentum Drives Consolidation!
Pepe ($PEPE ) is currently trading at a verified price of $0.00000442, exhibiting a NEUTRAL / BULLISH market structure.
Key Support: $0.00000410
Key Resistance: $0.00000480
Why It Moves: $PEPE is consolidating within a tight accumulation range. Sustained social sentiment and steady retail trading volume are successfully defending critical lower support bases, balancing out broad market profit-taking.
Will meme coin volume spark a breakout past immediate resistance this week? Drop your targets below! 👇
#pepe #memecoin #CryptoAnalysis" #Trading #BinanceSquareTalks #ALTCOİNS
#CryptoNews
Not financial advice.@Pepecoin
29
·
--
$SECZB 📊 Is SECZB (Securitize) The RWA Powerhouse Driving TradFi On-Chain? 🚀
Real-World Asset (RWA) tokenization is moving from hype to institutional reality, and Securitize ($SECZB) stands right at the epicenter of this financial shift. Backed by Wall Street heavyweights like BlackRock, Apollo, and Hamilton Lane, Securitize is setting the standard for tokenized stocks, yield-bearing funds, and fixed income.
🔍 Realistic Market Analysis & Key Drivers
🏦 Institutional Backing & Regulatory Advantage
Unlike unregulated wrapper projects, Securitize operates as a U.S.-licensed broker-dealer and transfer agent. Issuing BlackRock’s BUIDLfundandbridgingtraditionalequitieson−chaingivesSECZB a regulatory moat that few RWA protocols can match.
📈 Multi-Chain Expansion & Tokenized Equities
With expanding deployments across Ethereum, Solana, Avalanche, and BNB Chain, Securitize allows 24/7 fractional stock ownership backed 1:1 by real shares. As volume builds across DEXs and permissioned pools, on-chain fee generation grows.
⚠️ Realistic Risks to Watch
Low Circulating Liquidity: Price swings can be volatile due to fragmented liquidity pools across DEXs.
Regulatory Dependencies: Any tightening in cross-border securities regulations or secondary market trading limits can slow down retail adoption.
🎯 Key Trading Levels & Sentiment
Structural Setup: RWA tokens often experience sharp accumulation phases ahead of major institutional announcements or ETF listings.
Strategy: Look for consolidation zone entries during market-wide dips rather than buying parabolic pumps. Always practice risk management with tight stop-losses.
What’s your take on RWA tokenization? Will TradFi completely shift on-chain this cycle? Let’s discuss below! 👇
#SECZB #RWA #CryptoAnalysis" #BİNANCESQUARE
{spot}(SECZBUSDT)
$SECZB 📊 Is SECZB (Securitize) The RWA Powerhouse Driving TradFi On-Chain? 🚀
Real-World Asset (RWA) tokenization is moving from hype to institutional reality, and Securitize ($SECZB ) stands right at the epicenter of this financial shift. Backed by Wall Street heavyweights like BlackRock, Apollo, and Hamilton Lane, Securitize is setting the standard for tokenized stocks, yield-bearing funds, and fixed income.
🔍 Realistic Market Analysis & Key Drivers
🏦 Institutional Backing & Regulatory Advantage
Unlike unregulated wrapper projects, Securitize operates as a U.S.-licensed broker-dealer and transfer agent. Issuing BlackRock’s BUIDLfundandbridgingtraditionalequitieson−chaingivesSECZB a regulatory moat that few RWA protocols can match.
📈 Multi-Chain Expansion & Tokenized Equities
With expanding deployments across Ethereum, Solana, Avalanche, and BNB Chain, Securitize allows 24/7 fractional stock ownership backed 1:1 by real shares. As volume builds across DEXs and permissioned pools, on-chain fee generation grows.
⚠️ Realistic Risks to Watch
Low Circulating Liquidity: Price swings can be volatile due to fragmented liquidity pools across DEXs.
Regulatory Dependencies: Any tightening in cross-border securities regulations or secondary market trading limits can slow down retail adoption.
🎯 Key Trading Levels & Sentiment
Structural Setup: RWA tokens often experience sharp accumulation phases ahead of major institutional announcements or ETF listings.
Strategy: Look for consolidation zone entries during market-wide dips rather than buying parabolic pumps. Always practice risk management with tight stop-losses.
What’s your take on RWA tokenization? Will TradFi completely shift on-chain this cycle? Let’s discuss below! 👇
#SECZB #RWA #CryptoAnalysis" #BİNANCESQUARE

103

·
--
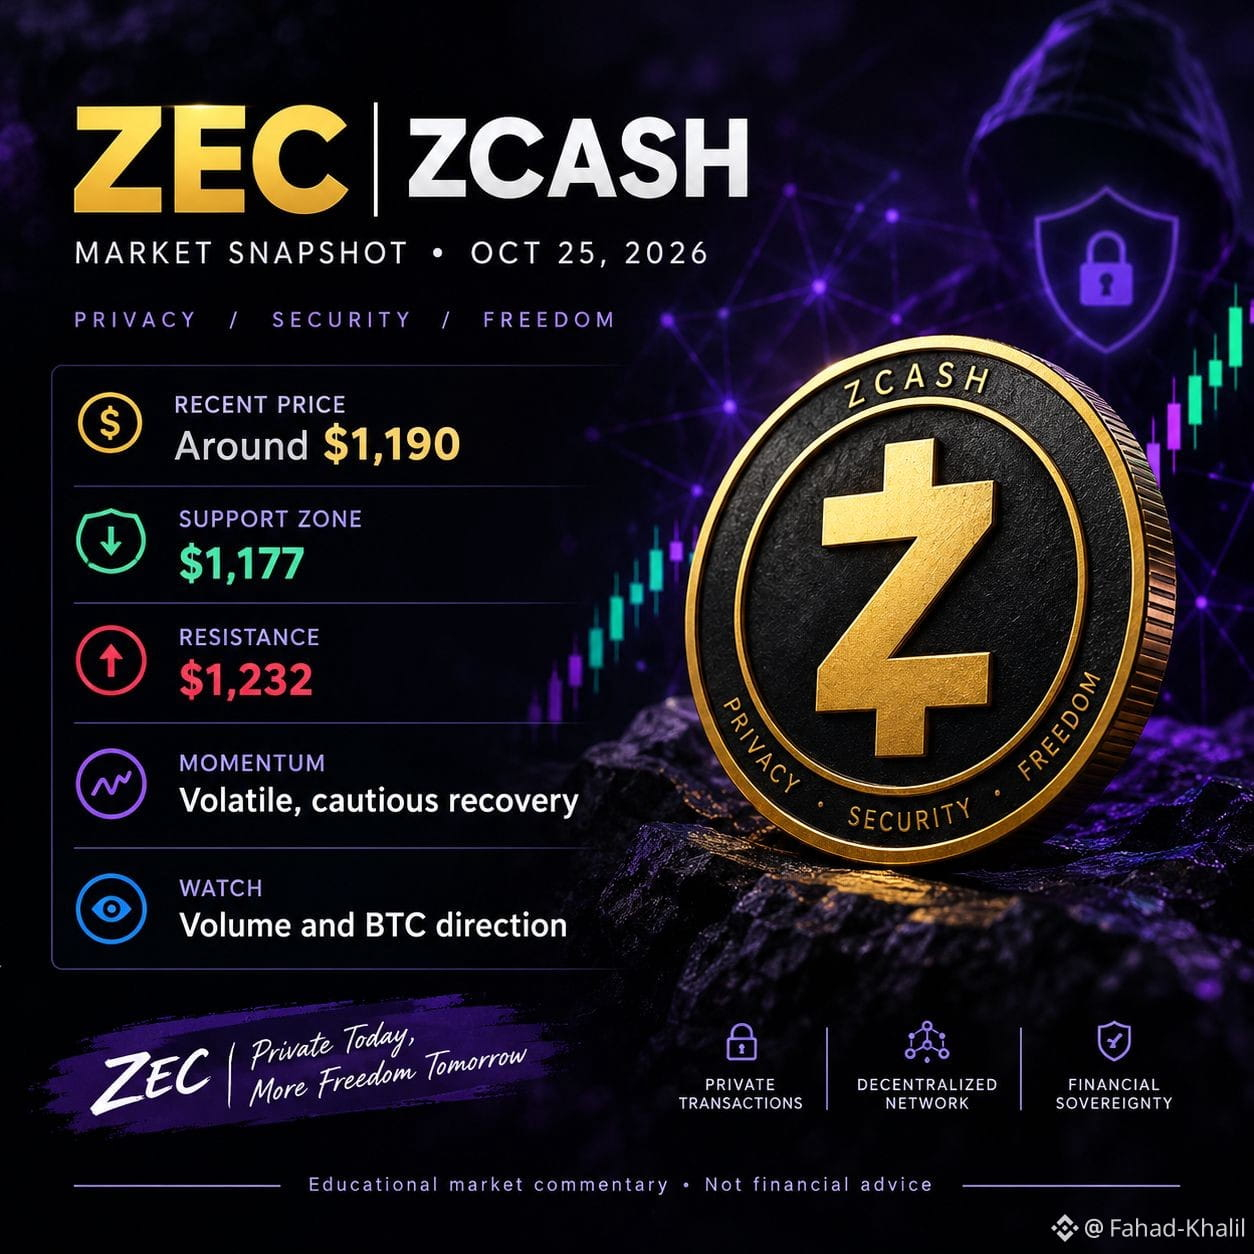
📊 $ZEC (#zcash ) — Latest Market Analysis
$ZEC is showing signs of recovery, but volatility remains high.
💰 Price: Around $1,190
🟢 Support: $1,177
🔴 Resistance: $1,232
📈 A breakout above $1,232 could support further upside, while a drop below $1,177 may signal renewed weakness.
👀 Watch trading volume and Bitcoin’s direction before drawing conclusions.
#ZEC #zcash #CryptoAnalysis" #BinanceSquare
{spot}(ZECUSDT)
📊 $ZEC (#zcash ) — Latest Market Analysis
$ZEC is showing signs of recovery, but volatility remains high.
💰 Price: Around $1,190
🟢 Support: $1,177
🔴 Resistance: $1,232
📈 A breakout above $1,232 could support further upside, while a drop below $1,177 may signal renewed weakness.
👀 Watch trading volume and Bitcoin’s direction before drawing conclusions.
#ZEC #zcash #CryptoAnalysis" #BinanceSquare
157

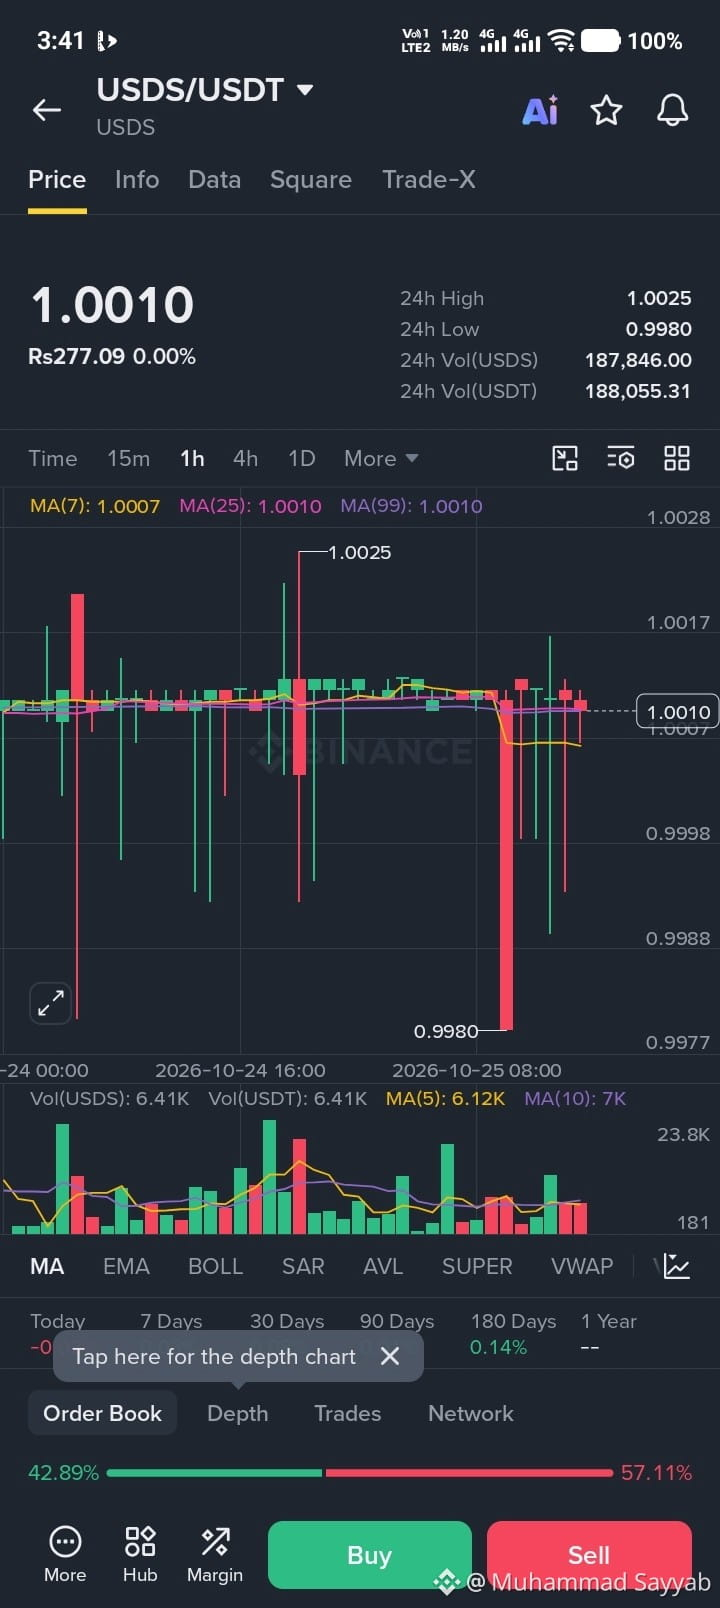
"Every candle tells a story. What is your take on this price action? Let’s discuss in the comments below! #tradingjourney #CryptoAnalysis"
"Every candle tells a story. What is your take on this price action? Let’s discuss in the comments below! #tradingjourney #CryptoAnalysis"
80
·
--
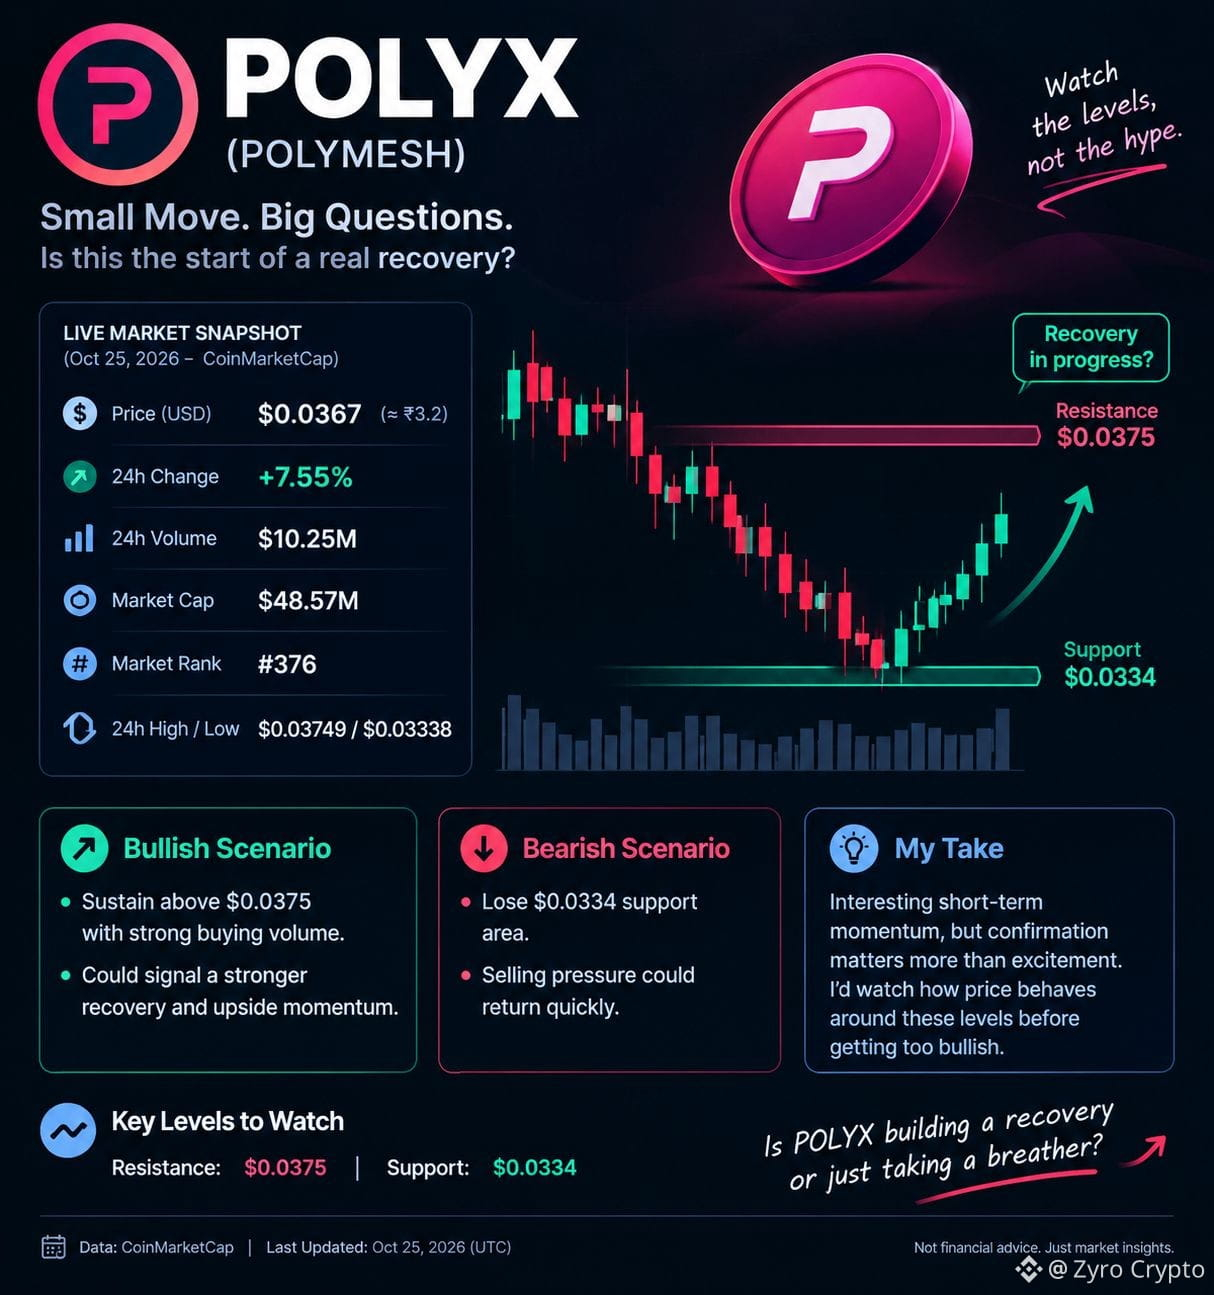
📊 $POLYX (Polymesh): Is the Momentum Finally Changing?
$POLYX is showing signs of a short-term rebound, but the real question is whether buyers can keep the momentum alive. 👀
💰 Quick Market Snapshot
Price: ~$0.0367 (approximately ₹3.2)
24h Change: +7.55%
24h Volume: ~$10.25 million
Market Cap: ~$48.57 million
Market Rank: #376
24h High / Low: $0.03749 / $0.03338
Market data: CoinMarketCap snapshot retrieved October 25, 2026. INR price is approximate; crypto prices fluctuate continuously.
🔍 What I'm Watching
$POLYX has bounced from its reported 24-hour low, which suggests buyers have stepped in. But one green move doesn't automatically mean a full trend reversal.
🟢 Bullish scenario: A sustained move above $0.0375, supported by buying volume, could strengthen the recovery.
🔴 Bearish scenario: If POLYX loses the $0.0334 area, selling pressure could return.
⚖️ My take: Interesting short-term momentum, but confirmation matters more than excitement. I'd watch how price behaves around these levels before drawing a stronger conclusion.
What do you think—is POLYX building a recovery or just taking a temporary breather? 👇
📈 Live Price Chart
Check the latest chart and price action here:
[POLYX Live Chart — CoinMarketCap](https://coinmarketcap.com/currencies/polymesh/?utm_source=chatgpt.com)
[POLYX Chart — CoinGecko](https://www.coingecko.com/en/coins/polymesh?utm_source=chatgpt.com)
🏷️ Hashtags
#POLYX
{spot}(POLYXUSDT)
#CryptoAnalysis" #altcoins #CryptoMarketMoves #priceaction #CryptoCommunity
📊 $POLYX (Polymesh): Is the Momentum Finally Changing?
$POLYX is showing signs of a short-term rebound, but the real question is whether buyers can keep the momentum alive. 👀
💰 Quick Market Snapshot
Price: ~$0.0367 (approximately ₹3.2)
24h Change: +7.55%
24h Volume: ~$10.25 million
Market Cap: ~$48.57 million
Market Rank: #376
24h High / Low: $0.03749 / $0.03338
Market data: CoinMarketCap snapshot retrieved October 25, 2026. INR price is approximate; crypto prices fluctuate continuously.
🔍 What I'm Watching
$POLYX has bounced from its reported 24-hour low, which suggests buyers have stepped in. But one green move doesn't automatically mean a full trend reversal.
🟢 Bullish scenario: A sustained move above $0.0375, supported by buying volume, could strengthen the recovery.
🔴 Bearish scenario: If POLYX loses the $0.0334 area, selling pressure could return.
⚖️ My take: Interesting short-term momentum, but confirmation matters more than excitement. I'd watch how price behaves around these levels before drawing a stronger conclusion.
What do you think—is POLYX building a recovery or just taking a temporary breather? 👇
📈 Live Price Chart
Check the latest chart and price action here:
[POLYX Live Chart — CoinMarketCap](https://coinmarketcap.com/currencies/polymesh/?utm_source=chatgpt.com)
[POLYX Chart — CoinGecko](https://www.coingecko.com/en/coins/polymesh?utm_source=chatgpt.com)
🏷️ Hashtags
#POLYX
#CryptoAnalysis" #altcoins #CryptoMarketMoves #priceaction #CryptoCommunity
120

Sure, here's the English version with hashtags, ready to post on your banners:
$ZEC
{spot}(ZECUSDT)
USDT Perp Chart Analysis (Zcash)**
- **Trading pair:** ZECUSDT Perpetual Futures (Zcash), on Binance
- **Current price:** about 1,186.64 USDT (roughly ₨328,485)
- **24h range:** High 1,225.00, Low 1,118.80
- **24h change:** +3.10%
- **1h chart:** Price fell from 1,225 to around 1,176, then recovered to about 1,186. Recent candles are small, showing market uncertainty.
- **Volume:** Higher volume came with the earlier sell-off. Volume has eased recently.
- **Performance:** Today -0.17% | 7 days +3.76% | 30 days -23.80% | 90 days +141.29% | 1 year +364.46%
**Risk note:** Perpetual futures use leverage and carry high risk. Crypto prices are very volatile, and past moves do not predict future results. Always use stop-losses and only trade what you can afford to lose.
#ZECUSDT #CryptoAnalysis" #TechnicalAnalys #RiskManagementMastery #crypto
Sure, here's the English version with hashtags, ready to post on your banners:
$ZEC
USDT Perp Chart Analysis (Zcash)**
- **Trading pair:** ZECUSDT Perpetual Futures (Zcash), on Binance
- **Current price:** about 1,186.64 USDT (roughly ₨328,485)
- **24h range:** High 1,225.00, Low 1,118.80
- **24h change:** +3.10%
- **1h chart:** Price fell from 1,225 to around 1,176, then recovered to about 1,186. Recent candles are small, showing market uncertainty.
- **Volume:** Higher volume came with the earlier sell-off. Volume has eased recently.
- **Performance:** Today -0.17% | 7 days +3.76% | 30 days -23.80% | 90 days +141.29% | 1 year +364.46%
**Risk note:** Perpetual futures use leverage and carry high risk. Crypto prices are very volatile, and past moves do not predict future results. Always use stop-losses and only trade what you can afford to lose.
#ZECUSDT #CryptoAnalysis" #TechnicalAnalys #RiskManagementMastery #crypto
222

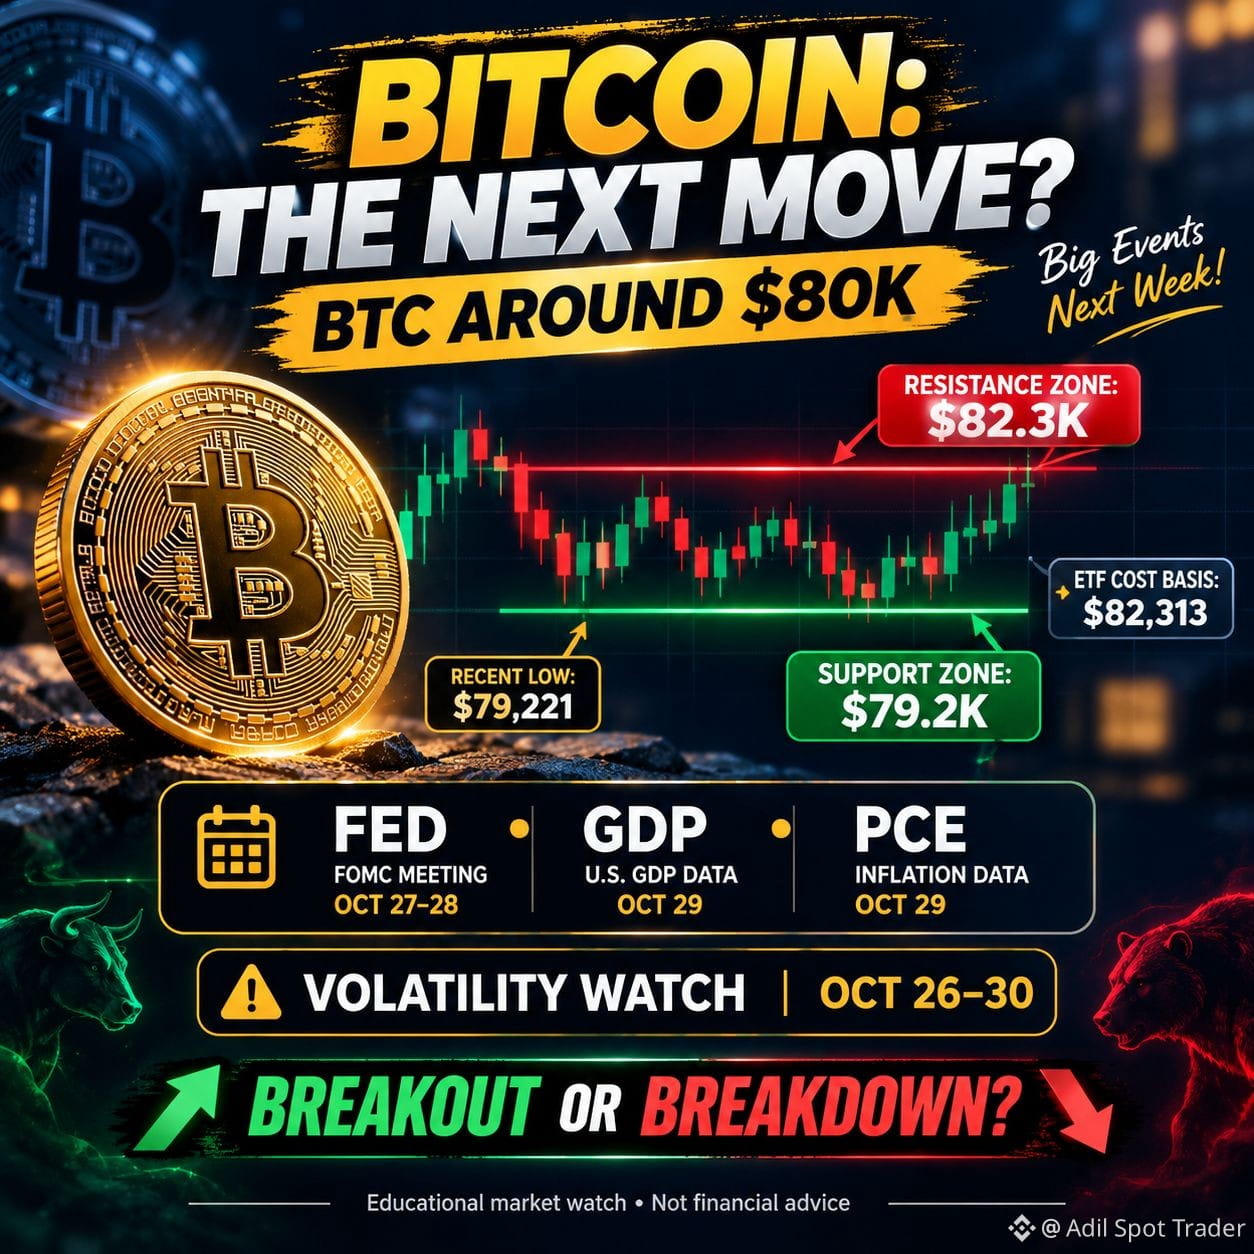
🚨 BITCOIN IS AT A CRITICAL CROSSROADS! 🐂🐻
BTC is hovering near $80K, and the next move could surprise both bulls and bears. 👀
📊 3 KEY LEVELS TO WATCH:
🟢 $79.2K — Support zone
🔴 $82.3K — Resistance zone
🎯 $85K — Potential upside target if bullish momentum returns
⚠️ Next week brings the Fed meeting, US GDP and PCE inflation data. Expect possible volatility—but never assume direction before confirmation.
🔥 THE BIG QUESTION:
Will BTC 🚀 BREAK ABOVE $82.3K or 📉 DROP BELOW $79.2K?
💬 Comment BULL 🐂 or BEAR 🐻 and tell us WHY!
🔖 Save this post and follow for more crypto market insights.
#bitcoin #BinanceSquare #BinancePicks k #CryptoAnalysis" #BTC $BTC
57
·
--
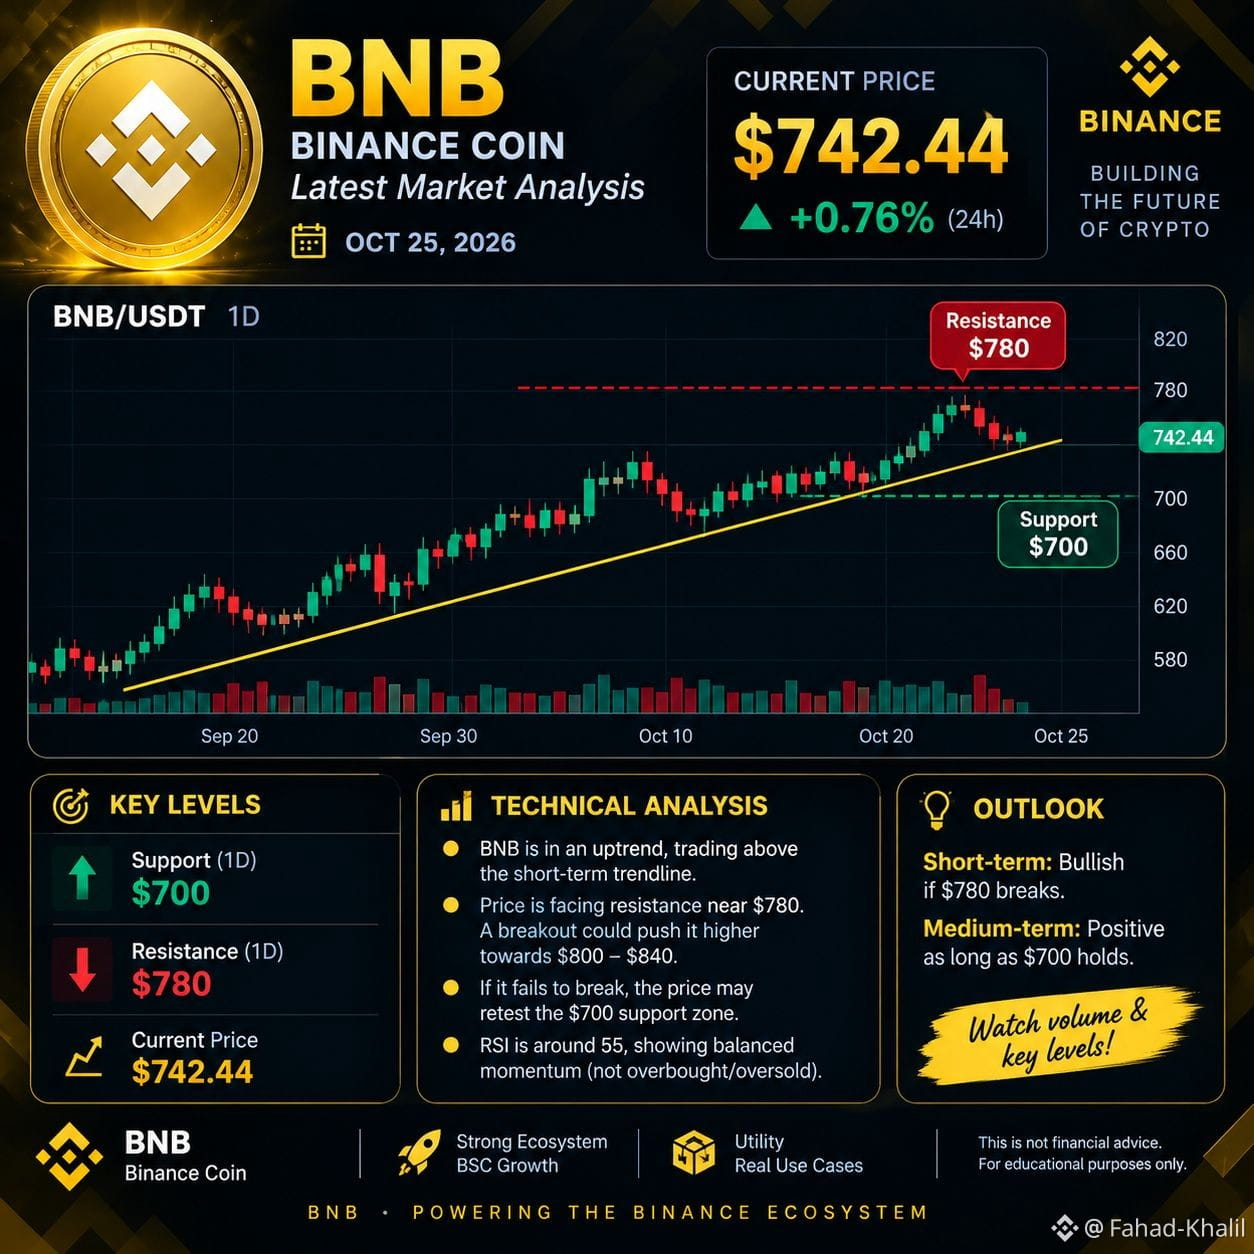
🟡 $BNB — Latest Market Analysis
📅 October 25, 2026
💰 Price: Around $744.
🟢 Support: $731
🔴 Resistance: $747–$756
📊 Technical Analysis:
BNB is showing positive momentum, but the price is facing resistance near $747. A breakout above this level with strong volume could support further upside. If the price falls below $731, downside pressure may increase.
🔎 Market Outlook: Neutral to cautiously bullish. Watch support, resistance, and trading volume for confirmation.
What do you think about BNB's next move? 👇
#BNB #CryptoAnalysis" #BinanceSquareFamily
{spot}(BNBUSDT)
🟡 $BNB — Latest Market Analysis
📅 October 25, 2026
💰 Price: Around $744.
🟢 Support: $731
🔴 Resistance: $747–$756
📊 Technical Analysis:
BNB is showing positive momentum, but the price is facing resistance near $747. A breakout above this level with strong volume could support further upside. If the price falls below $731, downside pressure may increase.
🔎 Market Outlook: Neutral to cautiously bullish. Watch support, resistance, and trading volume for confirmation.
What do you think about BNB's next move? 👇
#BNB #CryptoAnalysis" #BinanceSquareFamily
65

සත්යායනය කළ
🚨 PONS ($PONS ): AN OFFICIAL UPDATE EVERY CRYPTO INVESTOR SHOULD KNOW!
Is PONS just another token, or does its launchpad ecosystem offer something worth researching? 🔍
📌 Official Project Facts
🔹 Token: PONS
🔹 Network: Robinhood Chain
🔹 Maximum supply: 1 billion tokens
🔹 Use case: A platform for launching and trading fixed-supply tokens
🔹 Protocol model: Non-custodial — transactions are authorized through users’ own wallets.
📢 LATEST VERIFIED EXCHANGE UPDATE
On October 22, 2026, Phemex announced the PONS/USDT spot trading pair, with trading scheduled to begin at 09:00 UTC that day.
Kraken had also announced PONS trading availability beginning September 25, 2026.
📊 My Analysis
✅ The project has a defined token-launching use case.
✅ Its protocol documentation describes buybacks funded by 80% of protocol fees, with purchased PONS sent to a burn address.
⚠️ The 80% allocation is currently not immutable, according to the official documentation.
⚠️ Buybacks and token burns do not guarantee a price increase.
⚠️ Liquidity, actual platform usage and market volatility remain important risks.
🎯 Before investing, check:
• Current price and trading volume
• Liquidity and holder concentration
• Official contract address
• Actual protocol revenue and buyback activity
🔗 Official sources
🌐 Protocol documentation: https://docs.ponsfamily.com/
📈 Official launchpad: https://pons.family/launchpad
📢 Phemex listing announcement: https://phemex.com/announcements/phemex-new-spot-listing-pons-1010511792659600000
📢 Kraken listing announcement: https://blog.kraken.com/product/asset-listings/pons-is-available-for-trading
💬 Your opinion: Does PONS have the potential to grow with its launchpad ecosystem, or would you wait for stronger evidence of adoption?
Comment BULLISH 🚀 or WAIT 👀 below!
#pons #crypto #robinhoodchain #altcoins #CryptoAnalysis" #BinanceSquare #DYOR
Disclaimer: Educational content only, not financial advice. Crypto investments are risky and can result in a total loss.
552

·
--
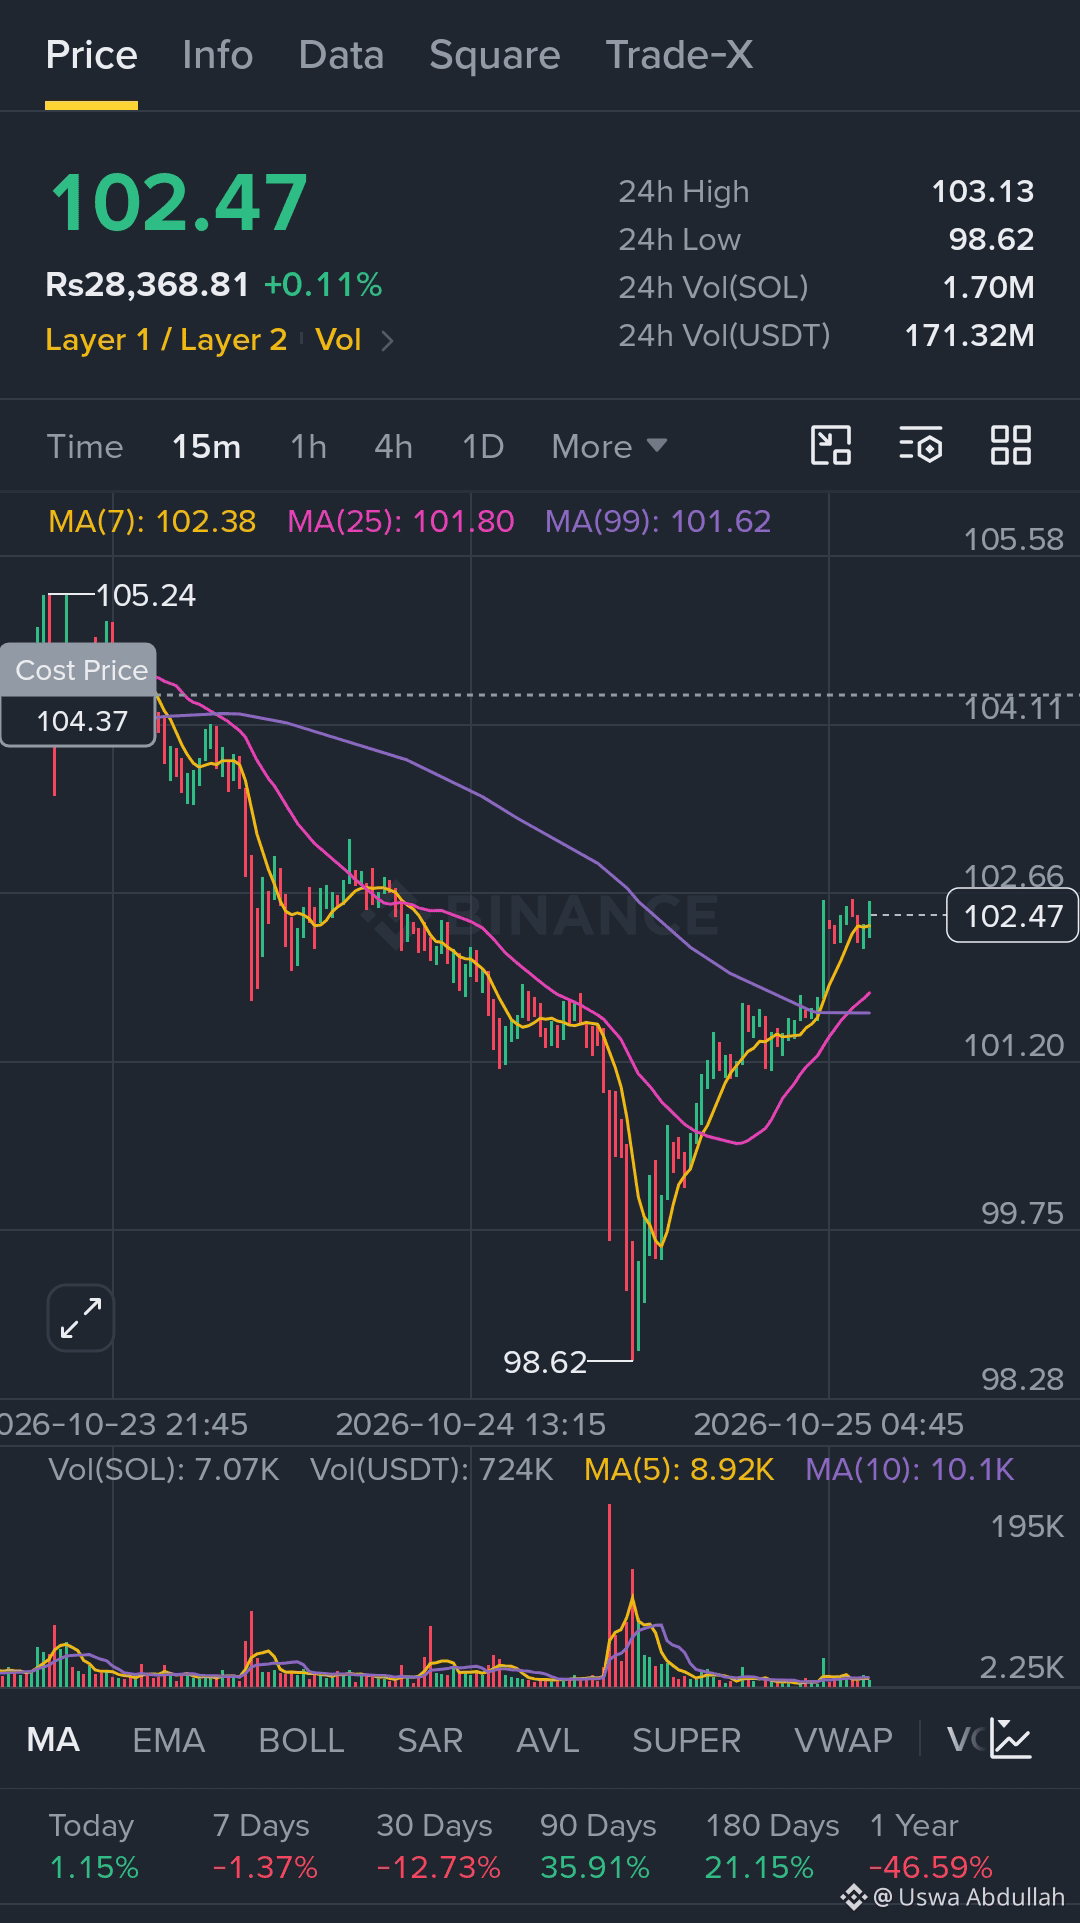
$SOL #TodayTopic 👇👇👇
{spot}(SOLUSDT)
Resistance: $104–$106
Bullish breakout target: $108–$112
🚀 Market outlook
🟢 Bullish scenario: A strong breakout above $106 with increasing volume could signal recovery toward $108–$112.
🔴 Bearish scenario: A confirmed break below $100 could expose $98 and potentially $97.
Final verdict: SOL remains under short-term pressure. Watch the $100 support zone and wait for breakout confirmation before entering a trade.
#SOL #Solana #CryptoAnalysis" #SOLUSDT #BinanceSquare #CryptoTrading #DYOR
$SOL #TodayTopic 👇👇👇
Resistance: $104–$106
Bullish breakout target: $108–$112
🚀 Market outlook
🟢 Bullish scenario: A strong breakout above $106 with increasing volume could signal recovery toward $108–$112.
🔴 Bearish scenario: A confirmed break below $100 could expose $98 and potentially $97.
Final verdict: SOL remains under short-term pressure. Watch the $100 support zone and wait for breakout confirmation before entering a trade.
#SOL #Solana #CryptoAnalysis" #SOLUSDT #BinanceSquare #CryptoTrading #DYOR
3

·
--
සත්යායනය කළ
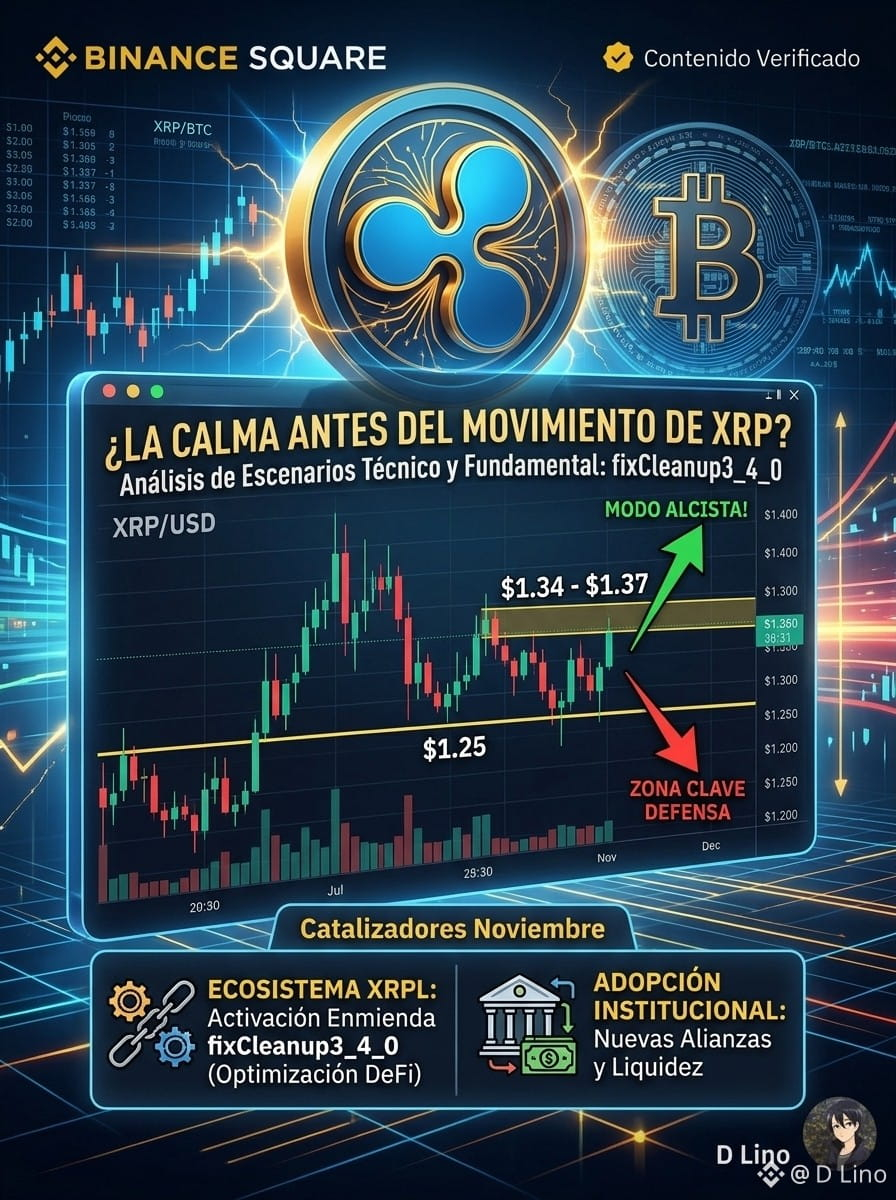
¿Estás mirando el par equivocado? 👁️ Mientras todos observan el gráfico de XRP en USDT, los verdaderos tiburones están vigilando el XRP/BTC.
Históricamente, las mayores fortunas en cripto no se hacen ganando dólares... se hacen ganando más Bitcoin. Y el par XRP/BTC está enviando señales que no puedes ignorar.
Los 2 Escenarios que definirán tu portafolio:
Escenario A (Rotación de Capital): Con BTC consolidando dominancia, el ecosistema XRPL se prepara para noviembre con la enmienda fixCleanup3_4_0. Una pequeña migración de volumen puede catapultar a XRP en el par contra Bitcoin, replicando los rebotes masivos de ciclos anteriores. ¿Zona de acumulación histórica? Estamos en ella.
⚠️ Escenario B (Succión de Liquidez): Si Bitcoin decide romper máximos en solitario, el par sufrirá un último test de estrés. Para el inversor estratégico, esto no es una pérdida: es la última ventana de descuento técnico.
La calma actual en Binance suele ser el preludio de movimientos institucionales. ¿Estás acumulando satoshis con XRP o esperando a que ocurra el movimiento?
$XRP #CryptoAnalysis"
{spot}(XRPUSDT)
¿Estás mirando el par equivocado? 👁️ Mientras todos observan el gráfico de XRP en USDT, los verdaderos tiburones están vigilando el XRP/BTC.
Históricamente, las mayores fortunas en cripto no se hacen ganando dólares... se hacen ganando más Bitcoin. Y el par XRP/BTC está enviando señales que no puedes ignorar.
Los 2 Escenarios que definirán tu portafolio:
Escenario A (Rotación de Capital): Con BTC consolidando dominancia, el ecosistema XRPL se prepara para noviembre con la enmienda fixCleanup3_4_0. Una pequeña migración de volumen puede catapultar a XRP en el par contra Bitcoin, replicando los rebotes masivos de ciclos anteriores. ¿Zona de acumulación histórica? Estamos en ella.
⚠️ Escenario B (Succión de Liquidez): Si Bitcoin decide romper máximos en solitario, el par sufrirá un último test de estrés. Para el inversor estratégico, esto no es una pérdida: es la última ventana de descuento técnico.
La calma actual en Binance suele ser el preludio de movimientos institucionales. ¿Estás acumulando satoshis con XRP o esperando a que ocurra el movimiento?
$XRP #CryptoAnalysis"
102
තවත් අන්තර්ගතයන් ගවේෂණය කිරීමට ඇතුල් වන්න
Binance චතුරශ්රය හි ගෝලීය ක්රිප්ටෝ පරිශීලකයින් හා එක්වන්න
⚡️ ක්රිප්ටෝ පිළිබඳ නවතම සහ ප්රයෝජනවත් තොරතුරු ලබා ගන්න.
💬 ලොව විශාලතම ක්රිප්ටෝ හුවමාරුව මගින් විශ්වාස කෙරේ.
👍 සත්යායනය කරන ලද නිර්මාණකරුවන්ගෙන් සැබෑ විදසුන් සොයා ගන්න.
විද්යුත් තැපෑල / දුරකථන අංකය
නැගී එන මාතෘකා
1
#BinancePick
2.5M නැරඹීම්
137,605 සාකච්ඡා කරමින්
2
#EarningsSeason
4.9M නැරඹීම්
23,879 සාකච්ඡා කරමින්
3
#ElectrumWalletBugLetRogueServersStealFunds
2,066 නැරඹීම්
123 සාකච්ඡා කරමින්
4
#ArgentineCourtDismissesLIBRACaseAgainstMilei
10,021 නැරඹීම්
218 සාකච්ඡා කරමින්
5
#SKHynixReportedlyPlansSpecialDividendFromKioxiaStakeSale
2,223 නැරඹීම්
35 සාකච්ඡා කරමින්
6
#KeystoneWebsiteBreachExposesBuyersShippingAddresses
1,177 නැරඹීම්
25 සාකච්ඡා කරමින්
7
#USQ3GDPAndSeptemberPCEDueNextWeek
83,037 නැරඹීම්
1,034 සාකච්ඡා කරමින්
8
#SouthKoreaDelaysCryptoIncomeTax
152,872 නැරඹීම්
1,073 සාකච්ඡා කරමින්
9
#ElectrumFixesHighRiskExploitInVersionsBefore4.8.3
67,327 නැරඹීම්
770 සාකච්ඡා කරමින්
10
#SouthKoreaPlansToRegulateStablecoinsUnderFXLaw
65,414 නැරඹීම්
686 සාකච්ඡා කරමින්