
Deirdre Contrerras Q4OM
8 Публикации

Deirdre Contrerras Q4OM
Отправить жалобу
Заблокировать пользователя
Открытая сделка
Случайный трейдер
3.3 г
7 подписок(и/а)
3 подписчиков(а)
1 понравилось
Посты
Портфель
·
--
Рост
См. перевод
🚀
{spot}(IOSTUSDT)
(IOST) Future Outlook: Could the Next Move Be Higher?
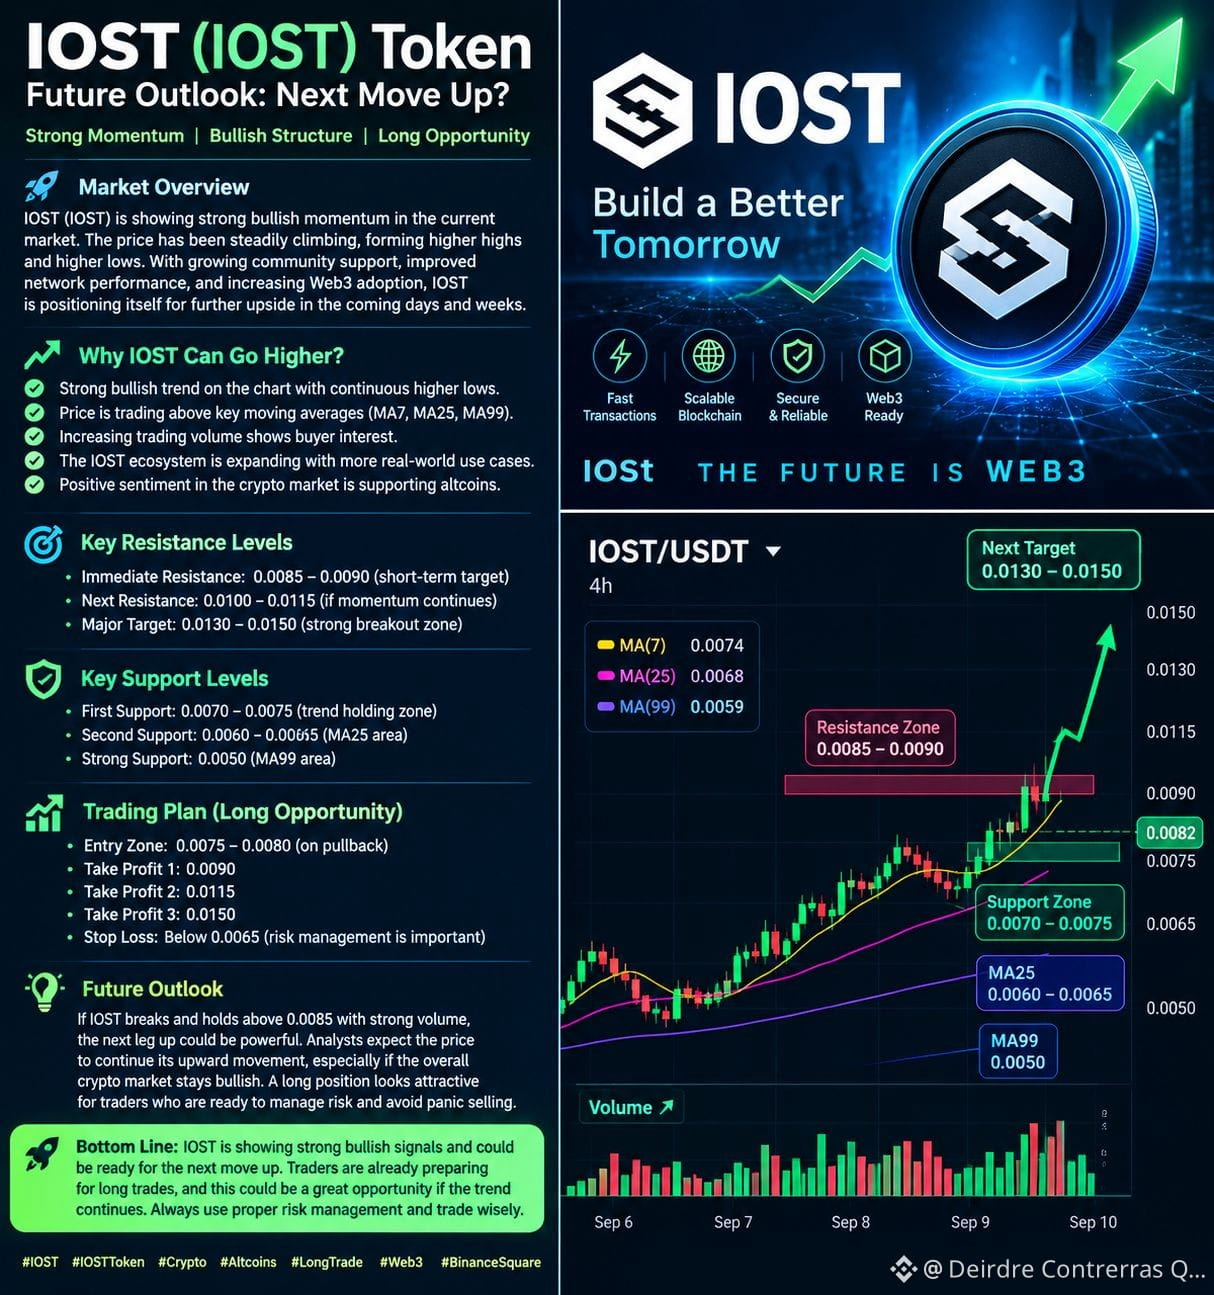
$IOST is showing an interesting bullish structure on the provided chart. Recent price action has been supported by higher highs and higher lows, while trading activity suggests increasing interest from buyers. If this momentum continues, $IOST could have room for another upward move.
📈 Why $IOST Could Move Higher
The chart shows the price trading above several key moving averages, including MA(7), MA(25), and MA(99). This structure generally indicates that short-term momentum is favoring buyers.
Another positive factor is the increase in trading volume during the upward move. Strong volume combined with a resistance breakout can provide better confirmation of a bullish continuation.
🎯 Key Levels to Watch
The first important resistance is around $0.0360. A clean breakout and sustained close above this level, especially with strong volume, could open the way toward the $0.0400–$0.0450 area.
On the downside, the $0.0310–$0.0280 zone can be watched as an important support area. Holding this zone would help maintain the current bullish structure.
🟢 Long Setup Idea
Traders looking for a long opportunity may prefer waiting for confirmation above resistance or a controlled pullback toward support rather than chasing a sudden pump.
If IOST breaks resistance with strong volume and maintains the breakout, bullish continuation becomes more likely. However, crypto markets can reverse quickly, so proper risk management and a defined stop-loss are important.
#IOST #IOSTUSDT #IOSTToken #Crypto #Altcoins #LongTrade #BinanceSquare #CryptoAnalysis
🚀
(IOST) Future Outlook: Could the Next Move Be Higher?
$IOST is showing an interesting bullish structure on the provided chart. Recent price action has been supported by higher highs and higher lows, while trading activity suggests increasing interest from buyers. If this momentum continues, $IOST could have room for another upward move.
📈 Why $IOST Could Move Higher
The chart shows the price trading above several key moving averages, including MA(7), MA(25), and MA(99). This structure generally indicates that short-term momentum is favoring buyers.
Another positive factor is the increase in trading volume during the upward move. Strong volume combined with a resistance breakout can provide better confirmation of a bullish continuation.
🎯 Key Levels to Watch
The first important resistance is around $0.0360. A clean breakout and sustained close above this level, especially with strong volume, could open the way toward the $0.0400–$0.0450 area.
On the downside, the $0.0310–$0.0280 zone can be watched as an important support area. Holding this zone would help maintain the current bullish structure.
🟢 Long Setup Idea
Traders looking for a long opportunity may prefer waiting for confirmation above resistance or a controlled pullback toward support rather than chasing a sudden pump.
If IOST breaks resistance with strong volume and maintains the breakout, bullish continuation becomes more likely. However, crypto markets can reverse quickly, so proper risk management and a defined stop-loss are important.
#IOST #IOSTUSDT #IOSTToken #Crypto #Altcoins #LongTrade #BinanceSquare #CryptoAnalysis
(IOST) Future Outlook: Could the Next Move Be Higher?
$IOST is showing an interesting bullish structure on the provided chart. Recent price action has been supported by higher highs and higher lows, while trading activity suggests increasing interest from buyers. If this momentum continues, $IOST could have room for another upward move.
📈 Why $IOST Could Move Higher
The chart shows the price trading above several key moving averages, including MA(7), MA(25), and MA(99). This structure generally indicates that short-term momentum is favoring buyers.
Another positive factor is the increase in trading volume during the upward move. Strong volume combined with a resistance breakout can provide better confirmation of a bullish continuation.
🎯 Key Levels to Watch
The first important resistance is around $0.0360. A clean breakout and sustained close above this level, especially with strong volume, could open the way toward the $0.0400–$0.0450 area.
On the downside, the $0.0310–$0.0280 zone can be watched as an important support area. Holding this zone would help maintain the current bullish structure.
🟢 Long Setup Idea
Traders looking for a long opportunity may prefer waiting for confirmation above resistance or a controlled pullback toward support rather than chasing a sudden pump.
If IOST breaks resistance with strong volume and maintains the breakout, bullish continuation becomes more likely. However, crypto markets can reverse quickly, so proper risk management and a defined stop-loss are important.
#IOST #IOSTUSDT #IOSTToken #Crypto #Altcoins #LongTrade #BinanceSquare #CryptoAnalysis
26
Статья
См. перевод
🚀 IOST (IOST) Future Outlook: Could the Next Move Be Higher?
IOST (IOST) is showing an interesting🚀 $IOST (IOST) Future Outlook: Could the Next Move Be Higher?
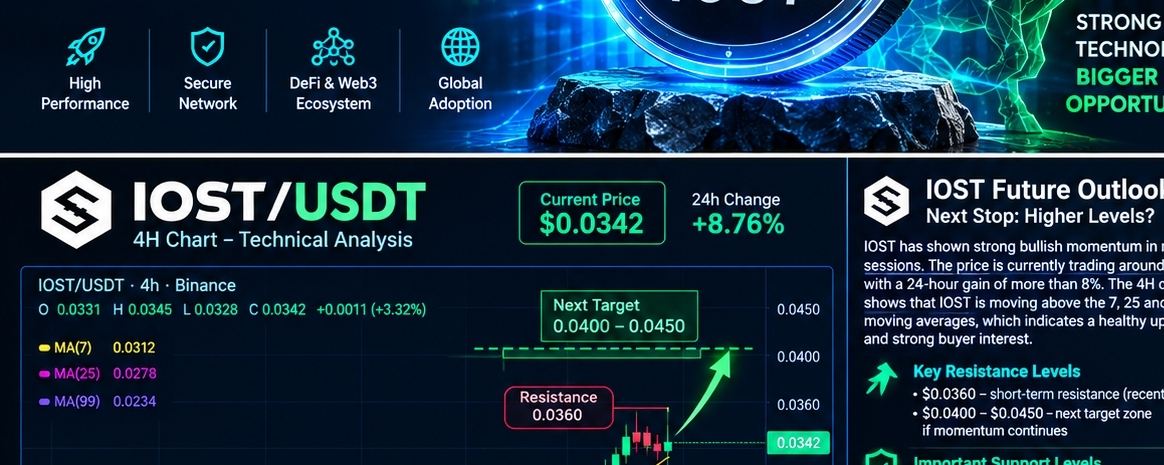
$IOST (IOST) is showing an interesting bullish structure on the provided chart. Recent price action has been supported by higher highs and higher lows, while trading activity suggests increasing interest from buyers. If this momentum continues, IOST could have room for another upward move.
📈 Why $IOST Could Move Higher
The chart shows the price trading above several key moving averages, including MA(7), MA(25), and MA(99). This structure generally indicates that short-term momentum is favoring buyers.
Another positive factor is the increase in trading volume during the upward move. Strong volume combined with a resistance breakout can provide better confirmation of a bullish continuation.
🎯 Key Levels to Watch
The first important resistance is around $0.0360. A clean breakout and sustained close above this level, especially with strong volume, could open the way toward the $0.0400–$0.0450 area.
On the downside, the $0.0310–$0.0280 zone can be watched as an important support area. Holding this zone would help maintain the current bullish structure.
🟢 Long Setup Idea
Traders looking for a long opportunity may prefer waiting for confirmation above resistance or a controlled pullback toward support rather than chasing a sudden pump.
If IOST breaks resistance with strong volume and maintains the breakout, bullish continuation becomes more likely. However, crypto markets can reverse quickly, so proper risk management and a defined stop-loss are important.
🔮 Future Outlook
Overall, IOST currently presents a bullish short-term setup, but the next major move depends on whether buyers can break and hold the key resistance. A successful breakout could attract additional momentum and push the token toward higher levels.
Bottom line: IOST is showing bullish momentum, and a confirmed breakout could create a potential opportunity for traders watching the long side. Always wait for confirmation and manage risk carefully. This is an educational market analysis, not financial advice.
#IOST #IOSTUSDT #IOSTToken #Crypto #Altcoins #LongTrade #BinanceSquare #CryptoAnalysis
🚀 IOST (IOST) Future Outlook: Could the Next Move Be Higher? IOST (IOST) is showing an interesting
🚀 $IOST (IOST) Future Outlook: Could the Next Move Be Higher?
$IOST (IOST) is showing an interesting bullish structure on the provided chart. Recent price action has been supported by higher highs and higher lows, while trading activity suggests increasing interest from buyers. If this momentum continues, IOST could have room for another upward move.
📈 Why $IOST Could Move Higher
The chart shows the price trading above several key moving averages, including MA(7), MA(25), and MA(99). This structure generally indicates that short-term momentum is favoring buyers.
Another positive factor is the increase in trading volume during the upward move. Strong volume combined with a resistance breakout can provide better confirmation of a bullish continuation.
🎯 Key Levels to Watch
The first important resistance is around $0.0360. A clean breakout and sustained close above this level, especially with strong volume, could open the way toward the $0.0400–$0.0450 area.
On the downside, the $0.0310–$0.0280 zone can be watched as an important support area. Holding this zone would help maintain the current bullish structure.
🟢 Long Setup Idea
Traders looking for a long opportunity may prefer waiting for confirmation above resistance or a controlled pullback toward support rather than chasing a sudden pump.
If IOST breaks resistance with strong volume and maintains the breakout, bullish continuation becomes more likely. However, crypto markets can reverse quickly, so proper risk management and a defined stop-loss are important.
🔮 Future Outlook
Overall, IOST currently presents a bullish short-term setup, but the next major move depends on whether buyers can break and hold the key resistance. A successful breakout could attract additional momentum and push the token toward higher levels.
Bottom line: IOST is showing bullish momentum, and a confirmed breakout could create a potential opportunity for traders watching the long side. Always wait for confirmation and manage risk carefully. This is an educational market analysis, not financial advice.
#IOST #IOSTUSDT #IOSTToken #Crypto #Altcoins #LongTrade #BinanceSquare #CryptoAnalysis
$IOST (IOST) is showing an interesting bullish structure on the provided chart. Recent price action has been supported by higher highs and higher lows, while trading activity suggests increasing interest from buyers. If this momentum continues, IOST could have room for another upward move.
📈 Why $IOST Could Move Higher
The chart shows the price trading above several key moving averages, including MA(7), MA(25), and MA(99). This structure generally indicates that short-term momentum is favoring buyers.
Another positive factor is the increase in trading volume during the upward move. Strong volume combined with a resistance breakout can provide better confirmation of a bullish continuation.
🎯 Key Levels to Watch
The first important resistance is around $0.0360. A clean breakout and sustained close above this level, especially with strong volume, could open the way toward the $0.0400–$0.0450 area.
On the downside, the $0.0310–$0.0280 zone can be watched as an important support area. Holding this zone would help maintain the current bullish structure.
🟢 Long Setup Idea
Traders looking for a long opportunity may prefer waiting for confirmation above resistance or a controlled pullback toward support rather than chasing a sudden pump.
If IOST breaks resistance with strong volume and maintains the breakout, bullish continuation becomes more likely. However, crypto markets can reverse quickly, so proper risk management and a defined stop-loss are important.
🔮 Future Outlook
Overall, IOST currently presents a bullish short-term setup, but the next major move depends on whether buyers can break and hold the key resistance. A successful breakout could attract additional momentum and push the token toward higher levels.
Bottom line: IOST is showing bullish momentum, and a confirmed breakout could create a potential opportunity for traders watching the long side. Always wait for confirmation and manage risk carefully. This is an educational market analysis, not financial advice.
#IOST #IOSTUSDT #IOSTToken #Crypto #Altcoins #LongTrade #BinanceSquare #CryptoAnalysis
1
57
См. перевод
🚀 SOPH Token Future Outlook: Is the Bullish Trend Ready for Another Move?
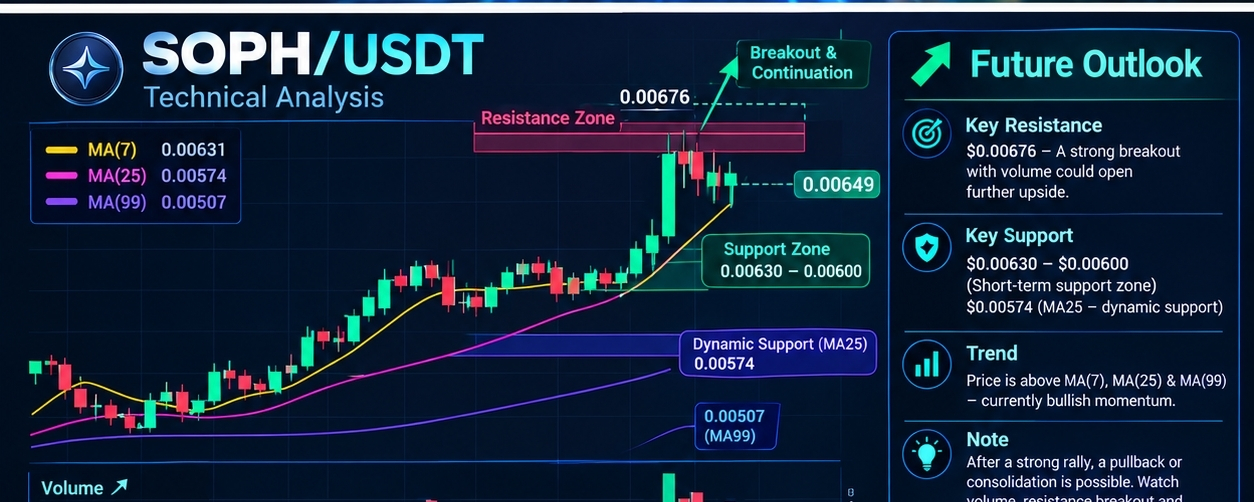
$SOPH /USDT has shown strong bullish momentum in the recent session. According to the provided 15-minute chart, $SOPH is trading around $0.00649, while the recent high reached approximately $0.00676. The token has also recorded a 56%+ 24-hour increase, showing strong buying interest.
One of the key points on the chart is that the price is currently trading above the MA(7), MA(25), and MA(99). This is a positive sign for the short-term trend. The moving averages are around $0.00631, $0.00574, and $0.00507, respectively, indicating that buyers currently have the upper hand.
📈 Key Resistance for $SOPH
The $0.00676 area is an important resistance level because the price recently faced rejection there. If SOPH breaks above this level with strong trading volume and holds it, the bullish momentum could continue.
After a confirmed breakout, traders may watch for new highs and psychological price levels. However, future price targets should not be considered guaranteed.#SOPH #USIranTradeTankerStrikesEscalate #RussiaUkraineTradeStrikesKushnerWitkoffToKyiv
🚀 SOPH Token Future Outlook: Is the Bullish Trend Ready for Another Move?
$SOPH /USDT has shown strong bullish momentum in the recent session. According to the provided 15-minute chart, $SOPH is trading around $0.00649, while the recent high reached approximately $0.00676. The token has also recorded a 56%+ 24-hour increase, showing strong buying interest.
One of the key points on the chart is that the price is currently trading above the MA(7), MA(25), and MA(99). This is a positive sign for the short-term trend. The moving averages are around $0.00631, $0.00574, and $0.00507, respectively, indicating that buyers currently have the upper hand.
📈 Key Resistance for $SOPH
The $0.00676 area is an important resistance level because the price recently faced rejection there. If SOPH breaks above this level with strong trading volume and holds it, the bullish momentum could continue.
After a confirmed breakout, traders may watch for new highs and psychological price levels. However, future price targets should not be considered guaranteed.#SOPH #USIranTradeTankerStrikesEscalate #RussiaUkraineTradeStrikesKushnerWitkoffToKyiv
$SOPH /USDT has shown strong bullish momentum in the recent session. According to the provided 15-minute chart, $SOPH is trading around $0.00649, while the recent high reached approximately $0.00676. The token has also recorded a 56%+ 24-hour increase, showing strong buying interest.
One of the key points on the chart is that the price is currently trading above the MA(7), MA(25), and MA(99). This is a positive sign for the short-term trend. The moving averages are around $0.00631, $0.00574, and $0.00507, respectively, indicating that buyers currently have the upper hand.
📈 Key Resistance for $SOPH
The $0.00676 area is an important resistance level because the price recently faced rejection there. If SOPH breaks above this level with strong trading volume and holds it, the bullish momentum could continue.
After a confirmed breakout, traders may watch for new highs and psychological price levels. However, future price targets should not be considered guaranteed.#SOPH #USIranTradeTankerStrikesEscalate #RussiaUkraineTradeStrikesKushnerWitkoffToKyiv

50
Статья
🚀 Прогноз по будущему SOPH Token: готов ли бычий тренд к следующему движению?$SOPH /USDT показал сильный восходящий импульс в последней сессии. Согласно предоставленному 15-минутному графику, $SOPH торгуется примерно на уровне $0.00649, тогда как недавний максимум достигал примерно $0.00676. Токен также зафиксировал рост более чем на 56% за 24 часа, демонстрируя сильный интерес со стороны покупателей.
Один из ключевых моментов на графике: цена сейчас торгуется выше MA(7), MA(25) и MA(99). Это позитивный сигнал для краткосрочного тренда. Скользящие средние находятся примерно на уровнях $0.00631, $0.00574 и $0.00507 соответственно, что указывает на то, что сейчас преимущество у покупателей.
🚀 Прогноз по будущему SOPH Token: готов ли бычий тренд к следующему движению?
$SOPH /USDT показал сильный восходящий импульс в последней сессии. Согласно предоставленному 15-минутному графику, $SOPH торгуется примерно на уровне $0.00649, тогда как недавний максимум достигал примерно $0.00676. Токен также зафиксировал рост более чем на 56% за 24 часа, демонстрируя сильный интерес со стороны покупателей.
Один из ключевых моментов на графике: цена сейчас торгуется выше MA(7), MA(25) и MA(99). Это позитивный сигнал для краткосрочного тренда. Скользящие средние находятся примерно на уровнях $0.00631, $0.00574 и $0.00507 соответственно, что указывает на то, что сейчас преимущество у покупателей.
Один из ключевых моментов на графике: цена сейчас торгуется выше MA(7), MA(25) и MA(99). Это позитивный сигнал для краткосрочного тренда. Скользящие средние находятся примерно на уровнях $0.00631, $0.00574 и $0.00507 соответственно, что указывает на то, что сейчас преимущество у покупателей.
110
См. перевод
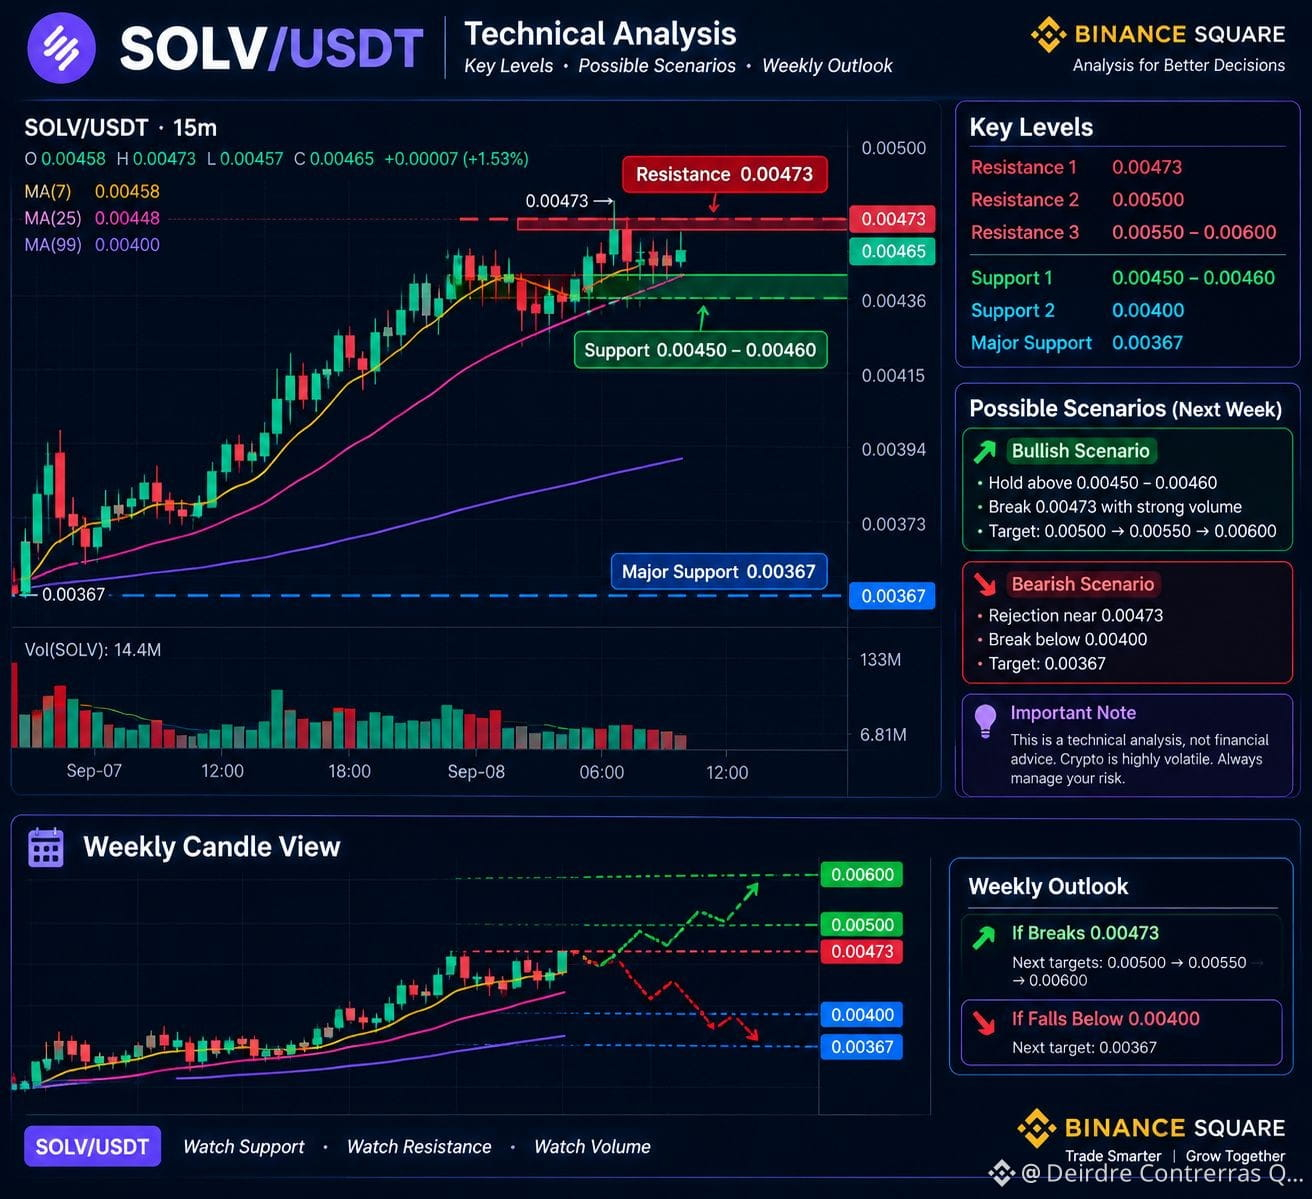
SOLV/USDT Technical Analysis: Can the Current Momentum Continue?
$SOLV /USDT has recently shown strong upward momentum on the 15-minute chart. At the time shown in the chart, $SOLV is trading around 0.00465 USDT, with a 24-hour high near 0.00473 and a low around 0.00367. The token has gained significantly during the recent move, making the current price action an interesting area to watch.
The most important point is the 0.00473 resistance zone. Price recently moved close to this level but faced some selling pressure, creating a small pullback. If $SOLV can break above 0.00473 with strong volume and maintain that level, it could indicate that buyers are still in control.#SOLV
#SolvProtocol
#SOLVUSDT
#Crypto
#DeFi
SOLV/USDT Technical Analysis: Can the Current Momentum Continue?
$SOLV /USDT has recently shown strong upward momentum on the 15-minute chart. At the time shown in the chart, $SOLV is trading around 0.00465 USDT, with a 24-hour high near 0.00473 and a low around 0.00367. The token has gained significantly during the recent move, making the current price action an interesting area to watch.
The most important point is the 0.00473 resistance zone. Price recently moved close to this level but faced some selling pressure, creating a small pullback. If $SOLV can break above 0.00473 with strong volume and maintain that level, it could indicate that buyers are still in control.#SOLV
#SolvProtocol
#SOLVUSDT
#Crypto
#DeFi
$SOLV /USDT has recently shown strong upward momentum on the 15-minute chart. At the time shown in the chart, $SOLV is trading around 0.00465 USDT, with a 24-hour high near 0.00473 and a low around 0.00367. The token has gained significantly during the recent move, making the current price action an interesting area to watch.
The most important point is the 0.00473 resistance zone. Price recently moved close to this level but faced some selling pressure, creating a small pullback. If $SOLV can break above 0.00473 with strong volume and maintain that level, it could indicate that buyers are still in control.#SOLV
#SolvProtocol
#SOLVUSDT
#Crypto
#DeFi
37
Статья
Технический анализ SOLV/USDT: сможет ли текущий импульс продолжиться$SOLV /USDT недавно продемонстрировал сильный восходящий импульс на 15-минутном графике. На момент, указанный на графике, $SOLV торгуется примерно по 0.00465 USDT, при этом 24-часовой максимум находится около 0.00473, а минимум — примерно 0.00367. Токен заметно вырос во время недавнего движения, поэтому текущее ценовое поведение — интересная зона для наблюдения.
Самая важная точка — зона сопротивления 0.00473. Недавно цена подошла к этому уровню, но столкнулась с некоторым давлением продаж, из-за чего произошел небольшой откат. Если $SOLV сможет пробить отметку 0.00473 при сильном объеме и удержать этот уровень, это может указывать на то, что контроль по-прежнему у покупателей.
Технический анализ SOLV/USDT: сможет ли текущий импульс продолжиться
$SOLV /USDT недавно продемонстрировал сильный восходящий импульс на 15-минутном графике. На момент, указанный на графике, $SOLV торгуется примерно по 0.00465 USDT, при этом 24-часовой максимум находится около 0.00473, а минимум — примерно 0.00367. Токен заметно вырос во время недавнего движения, поэтому текущее ценовое поведение — интересная зона для наблюдения.
Самая важная точка — зона сопротивления 0.00473. Недавно цена подошла к этому уровню, но столкнулась с некоторым давлением продаж, из-за чего произошел небольшой откат. Если $SOLV сможет пробить отметку 0.00473 при сильном объеме и удержать этот уровень, это может указывать на то, что контроль по-прежнему у покупателей.
Самая важная точка — зона сопротивления 0.00473. Недавно цена подошла к этому уровню, но столкнулась с некоторым давлением продаж, из-за чего произошел небольшой откат. Если $SOLV сможет пробить отметку 0.00473 при сильном объеме и удержать этот уровень, это может указывать на то, что контроль по-прежнему у покупателей.
77
Анализ цены токена CNPY: сможет ли CNPY продолжить свой будущий рост?$CNPY в настоящее время демонстрирует высокую активность на рынке, привлекая внимание трейдеров и криптоинвесторов. На представленном снимке рынка $CNPY торгуется примерно на $0.2478, а отображаемое движение цены показывает заметный рост примерно на 124%. Такой резкий скачок может указывать на сильный интерес к покупкам, но также может привести к более высокой волатильности и вероятности коррекции цены.
Книга ордеров, показанная на графике, дает интересное представление о текущем интересе к покупке и продаже. Со стороны покупок размещено несколько ордеров в районе $0.248–$0.250. Особенно заметный покупательский ордер находится примерно на $0.24857, что указывает на то, что эта зона может стать важной краткосрочной зоной поддержки, если покупатели продолжат ее защищать.
Анализ цены токена CNPY: сможет ли CNPY продолжить свой будущий рост?
$CNPY в настоящее время демонстрирует высокую активность на рынке, привлекая внимание трейдеров и криптоинвесторов. На представленном снимке рынка $CNPY торгуется примерно на $0.2478, а отображаемое движение цены показывает заметный рост примерно на 124%. Такой резкий скачок может указывать на сильный интерес к покупкам, но также может привести к более высокой волатильности и вероятности коррекции цены.
Книга ордеров, показанная на графике, дает интересное представление о текущем интересе к покупке и продаже. Со стороны покупок размещено несколько ордеров в районе $0.248–$0.250. Особенно заметный покупательский ордер находится примерно на $0.24857, что указывает на то, что эта зона может стать важной краткосрочной зоной поддержки, если покупатели продолжат ее защищать.
Книга ордеров, показанная на графике, дает интересное представление о текущем интересе к покупке и продаже. Со стороны покупок размещено несколько ордеров в районе $0.248–$0.250. Особенно заметный покупательский ордер находится примерно на $0.24857, что указывает на то, что эта зона может стать важной краткосрочной зоной поддержки, если покупатели продолжат ее защищать.
540
См. перевод
#MyFirstSquarePost New to Binance Square, thrilled to share and connect with everyone here!
#MyFirstSquarePost New to Binance Square, thrilled to share and connect with everyone here!
156
Войдите, чтобы посмотреть больше материала
Присоединяйтесь к пользователям криптовалют по всему миру на Binance Square
⚡️ Получайте новейшую и полезную информацию о криптоактивах.
💬 Нам доверяет крупнейшая в мире криптобиржа.
👍 Получите достоверные аналитические данные от верифицированных создателей контента.
Эл. почта/номер телефона
В тренде
fomcотслеживание
Просмотров: 29,407
302 обсуждают
🚨 Сегодня FOMC — ждите волатильность 🚨
16 сентября Федеральная резервная система объявит решение по ставке.
⏰ Решение: 18:00 UTC
🎙️ Пресс-конференция: 18:30 UTC
Рынок уже заложил повышение на 0.25%. Главное — не само решение, а тон комментариев ФРС.
- Более «ястребиный» тон → давление на $BTC и альты
- Более мягкий тон → возможен отскок «на облегчении»
Важно:
• Не гонитесь за первой свечой
• Держите плечо низким
• Следите за BTC, DXY и доходностями
• Дождитесь, пока рынок успокоится после пресс-конференции
Дни FOMC — это про терпение, а не про FOMO.#ПротоколFOMC #fomcотслеживание #MSTRTradingVolumeSurpassesMorganStanley
Pandas
·Лайков: 2
·Просмотров: 108
ПротоколFOMC
Просмотров: 24,351
98 обсуждают
ChainlinkPowersBottomlinePaymentPlatform
Просмотров: 1,744
86 обсуждают