ZAMA Surges 13.3% to $0.06002 as Price Climbs Steadily Above All Key Moving Averages
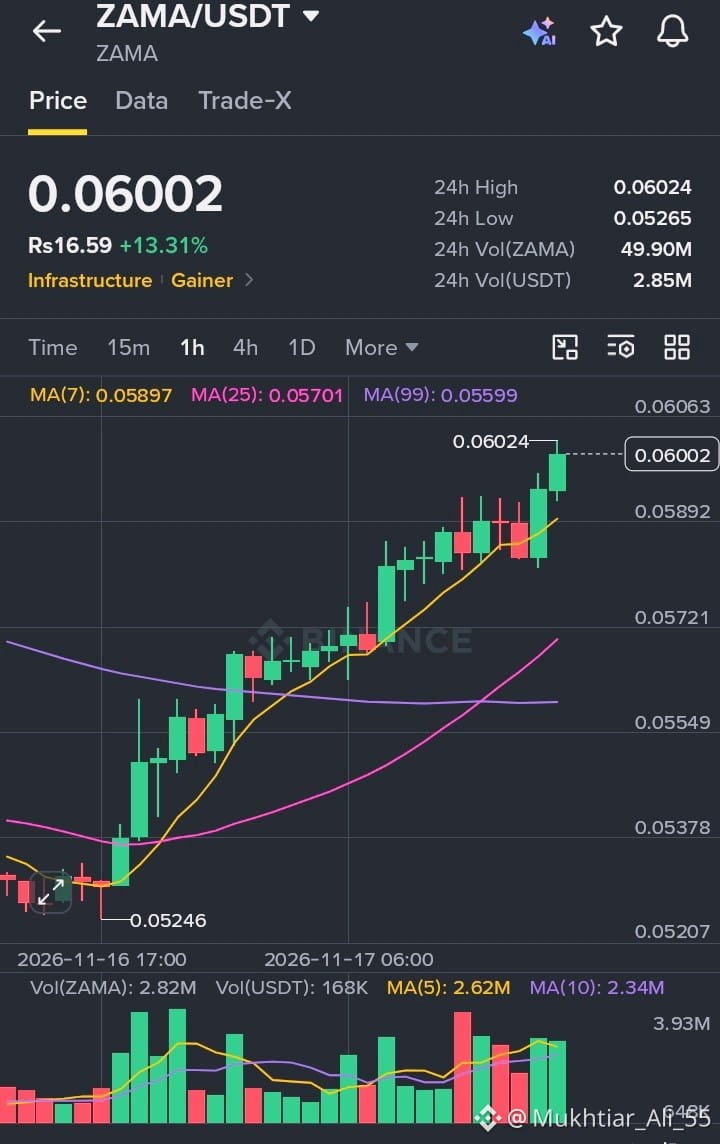
ZAMA is in a clean, steady uptrend. ZAMA/USDT is trading at 0.06002 USDT, up 13.31% on the day, after bouncing from a 24h low of 0.05265 and reaching a high of 0.06024.
The 1-hour chart shows a well-structured climb from the November 16 low, with price forming a consistent run of higher highs and higher lows. The 7-period moving average (0.05897) is rising steadily just beneath price, acting as dynamic support on each small dip. The 25-period (0.05701) has turned sharply upward, and the 99-period (0.05599) has flattened out well below, showing that price has left the longer-term averages far behind.
Price is now pressing right against the 24h high of 0.06024, and the round 0.060 level is being tested for the first time. The latest candle is a strong green one, which shows buyers are still in control, though after such a smooth run, some hesitation near this level would be normal.
Volume is healthy, with around 49.90M ZAMA, or roughly 2.85M USDT, traded in the last 24 hours. Recent green candles are coming with decent volume, which supports the move, though the most recent bars are not far above average, so a stronger pickup would help confirm a breakout.
What I’m watching next:
Resistance: the 0.06024 area, the 24h high, followed by the 0.0606 level. A clean hourly close above 0.060 could open the way toward 0.062.
Support: the 0.0589 zone near the MA(7), followed by the 0.0570 level at the MA(25). A close below 0.0570 would weaken the trend structure.
For now, momentum clearly favors the bulls, but after a 13% daily gain, a small pullback to the MA(7) would be healthy before any continuation.
#ZAMA #CryptoTrading #TechnicalAnalysis #AltcoinUpdate #CryptoMarket
$ZAMA
ZAMA is in a clean, steady uptrend. ZAMA/USDT is trading at 0.06002 USDT, up 13.31% on the day, after bouncing from a 24h low of 0.05265 and reaching a high of 0.06024.
The 1-hour chart shows a well-structured climb from the November 16 low, with price forming a consistent run of higher highs and higher lows. The 7-period moving average (0.05897) is rising steadily just beneath price, acting as dynamic support on each small dip. The 25-period (0.05701) has turned sharply upward, and the 99-period (0.05599) has flattened out well below, showing that price has left the longer-term averages far behind.
Price is now pressing right against the 24h high of 0.06024, and the round 0.060 level is being tested for the first time. The latest candle is a strong green one, which shows buyers are still in control, though after such a smooth run, some hesitation near this level would be normal.
Volume is healthy, with around 49.90M ZAMA, or roughly 2.85M USDT, traded in the last 24 hours. Recent green candles are coming with decent volume, which supports the move, though the most recent bars are not far above average, so a stronger pickup would help confirm a breakout.
What I’m watching next:
Resistance: the 0.06024 area, the 24h high, followed by the 0.0606 level. A clean hourly close above 0.060 could open the way toward 0.062.
Support: the 0.0589 zone near the MA(7), followed by the 0.0570 level at the MA(25). A close below 0.0570 would weaken the trend structure.
For now, momentum clearly favors the bulls, but after a 13% daily gain, a small pullback to the MA(7) would be healthy before any continuation.
#ZAMA #CryptoTrading #TechnicalAnalysis #AltcoinUpdate #CryptoMarket
$ZAMA