🚀 $SKDDB Jumps 17.52% — Is Another Rally Brewing? 📈
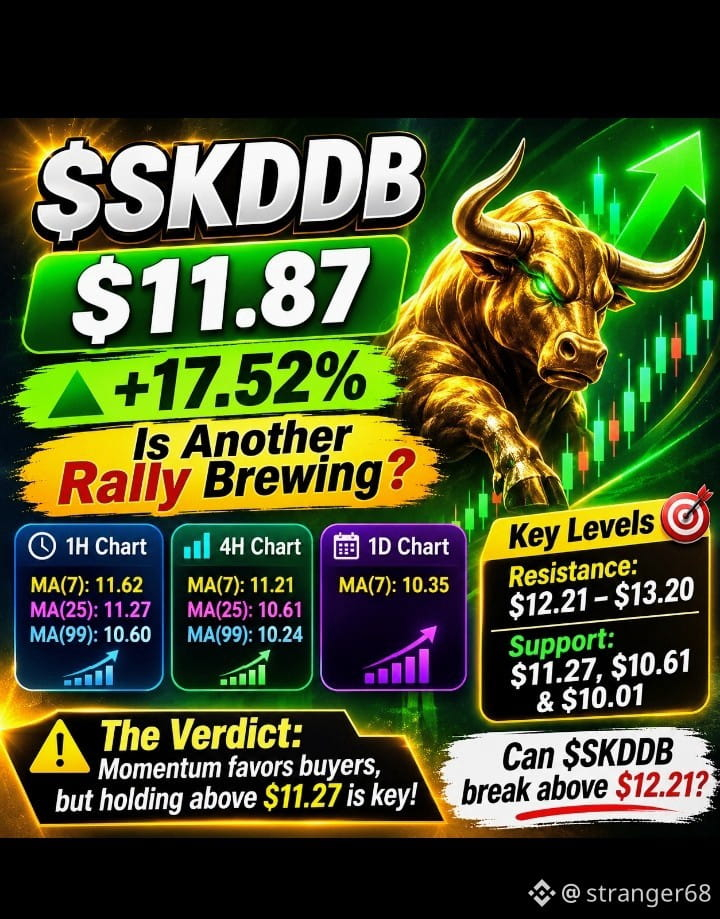
🔥 $SKDDB is showing impressive momentum, climbing to $11.87 (+17.52%) and reaching a fresh 24H high of $11.87. Buyers have pushed price higher after recovering from the $10.01 low. The question now is whether this momentum can sustain another upward move. ⚡
⏱️ 1H Chart: Short-term momentum remains positive, with price holding above MA(7) at $11.62, MA(25) at $11.27, and MA(99) at $10.60. This bullish alignment supports the current recovery, although a pullback could test the $11.60–$11.27 support zone. 📊
📈 4H Chart: The broader recovery is strengthening, with price comfortably above all three moving averages. MA(7) at $11.21, MA(25) at $10.61, and MA(99) at $10.24 indicate improving trend structure. A sustained move higher could open the door toward $12.21, followed by the previous $13.20 high. 🔥
🌍 1D Chart: The daily chart shows a volatile but notable recovery from $7.38. Price has climbed back to $11.87, while MA(7) sits at $10.35. However, the limited daily history and sharp price swings call for caution. ⚠️
🎯 Key Levels: Resistance: $12.21–$13.20 | Support: $11.27, $10.61 and $10.01. 🔑
⚡ The Verdict: Momentum currently favors buyers, but holding above $11.27 will be important to sustain the recovery. Remember, this is a 2x short ETF linked to SK Hynix, so its leveraged inverse exposure carries additional risk.
❓Can $SKDDB break above $12.21 and challenge $13.20, or will sellers step in again? 🚀
#SKDDB #StockMarket #Trading
#HuangReportedlyConsidersReturnToNvidia #AnthropicIPOTestsInvestorAppetiteForAI #BitcoinExtendsLosingStreakToSixWeeks #MUFGSMFGMizuhoPlanYenBackedStablecoin
🔥 $SKDDB is showing impressive momentum, climbing to $11.87 (+17.52%) and reaching a fresh 24H high of $11.87. Buyers have pushed price higher after recovering from the $10.01 low. The question now is whether this momentum can sustain another upward move. ⚡
⏱️ 1H Chart: Short-term momentum remains positive, with price holding above MA(7) at $11.62, MA(25) at $11.27, and MA(99) at $10.60. This bullish alignment supports the current recovery, although a pullback could test the $11.60–$11.27 support zone. 📊
📈 4H Chart: The broader recovery is strengthening, with price comfortably above all three moving averages. MA(7) at $11.21, MA(25) at $10.61, and MA(99) at $10.24 indicate improving trend structure. A sustained move higher could open the door toward $12.21, followed by the previous $13.20 high. 🔥
🌍 1D Chart: The daily chart shows a volatile but notable recovery from $7.38. Price has climbed back to $11.87, while MA(7) sits at $10.35. However, the limited daily history and sharp price swings call for caution. ⚠️
🎯 Key Levels: Resistance: $12.21–$13.20 | Support: $11.27, $10.61 and $10.01. 🔑
⚡ The Verdict: Momentum currently favors buyers, but holding above $11.27 will be important to sustain the recovery. Remember, this is a 2x short ETF linked to SK Hynix, so its leveraged inverse exposure carries additional risk.
❓Can $SKDDB break above $12.21 and challenge $13.20, or will sellers step in again? 🚀
#SKDDB #StockMarket #Trading
#HuangReportedlyConsidersReturnToNvidia #AnthropicIPOTestsInvestorAppetiteForAI #BitcoinExtendsLosingStreakToSixWeeks #MUFGSMFGMizuhoPlanYenBackedStablecoin