
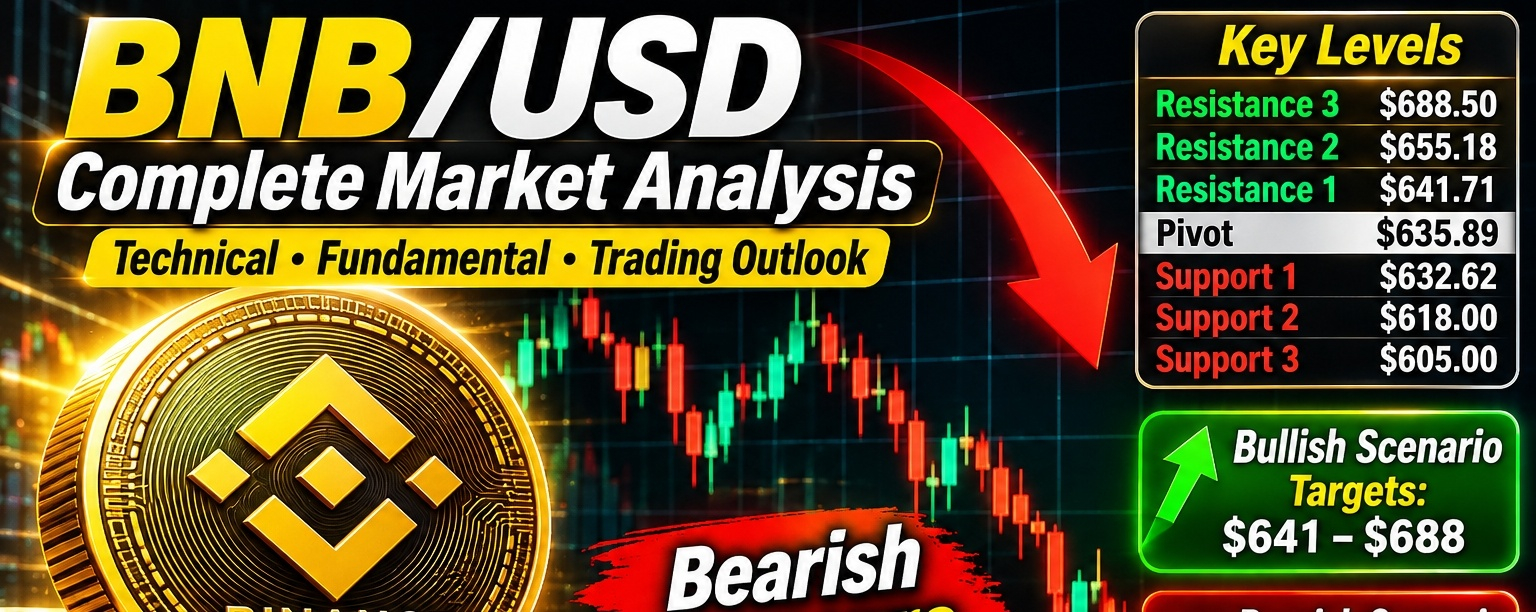

$BNB /USD Complete Market Analysis 13 November 2026 · Technical, fundamental and trading analysis

Short-term bearish pressure
BNB/USD is showing significant selling pressure. The important question is whether BNB can hold its current support zone and recover, or whether sellers will push the price toward lower levels.

### 1\. Current $BNB /USD market snapshot
BNB / USD
Bearish
### $626.20
-7.07% over 24 hours
Binance market snapshot, November 13, 2026.
Market capitalization
$82.4 billion
24-hour volume
$1.4 billion
24-hour high
$675.06
24-hour low
$625.31
Source: Binance. Live Chart
$BNB has experienced a substantial decline, and buyers need to regain control before a convincing recovery can develop.
### 2\. Technical analysis
Daily timeframe (1D)
* Overall trend: Bearish.
* RSI(14): 19.77, deeply oversold.
* MACD: -6.714, bearish.
* ADX: 42.75, indicating a strong directional trend.
* Moving averages: All 12 listed moving-average signals are bearish.
Source: Investing.com technical indicators, November 13. Investing.com India
4-hour timeframe (4H)
Watch these conditions:
* Price recovering above $641–$644.
* Four-hour candle closing above resistance.
* Increasing buying volume.
* RSI recovering above 30.
1-hour timeframe (1H)
A possible short-term reversal requires higher highs, higher lows and stronger buying volume. Otherwise, a bounce may be temporary.
### 3\. Important support and resistance levels
Based on the latest market and order-book information, these are the important areas to monitor.
| Level | Price (USD) | Importance |
| ----------------- | ----------- | --------------------- |
| Resistance 3 | $688.50 | Major resistance |
| Resistance 2 | $655.18 | Strong resistance |
| Resistance 1 | $641.71 | First recovery hurdle |
| Current reference | $635.89 | Market reference |
| Support 1 | $632.62 | Immediate support |
| Support 2 | $618.00 | Important support |
| Support 3 | $605.00 | Major support |
CoinGlass
Important: These are reference levels from market liquidity and order-book data, not guaranteed price turning points. The live market can change quickly.
### 4\. Bullish scenario
Potential recovery
BNB needs to recover the $641–$655 resistance region.
| Target | Price |
| ---------------- | --------- |
| First target | $641.71 |
| Second target | $655.18 |
| Third target | $675 |
| Extended target | $688.50 |
| Further recovery | $700–$720 |
Bullish confirmation:
* BNB holds above $632.
* Buyers reclaim $641.
* Four-hour candle closes above $655.
* Volume increases during the rally.
* Price forms higher highs.
If these conditions develop, a recovery toward $675–$688 becomes possible.
### 5\. Bearish scenario
Downside risk
If BNB loses its immediate support, watch these levels:
| Target | Price |
| --------------- | ----- |
| First target | $618 |
| Second target | $605 |
| Third target | $590 |
| Extended target | $570 |
A sustained break below $618 could increase downside pressure.
The bearish outlook would weaken if BNB quickly reclaims $655.
### 6\. Market sentiment and liquidation analysis
Current derivatives data show significant selling pressure.
* 24-hour long liquidations: approximately $12.84 million.
* Futures taker buy/sell ratio: 0.81.
* Spot net flows: approximately -$14.56 million.
* Funding rate: approximately 0.002%.
* Short positions are increasing as price falls.
These readings suggest sellers currently have the advantage. CoinGlass
### 7\. Fundamental analysis
BNB has several sources of long-term utility:
* Binance ecosystem: Trading fee discounts and exchange-related utility.
* BNB Chain: Gas fees and blockchain transactions.
* Token burns: Periodic supply reduction through BNB's burn mechanisms.
* DeFi ecosystem: Decentralized exchanges, lending and other applications.
* Market adoption: Demand from traders, developers and blockchain users.
However, regulatory developments, Binance exchange activity, competition from other blockchains and overall crypto market sentiment can influence BNB's valuation.
### 8\. Trading strategies
Three conditional trading setups to consider:
| Strategy | Entry condition | Target |
| --------------- | ------------------------------- | --------- |
| Support buy | Bullish reversal near $618–$633 | $641–$655 |
| Breakout buy | Confirmed 4H close above $655 | $675–$688 |
| Breakdown short | Confirmed break below $618 | $605–$590 |
Risk management
* Risk no more than 1% of capital per trade.
* Use a stop-loss.
* Avoid high leverage during volatile conditions.
* Wait for candle-close confirmation.
* Do not enter a long position just because RSI is oversold.
### 9\. BNB/USD price forecast
Short-term outlook: Next 24–48 hours
Bearish bias
### $605–$655
Illustrative scenario range, not a guaranteed prediction.
Medium-term outlook: Next 1–4 weeks
* Bearish below $655.
* Recovery possibility toward $675–$700.
* Further downside risk toward $590–$605 if support fails.
Long-term outlook: 3–12 months
Depends on:
* BNB Chain adoption.
* Token burn activity.
* Binance ecosystem growth.
* Bitcoin's broader market direction.
* Regulatory developments.
### 10\. Final BNB/USD trading verdict
BEARISH
My technical assessment
| Indicator | Signal |
| ----------------- | --------------- |
| Daily trend | Bearish |
| RSI | Deeply oversold |
| MACD | Bearish |
| Moving averages | Strong sell |
| Immediate support | $632 |
| Major support | $618 |
| First resistance | $642 |
| Strong resistance | $655 |
My conclusion: BNB is under significant selling pressure. I would avoid chasing a falling market. The $618–$632 zone is important for buyers. A recovery above $655 would provide stronger evidence of a bullish reversal.
This is educational analysis, not guaranteed financial advice. Market quotes and levels can change.
### 11\. What to watch on Binance
My three most important levels:
* $655 — bullish recovery confirmation.
* $632 — immediate support.
* $618 — important downside warning.
I can also prepare a detailed BNB/USD entry, take-profit and stop-loss trading chart.