

Bitcoin Holds $74,000 Amid TradFi Rebound: 2026 Crypto Survival Guide
Bitcoin has stalled near the crucial $74,000 baseline, lagging behind a tech-driven Wall Street recovery after an unexpectedly hot CPI print shook broader macroeconomic expectations. Meanwhile, institutional appetite is facing a sustained cool-off as US Spot Bitcoin ETFs record four consecutive days of net outflows, led by an eight-day redemption streak in BlackRock’s IBIT. Understanding the tug-of-war between institutional redemptions, macro pressure, and on-chain support is essential for navigating today's high-stakes market environment.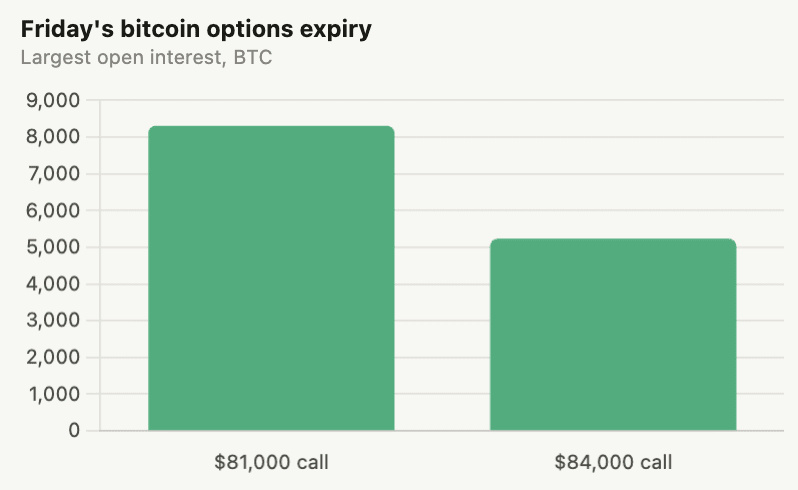
1. 🛡️ $74,000 Defense: The Psychological Battleground
Bitcoin stabilized around $74,000 following a brief dip to $72,700, proving that buyers are actively stepping in to defend multi-month structural support. While broader sentiment sits in fear territory, defending this price floor prevents an aggressive slide into deeper lower-range liquidity.
• 2026 Insight: A persistent hold above $73,000–$74,000 indicates that spot accumulation remains resilient despite aggressive derivative de-risking.
[Insert Banner/Image: High-resolution BTC/USDT 4H chart displaying the key horizontal support band between $72,700 and $74,000 with volume profiles]
2. 📉 ETF Outflows: Wall Street's Institutional Pause
US spot Bitcoin ETFs recorded a net loss of $95 million, extending total net redemptions across four consecutive trading sessions. Most notably, BlackRock's flagship iShares Bitcoin Trust (IBIT) recorded its eighth straight day of net withdrawals, offloading $78 million in a single session.
• Strategy: Track institutional net flow metrics alongside price; institutional pauses frequently mark local range compression before liquidity rotates back into spot markets.
[Insert Banner/Image: Infographic comparing institutional ETF inflows vs. outflows over the last 10 days, highlighting BlackRock's IBIT streak]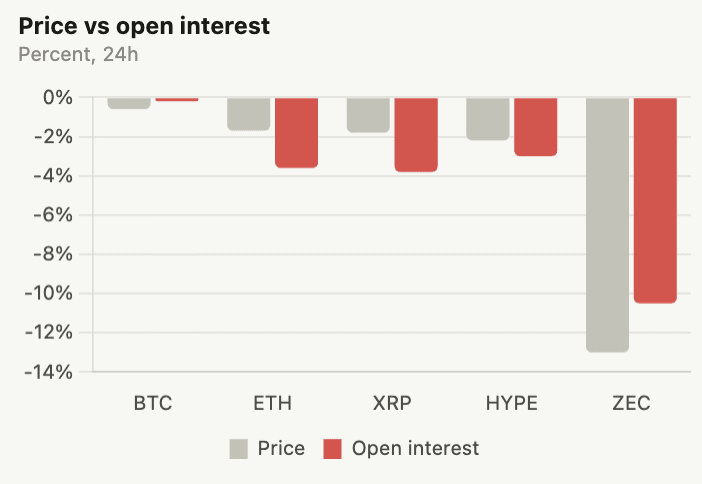
3. 📊 Macro Disconnect: Crypto Lags the Stock Rebound
While tech equities surged on strong corporate AI earnings, digital assets decoupled and stayed flat. Higher-than-forecast consumer price index (CPI) figures fueled speculation of tighter monetary policy, prompting institutional risk desks to temporarily curb exposure to volatile crypto assets.
• Why use it: Monitoring traditional equity indices (like the Nasdaq-100) helps traders spot divergences where crypto temporarily lags before catching up to macro trends.
[Insert Banner/Image: Split comparison chart highlighting Nasdaq futures rebounding upward while Bitcoin trades horizontally]
4. ⚡ Derivative Liquidations: Clearing Over-Leveraged Longs
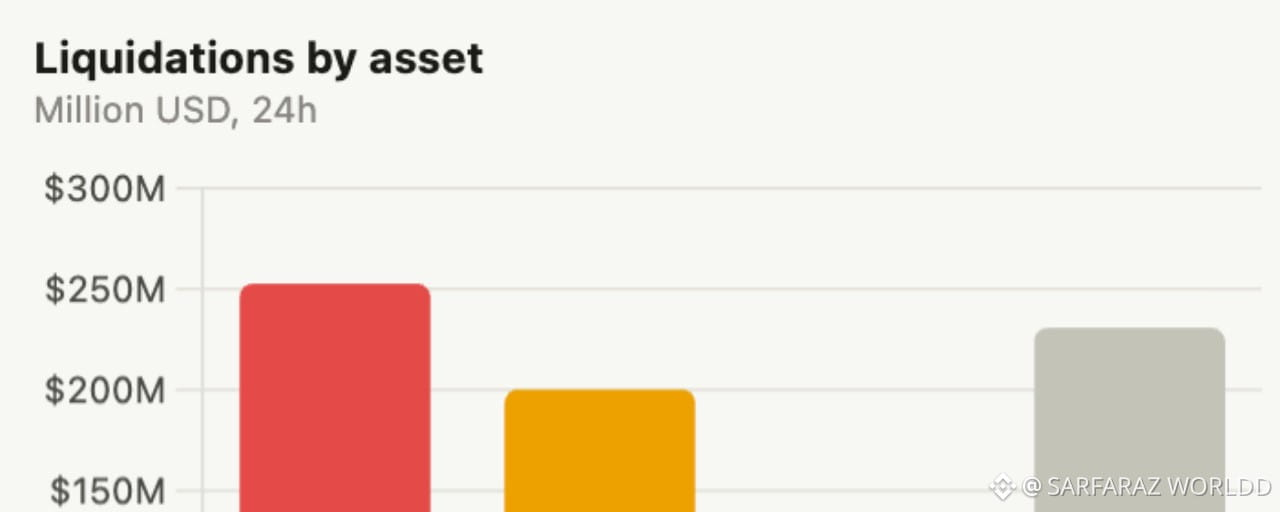
A spike in derivatives volatility triggered over $725 million in total crypto liquidations, with long positions bearing the vast majority of the wipeout. The wipeout flushed speculative froth out of perpetual contracts, cooling overheated funding rates and resetting market leverage.
• Pro-Tip: Always verify the taker buy/sell ratio and open interest after heavy cascades; cleaner leverage profiles create healthier setups for sustainable bounces.
[Insert Banner/Image: Coinglass liquidation heatmap illustrating the massive wipeout cluster around $73,000–$75,000]
5. 🛡️ Options Skew: The Defensive Smart Money Bias
In the options market, implied volatility hovers in the mid-to-high 30s, with downside put contracts continuing to trade at a distinct premium over upside calls. Professional institutional desks are actively buying downside portfolio insurance while keeping upside targets anchored between $81,000 and $84,000.
• Strategy: Utilize structured hedging or spot dollar-cost averaging (DCA) when the put-call skew indicates institutions are heavily hedged against near-term downside risk.
[Insert Banner/Image: Open interest distribution chart by strike price showcasing the dominant call peaks at $81,000 and $84,000]
6. 🌐 Market Dominance: Capital Rotates to Safety
Bitcoin market dominance expanded past 60.5% as capital rotated sharply out of speculative altcoins and privacy tokens back into major base assets. With the Altcoin Season Index drifting lower, traders are choosing Bitcoin liquidity as a defensive sanctuary during macro turbulence.
• 2026 Insight: Whenever macroeconomic uncertainty spikes, BTC dominance expansion serves as an early indicator to reduce exposure to low-cap high-beta altcoins.
[Insert Banner/Image: TradingView chart of Bitcoin Dominance (BTC.D) trending upward past 60.5%]
✅ Final Thoughts
Market corrections driven by macro reports and ETF redemptions test emotional discipline, but they are a standard part of market cycles. Surviving sideways chop requires proactive risk management, avoiding excessive leverage, and trusting well-defined support levels. Focus on long-term conviction over short-term noise.
Are you using this $74K consolidation to accumulate spot $BTC, or do you expect another sweep of the lows before a breakout? Drop your thoughts below!
BTCETH SOLBNB
#CryptoTrading #Bitcoin2026