

Bitcoin has gone through several major bull and bear markets, and there has always been one pattern that traders keep coming back to: the four-year cycle.
Every few years, Bitcoin goes through a strong rally, reaches a new high, and then enters a long correction. The timing has often been connected to Bitcoin halving events, when the amount of new BTC entering the market is cut in half.
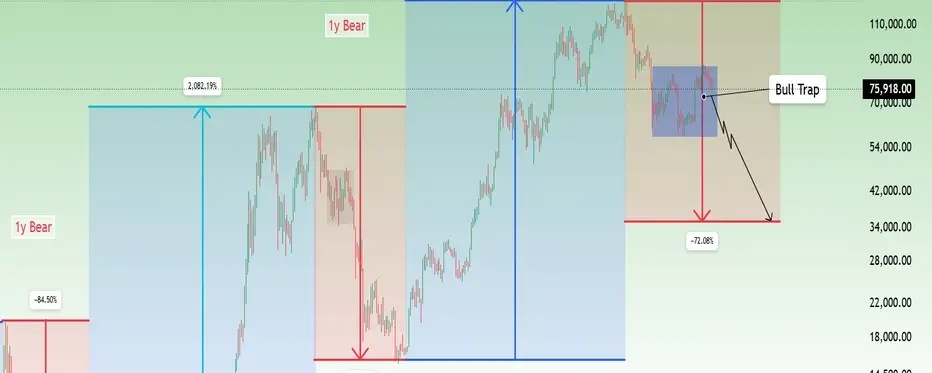
Looking at the weekly chart, the similarities between previous cycles are hard to ignore. But there is also something interesting happening: each cycle is becoming smaller in terms of percentage gains and losses.
Four cycle, one repeating pattern
The first major cycle shown on the chart started around 2015 and continued until the 2017 peak. Bitcoin gained nearly 11,900% during that bull run before entering a bear market that wiped out around 84.5% of its value.
The next major rally came between 2019 and 2021. This time, the gain was around 2,082%, followed by a correction of approximately 76.8%.
Then came the latest cycle, which started from the 2022 bear-market low and continued into the 2025 high. The rally was still impressive, but the gain was around 698%, much smaller than in previous cycles.
The chart now compares the current decline with the earlier bear markets. The projected drop is around 72%, which would bring Bitcoin close to the $35,000 area.
That is a historical comparison, not a confirmed price target. The market can follow a similar pattern without repeating the exact same numbers.
Why each cycle is getting smaller
Bitcoin was a much smaller market during its early cycles. It didn't take the same amount of money to push its price higher, and retail traders played a much bigger role.
Today, the situation is different. Bitcoin has spot ETFs, institutional investors and much stronger connections with traditional financial markets. The amount of capital needed to produce the same percentage move is now significantly larger.
There is also the effect of each halving becoming smaller over time. In 2012, around half of Bitcoin's total supply was still waiting to be mined. By the 2024 halving, roughly 94% of the total supply had already been issued.
This means each new halving reduces a smaller amount of the remaining supply. The supply shock is still part of Bitcoin's design, but its impact on the overall market is not the same as it was in the early years.
Wells Fargo's research also highlights this change. Its historical data shows that both the gains after halvings and the drawdowns after cycle peaks have become smaller.
Is the four-year cycle still reliable?
This is where things get interesting.
Historically, Bitcoin's major peaks have arrived roughly 12 to 18 months after a halving. The latest cycle reached its high in 2025, around 16 months after the April 2024 halving.
That fits the old pattern quite well. However, it doesn't mean Bitcoin must now follow the same correction schedule as 2018 or 2022.
Fidelity's research points to lower volatility and growing institutional participation as reasons why Bitcoin may behave differently in the future. More capital from ETFs and traditional investors could make the market less prone to the extreme rises and falls seen in earlier years.
But the four-year cycle hasn't necessarily disappeared either. The historical data still shows a recurring pattern, even if the size of each move is changing.
What the current chart is suggesting
Bitcoin is trading around $75,900 in the range marked on the weekly chart. The recent recovery has not been strong enough to reclaim the previous highs, and the area marked as a bull trap shows where buyers could get caught if the price fails to move higher.
The chart projects a possible decline toward $35,000, based on a correction similar to previous bear markets. The path could include several smaller recoveries along the way, rather than one continuous fall.
Whether Bitcoin reaches that level is another question entirely. ETFs, institutional demand, global liquidity and the next halving will all play a role in how this cycle develops.
Bitcoin's history gives us a useful way to understand its market cycles, but it doesn't give us a guaranteed roadmap. The pattern is still worth watching, especially now that the market is changing in ways we haven't seen in earlier cycles.
What If Bitcoin Enters Another Bear Market
Bitcoin has followed a four-year cycle in the past, but that doesn't mean the same pattern has to repeat every time. Still, looking at previous cycles, what if Bitcoin is heading towards another long bear market?
Does that mean we have to stop trading and wait for the next bull run? Not really. There are other markets too, and stocks can offer opportunities even when crypto is struggling.
Take AI stocks, for example. Anthropic, the company behind Claude AI, is one name worth following. On November 8, reports came out about a $3.4 billion deal for gas-fired power generators to support its growing data center needs. That's a big move as demand for Claude and other AI services keeps growing
Anthropic's upcoming IPO is another thing to keep an eye on. Getting an allocation in a major IPO is not always easy for regular investors through traditional channels. I have used Bitget IPO Prime during the SpaceX round, and now Anthropic is available there too. I'm considering starting with $100 in USDT when the public round opens on November 10.
My point is, even if Bitcoin enters another bear market, we don't have to sit out completely. There are opportunities beyond crypto, and it's worth keeping an eye on them too.
#TheBillionaireTrades #TheBillionaireTradesMarketInsights
