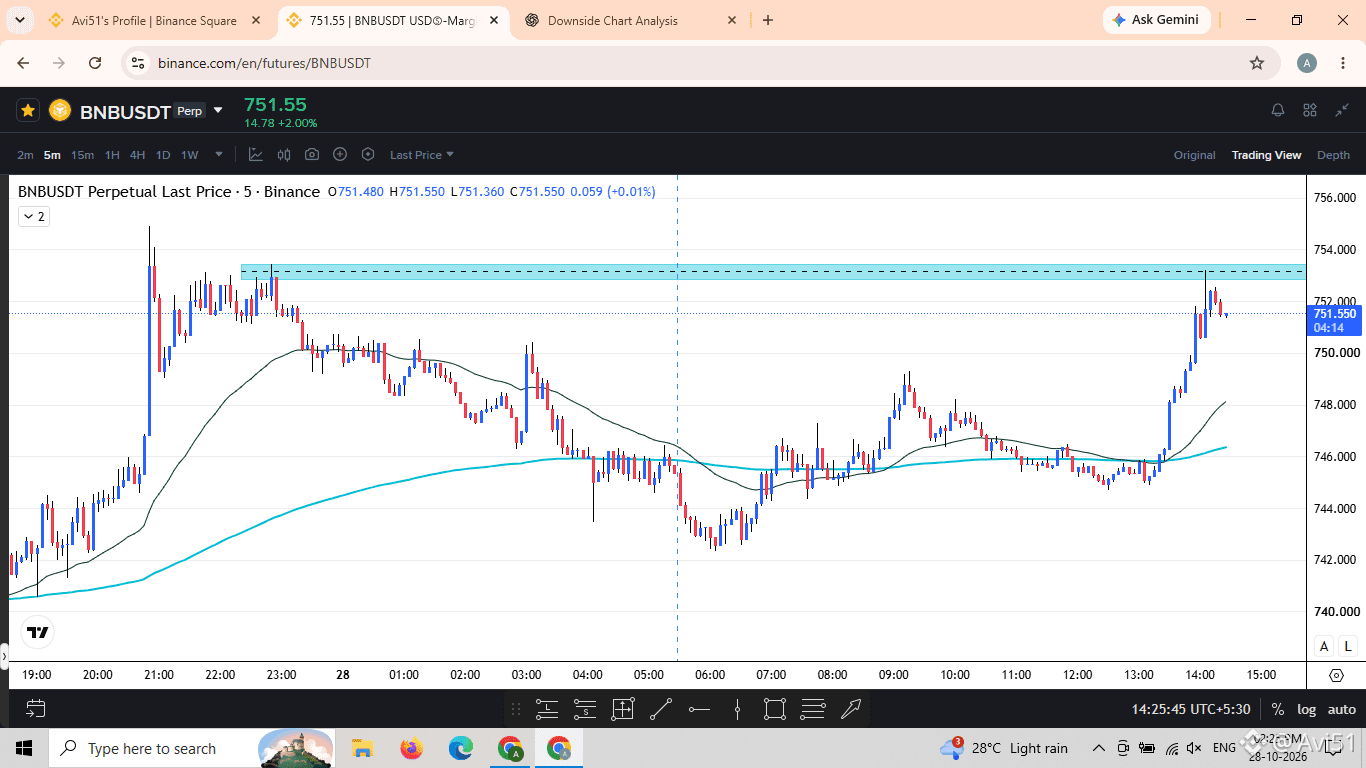
📊 $BNB USDT Chart Analysis — 5-Minute Timeframe
Current Price: $751.55
Market Direction: Short-term bullish, approaching strong resistance ⚠️
Setup: Potential rejection or bullish breakout
the $753–$754 resistance zone is the key level to watch.
🟢 Bullish signal: Price is holding above the moving averages after a strong rally.🔴 Bearish signal: Rejection near $753–$754 could trigger a short-term pullback.📈 Resistance: $752.50–$754.00.📉 Support: $750.00, $748.00, and $746.00.
SELL Setup
Entry zone: $752.50–$753.50 after bearish confirmationStop-loss: $754.30Target 1: $751.00Target 2: $750.00Target 3: $748.00
BUY Setup
Entry: After a confirmed breakout and successful retest above $754Stop-loss: Below the retest lowPotential targets: $755 and $756
If buyers break above $754 with strong volume, we could see further upside toward $755–$756.
However, if the price gets rejected at resistance, a pullback toward $750 or even $748 could follow.
My focus is on confirmation rather than chasing the pump. Let the price action decide the next move.
⚠️ Manage risk carefully, especially on the 5-minute timeframe.
#BNB #BNBUSDT #CryptoTrading #TechnicalAnalysis