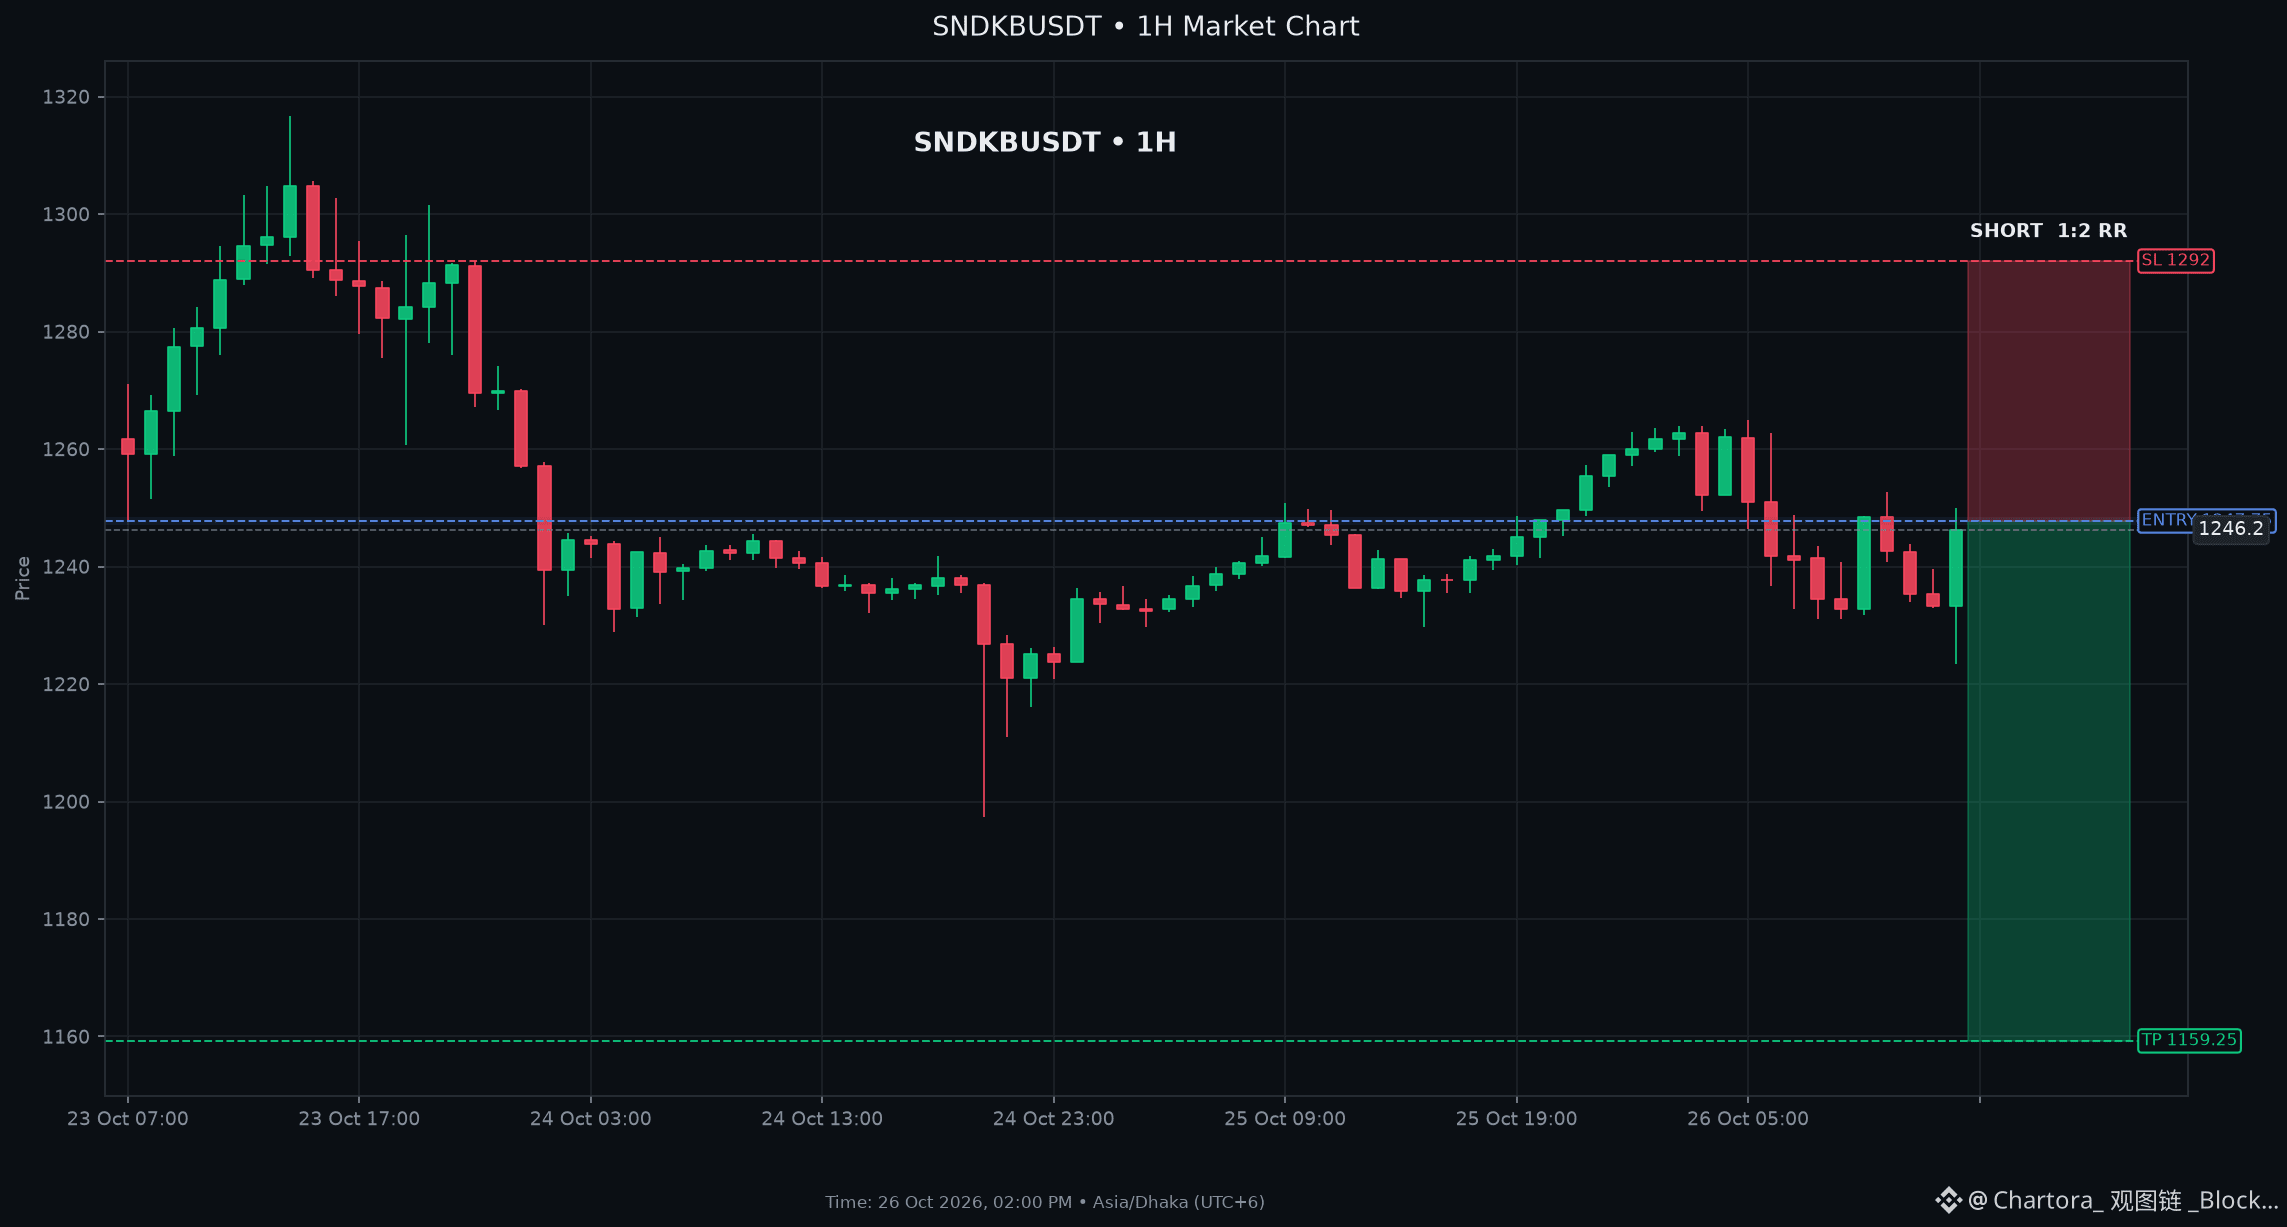
$SNDKB : Bearish Divergence Spotted on Downside Targets Ahead
SHORT SETUP SNDKB
Entry: $1247.00 - $1248.50
Stop Loss: $1292.00
Take Profit: $1159.25 (2R)
Key Levels: Support $1232.06 | Resistance $1264.00
Technical Analysis for $SNDKB : MACD shows a negative histogram and a MACD line below its signal, indicating bearish momentum. Price sits under the EMA50 (1248) and far beneath the EMA200 (1302), while still above shortterm EMAs, suggesting a downtrend pressure. Orderbook imbalance is -3.4%, and RSI hovers around 51. These factors favor a short bias near the 1248 resistance zone.
Market Context: BTC is modestly bullish (+0.39%) and the broader market shows a 63.8% green breadth, providing overall positive sentiment.
SHORT $SNDKB