

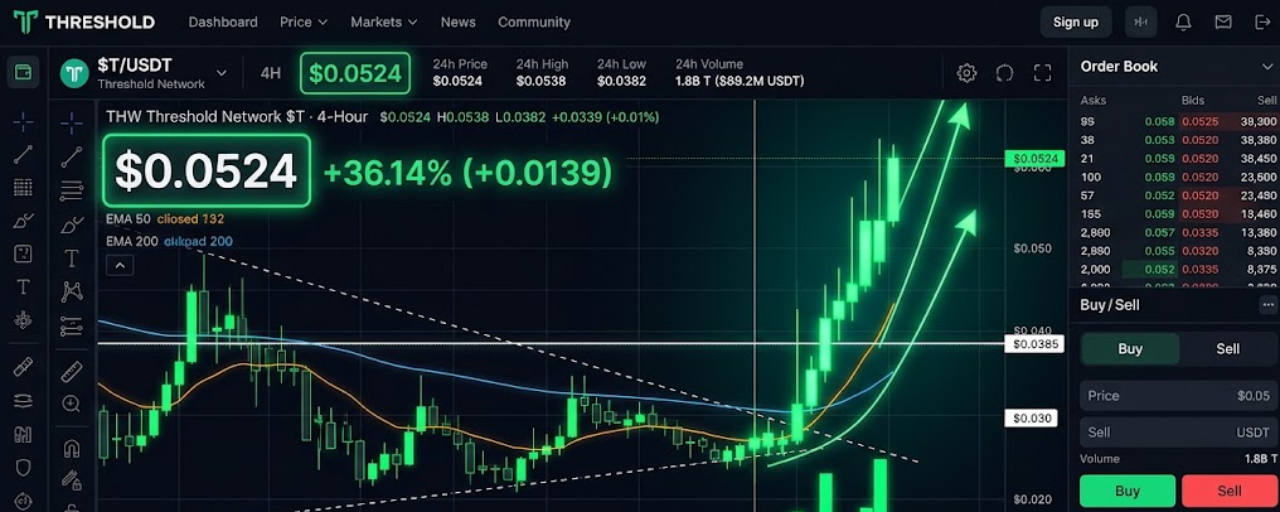

🔥 Threshold Network ($T ) is showing powerful momentum, but traders need to be careful.
The token has surged approximately 36.8% in 24 hours, reaching around $0.00632, after hitting a reported high of $0.00791. Trading activity has been strong, but recent candles show that sellers have entered after the sharp rally.
So, is $T preparing for another breakout — or are late buyers at risk?
📊 1. Market Snapshot
Trading pair: T/USDT
Latest retrieved price: $0.00632
24-hour change: +36.8%
24-hour high: $0.00791
24-hour low: $0.00450
24-hour trading volume: Approximately $12 million in USDT terms
Market data can change quickly. Check Binance before placing any trade.
📈 2. Technical Analysis: Bullish Momentum, Rising Risk
The rally shows strong buying interest, but a large daily gain does not guarantee further upside.
Recent 15-minute candles show a pullback from the $0.0074 area toward $0.0063. Buyers will need to defend support and reclaim nearby resistance before another upward move becomes convincing.
Key support zones
$0.00610–$0.00620: Near-term support to watch.
$0.00585–$0.00595: Lower support if selling pressure increases.
$0.00550: A deeper downside level to monitor if the pullback continues.
Key resistance zones
$0.00660–$0.00680: First recovery hurdle.
$0.00700–$0.00715: Important short-term resistance.
$0.00745–$0.00790: Higher resistance near the recent rally highs.
These are chart-based zones, not guaranteed turning points.
🎯 3. Possible Spot Trading Plan
Scenario A — Bullish continuation
Wait for a 15-minute candle to close above $0.00680, followed by a successful retest that holds as support.
Potential entry: $0.00665–$0.00680 after confirmation
Stop-loss: Around $0.00630
Target 1: $0.00710
Target 2: $0.00745
Target 3: $0.00780, only if momentum remains strong
This setup is invalid if price breaks down and fails to reclaim the support area. The entry range is conditional; do not buy simply because the price touches it.
Scenario B — Deeper pullback
If $T loses $0.00610 and a 15-minute candle closes below that level, avoid rushing into a dip-buy. Watch whether price stabilizes near $0.00590 or forms a new recovery structure.
My verdict: Cautiously bullish only if buyers reclaim resistance. Without confirmation, the risk of a deeper pullback remains high.
⚠️ 4. The Biggest Risk: FOMO
A coin that rises sharply can reverse just as quickly. Thin liquidity, profit-taking, and sudden changes in market sentiment can create rapid price swings.
Do not chase a large green candle. If the setup is unclear, staying out is a valid trading decision.
🧠 Final Take
$T is one to watch, but the next move depends on whether buyers can defend support and reclaim resistance.
📈 Breakout confirmation: Potential continuation
📉 Support failure: Pullback risk increases
⏳ No confirmation: Wait
What do you think — will $T reclaim $0.0070, or will sellers push it lower first? 👇
#Binance #Crypto #ThresholdNetwork #TToken #Altcoins #TechnicalAnalysis #CryptoTrading
Disclaimer: This is market analysis for educational purposes, not financial advice. Cryptocurrency trading involves significant risk; always manage your position size and never risk money you cannot afford to lose.