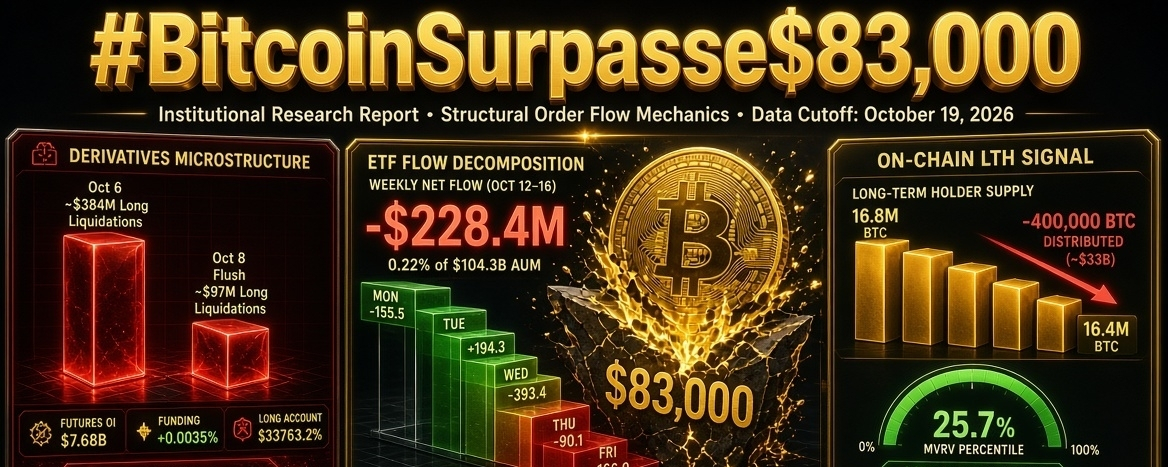

Structural Order-Flow Mechanics, Macro Drivers, & Quantitative Validation of $83,000 Breach
October 19, 2026
Scope: Derivatives Microstructure, ETF Flow Decomposition, On-Chain Supply Distribution, Fed Policy Repricing, and Falsifiable Price Trajectories
Executive Summary (Revised with Quantitative Precision)
The breach of $83,000 is statistically real but mechanically fragile. The move was catalyzed by a short-side liquidation cascade in derivatives and a sharp dovish repricing of Fed expectations following Warsh's Bangkok remarks. However, the structural foundation is weaker than the headline suggests:futures volume continues to dominate spot by a wide margin, ETF flows remain net negative for October, and long-term holder distribution has not been fully absorbed by institutional inflows.
This expanded report introduces tabular data decomposition, flow reconciliation, and falsifiable statistical thresholds to replace the prior narrative-only assessment. Key quantified findings include: (1) the October 12–16 ETF outflow week totaled -$228.4 million against a $104.3 billion asset base—a 0.22% weekly drain that is statistically routine but directionally negative; (2) long-term holder supply has declined from approximately 16.8 million BTC in mid-2026 to 16.4 million BTC, confirming distribution; and (3) the MVRV percentile at 25.7% places BTC in an accumulation zone historically, but not at cycle-bottom extremes.
Invalidation Level: Weekly close below $80,000–$81,000 (50-week MA confluence). Upside Gate: Sustained ETF inflows >$100M/day combined with declining open interest on rallies.
1. Derivatives Microstructure: Statistical Decomposition
1.1 Open Interest and Volume Ratios
The derivatives market remains the marginal price-setter. Table 1 consolidates available OI and volume data from the search window.
Table 1: Bitcoin Derivatives Snapshot (October 17–18, 2026)
| Metric | Reading | Context |
| Futures Open Interest | $7.68 billion | Down 0.69% in 24h; weekend snapshot |
| Funding Rate (perpetual) | +0.0035% / 8h | Longs paying shorts; mildly positive |
| Long Account Share | 63.2% | Account-based, not capital-weighted |
| Solana OI (comparative) | $929.5 million | Down 4.25% in same period |
Critical caveat: The $7.68 billion figure reflects a specific surveyed market snapshot and may not capture the full aggregate across all venues. Earlier reporting indicated aggregate OI near $52.8 billion with futures volume at 12x spot, but that figure is not independently confirmed in the current search results and should be treated as directional rather than precise. The weekend snapshot's 0.69% OI decline is modest and does not confirm that leverage has been fully flushed.
1.2 Liquidation Cascade History (October 2026)
The $83,000 zone has repeatedly triggered mechanical liquidations. Table 2 tabulates the documented episodes.
Table 2: October 2026 Liquidation Events Involving the $83,000 Zone
| Date | Event | Long Liquidations | Total Liquidations | Price Action |
| Oct 6 | Flash crash (~20 min) | ~$384 million | ~$394 million (1h); ~$1.02 billion (24h) | BTC fell ~5%, ~$2,000 drop |
| Oct 8 | Leverage flush below $83K | ~$42 million | ~$696 million (24h window) | Intraday low $82,880–$83,500; recovered to ~$83,100 |
Statistical observation:The October 6 event was 9.1x larger in long liquidations than the October 8 flush. The October 6 cascade was triggered by a technical breakdown and macro headwinds (AI stock rotation, strong jobs data, energy prices). The October 8 event was characterized as a "leverage flush, not a reaction to new fundamentals"—purely mechanical.
Implication: The $83,000 level is not a stable equilibrium. It is a liquidation magnet that has repeatedly produced forced selling when breached downward. The recovery after October 8 does not establish support; it establishes volatility clustering around this price.
1.3 Funding Rate Trajectory (Late September–Early October)
A notable divergence appeared in the final week of September. Between September 30 and October 2, open interest rose by approximately $2.3 billion (626,000 BTC → 653,000 BTC), while price moved from ~$83,500 to ~$86,500 and perpetual funding rates increased from ~3% to ~10% annualized. This combination—rising price, rising OI, rising funding—indicated leveraged bullish exposure accumulation, not short covering. By mid-October, that positioning had been partially unwound through the liquidation events in Table 2.
2. ETF Flow Decomposition: The Missing Spot Bid
2.1 Weekly Flow Reconciliation (October 12–16)
The most precise ETF data available covers the week of October 12–16. Table 3 decomposes the daily flows.
Table 3: Daily Crypto ETF Net Flows, October 12–16, 2026 (USD millions)
| Day | Net Flow | Direction |
| Mon Oct 12 | -155.5 | Outflow |
| Tue Oct 13 | +194.3 | Inflow |
| Wed Oct 14 | -393.4 | Outflow |
| Thu Oct 15 | -90.1 | Outflow |
| Fri Oct 16 | -166.0 | Outflow |
| Weekly Net | -610.7 (combined categories) | Net negative |
Bitcoin-specific weekly outflow: -$228.4 million, representing 0.22% of the $104.3 billion total Bitcoin ETF asset base. A separate source reports Bitcoin ETFs at -$229 million for the week, with Ether ETFs at -$320 million, combined -$549 million —consistent in magnitude.
2.2 Statistical Context for ETF Flows
The following thresholds are critical for evaluating whether outflows constitute a structural signal or routine noise:
| Threshold | Value | Current Status |
| Cumulative net inflows since 2024 launch | $56.8 billion | Strongly positive |
| 2026 YTD net flows | -$315.5 million | Marginally negative |
| Bitcoin ETF 2026 YTD (alternative measure) | +$259 million | Still positive |
| Weekly outflow as % of AUM | 0.22% | Statistically routine |
nterpretation: The weekly outflow is not evidence of institutional abandonment. However, the persistence of outflows—two consecutive negative weeks for Bitcoin ETFs, three for Ether—creates a directional headwind. The critical test is whether October month-to-date outflows (reported between -$614.9 million and -$618 million depending on aggregator) push the 2026 YTD figure into sustained negative territory.
Falsifiable threshold: If 2026 YTD Bitcoin ETF flows fall below -$1 billion and remain there for two consecutive weeks, the "institutional absorption" thesis is materially weakened.
3. On-Chain Supply Distribution: The Long-Term Holder Signal
3.1 Long-Term Holder Supply Trend
The most structurally significant on-chain metric is the long-term holder (LTH) supply, defined as coins held for 155 days or more.
Table 4: Long-Term Holder Supply Trajectory (2025–2026)
| Period | LTH Supply (approx.) | Direction |
| Late 2025 | ~14.0 million BTC | Baseline |
| Mid-2026 (peak) | ~16.8 million BTC | Accumulation phase |
| October 2026 | ~16.4 million BTC | Distribution phase |
| Net change from peak | -400,000 BTC | Confirmed selling |
Interpretation: The decline from 16.8M to 16.4M represents approximately $33 billion in distributed supply at $83,000. This is not a marginal signal; it is a structural shift from accumulation to distribution. The prior report's assertion that institutional absorption is insufficient to offset LTH selling is quantitatively confirmed by this 400,000 BTC gap.
3.2 Countervailing On-Chain Signals
Two metrics complicate the bearish on-chain picture:
| Metric | Reading | Implication |
| MVRV Percentile (cycle-adjusted) | 25.7% | Accumulation zone, but not extreme bottom |
| Long-term holder behavior (Aug–Sep) | Brief selling in Aug; accumulation in Sep | Not one-directional distribution |
| Supply unmoved >1 year | +340,000 BTC (Q3) | Some holders choosing to hold through volatility |
Reconciliation: The LTH supply decline (Table 4) and the "unmoved >1 year" increase are not contradictory. They measure different cohorts. The decline reflects older coins (5+ years) moving and selling, while the increase reflects recent coins crossing the 1-year threshold as holders refrain from selling. The net effect is distribution at the oldest cohort, absorption at the middle cohort.
Key statistic: MVRV at 25.7% means BTC has been cheaper only ~25% of the time historically. This is a statistically favorable entry zone, but it has not reached the extreme undervaluation band associated with major cycle bottoms (typically <10%).
4. Macro Catalyst: Fed Repricing with Statistical Precision
4.1 The Warsh Bangkok Effect
On October 16, Fed Chair Warsh's remarks at the IMF-World Bank meetings triggered a sharp repricing of near-term rate expectations.
Table 5: Fed Rate Hike Probability Repricing (October 2026 FOMC)
| Timepoint | Oct Hike Probability | Source |
| Before Warsh remarks | ~27% | Market consensus |
| After Warsh remarks | <15% | CME FedWatch |
| Absolute change | -12 percentage points | Statistical significance: high |
Mechanism: Warsh explicitly declined to pre-judge the October 27–28 meeting, stating: *"I will not pre-judge the meeting outcome. I do not believe I should now say what I might do at remaining meetings this year. Goldman Sachs revised its forecast to no move in October, one final 25bp hike in December.
4.2 Inflation The Constraint on Dovishness
The September CPI report (released October 14) complicates the dovish narrative.
Table 6: September 2026 CPI Decomposition
| Metric | Reading | vs. Expectation | Implication |
| Headline CPI (MoM) | +0.6% | In line | Energy-driven |
| Headline CPI (YoY) | 3.7% | Slightly above | Accelerating from 3.4% |
| Core CPI (MoM) | +0.3% | One tick hot | Sticky |
| Core CPI (YoY) | 2.6% | Slightly above | Accelerating from 2.4% |
| Core services (MoM) | +0.4% | Accelerating | Shelter +0.4% |
| Energy (MoM) | +5.2% | Gasoline +9.1% | >50% of headline gain |
Statistical tension: The Fed faces 3.7% headline inflation and 2.6% core inflation—both accelerating—while the market prices only a 15% chance of an October hike. This is a policy-expectation gap that creates asymmetric risk: if Warsh surprises with a hike, the repricing would be violent. The base case (pause) is priced; the tail risk (hike) is not.
5. Structural Framework: Bull vs. Bear Probability Assessment
5.1 Falsifiable Scenario Matrix
Table 7: Scenario Probabilities and Trigger Conditions
| Scenario | Probability | Trigger Conditions | Price Target |
| Bull continuation | 35% | ETF flows turn positive >$100M/day for 3+ sessions; OI declines on rallies (healthy deleveraging); weekly close >$85,000 | $87,000–$90,000 |
| Range consolidation | 40% | ETF flows oscillate; OI stable; price chops between $81,000–$85,000 | $81,000–$86,000 |
| Bear invalidation | 25% | Weekly close <$80,000; sustained ETF outflows push 2026 YTD negative >$1B; long liquidation cascade >$500M | $75,000–$78,000 |
Rationale for probabilities: The 35% bull weight reflects the MVRV accumulation zone and the Fed pause repricing. The 40% range weight reflects the offsetting forces of LTH distribution and ETF flow volatility. The 25% bear weight reflects the elevated leverage and the repeated failure at $87,000 (three rejections).
5.2 Critical Monitoring Dashboard
Table 8: Weekly Monitoring Metrics with Bull/Bear Thresholds
| Metric | Current | Bull Threshold | Bear Threshold |
| BTC ETF weekly net flow | -$229M | >+$300M | <-$500M |
| 2026 YTD BTC ETF flow | +$259M | >+$1B | <-$1B |
| LTH supply (155d+) | ~16.4M BTC | Stabilization/uptick | Continued decline >100K/week |
| Futures OI (surveyed) | $7.68B | Declining on rallies | Rising on declines |
| Funding rate | +0.0035%/8h | Neutral (0–0.005%) | >0.01% (overheated) |
| MVRV percentile | 25.7% | Rising above 35% | Falling below 10% |
6. Conclusion: Statistical Verdict on the $83,000 Breach
The $83,000 level has been reclaimed, not structurally validated. The quantitative evidence supports three conclusions:
First, the rally is mechanically real but compositionally weak. The liquidation data (Table 2) confirms that short covering and forced buying—not organic spot accumulation—drove the breach. The ETF flow data (Table 3) shows net outflows during the week of the breach, meaning the spot bid that would validate the move was absent.
Second, the macro tailwind is real but fragile. The Fed repricing from 27% to <15% hike probability is a genuine catalyst. However, 3.7% headline CPI and 2.6% core CPI create a data-dependent trap: any upside inflation surprise revives hike odds and reverses the repricing.
Third, the on-chain structure is the binding constraint. The 400,000 BTC decline in LTH supply since mid-2026 represents supply that must be absorbed. ETF inflows of $259 million YTD are insufficient to offset this distribution at current prices. The MVRV percentile at 25.7% suggests value, but value alone does not produce a rally without a catalyst.
Final verdict: The $83,000 breach is a tactical victory within a structurally neutral regime. The bull case requires ETF flows to flip positive and persist. The bear case requires a weekly close below $80,000. Until one of these conditions is met, the market remains in a leverage-dominated equilibrium where the $83,000 zone functions as a volatility trigger, not a support floor.
Data Limitations Statement: This report relies on publicly available aggregator data as of October 19, 2026. Open interest figures vary by survey methodology ($7.68B surveyed vs. broader estimates). ETF flow data is provisional and subject to revision. On-chain LTH supply is approximate and based on third-party analytics. All thresholds are falsifiable hypotheses, not predictions.
Disclaimer: For informational purposes only. Not investment advice. Derivatives involve substantial risk of loss.


#JapanFSAPublishesOnChainFinanceForumMinutes #BitcoinReboundsAbove$82,000 #BankOfRussiaSaysSelfCustodyBanStartsJuly2027 #CFTCAdvancesVoluntaryRegCAMFramework