


🚀 NIL/USDT Complete Technical Analysis – October 16, 2026
📊 Current Market Overview
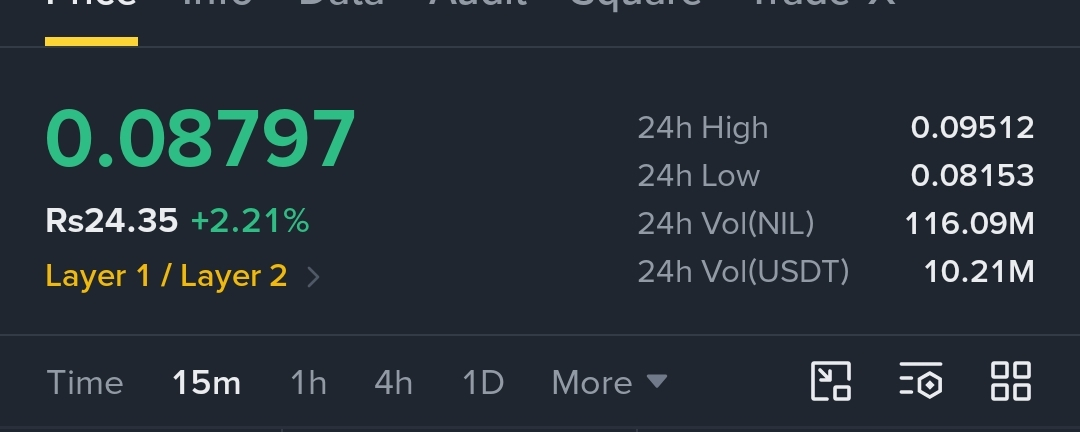
$NIL (Nillion) is currently trading at 0.08797 USDT, showing a 24-hour gain of 2.21%. The token has experienced significant volatility, reaching a high of 0.09512 USDT and a low of 0.08153 USDT.
The 15-minute chart indicates that NIL is recovering after a sharp decline. Buyers are attempting to regain control, but the price is approaching an important resistance zone that could determine the next short-term move.
📈 Technical Analysis
Moving Averages (15-minute chart):
MA(7): 0.08679
MA(25): 0.08627
MA(99): 0.08730
The current price is above all three moving averages, suggesting improving short-term momentum. The MA(7) is above the MA(25), indicating a potential bullish recovery. However, continued buying pressure is needed to confirm a stronger upward trend.
Support Levels:
Immediate support: 0.0870–0.0863
Secondary support: 0.0838–0.0830
Major support: 0.08153
Resistance Levels:
Immediate resistance: 0.0885–0.0890
Strong resistance: 0.0898–0.0900
Major resistance: 0.0928–0.09512
🐂 Bullish Scenario
If NIL maintains support above 0.0870 and breaks through 0.0890 with strong trading volume, the price could move toward 0.0900. A sustained breakout above that level may open the way toward 0.0928 and potentially retest the recent high of 0.09512.
🐻 Bearish Scenario
If buyers fail to defend the 0.0870 area, NIL could pull back toward 0.0863. Further weakness may expose the 0.0838 support zone. A breakdown below 0.08153 would signal renewed selling pressure and increase downside risk.
📉 Volume and Market Sentiment
The chart shows increased trading activity during the earlier price spike and subsequent decline. Recent recovery candles suggest renewed buying interest, but volume remains important. A breakout without stronger volume could fail, while increased volume accompanying a resistance break would provide better confirmation.
🎯 Trading Strategy
Bullish entry idea: Consider only after a confirmed breakout above 0.0890, preferably followed by a successful retest.
Pullback idea: Watch the 0.0870–0.0863 support zone for signs of stabilization.
Risk management: Set a stop-loss according to your entry, risk tolerance, and nearby support levels.
Profit-taking zones: Monitor 0.0900, 0.0928, and 0.09512 as potential resistance targets.
These are conditional scenarios, not guaranteed trading signals. The chart covers a short 15-minute timeframe, so it cannot establish the longer-term trend on its own.
🔥 Final Verdict
NIL/USDT is showing a short-term bullish recovery, but confirmation is still needed. Holding above 0.0870 and breaking 0.0890 could strengthen the bullish outlook. Losing nearby support could trigger another pullback.
Trade carefully, watch volume, and avoid chasing sudden price movements. Always manage risk before entering a position.
#NIL #Nillion #CryptoAnalysis #TechnicalAnalysis #BinanceSquare #CryptoTrading #Altcoins👀🚀