

# ARB Analysis — 4-Hour Timeframe (4H)
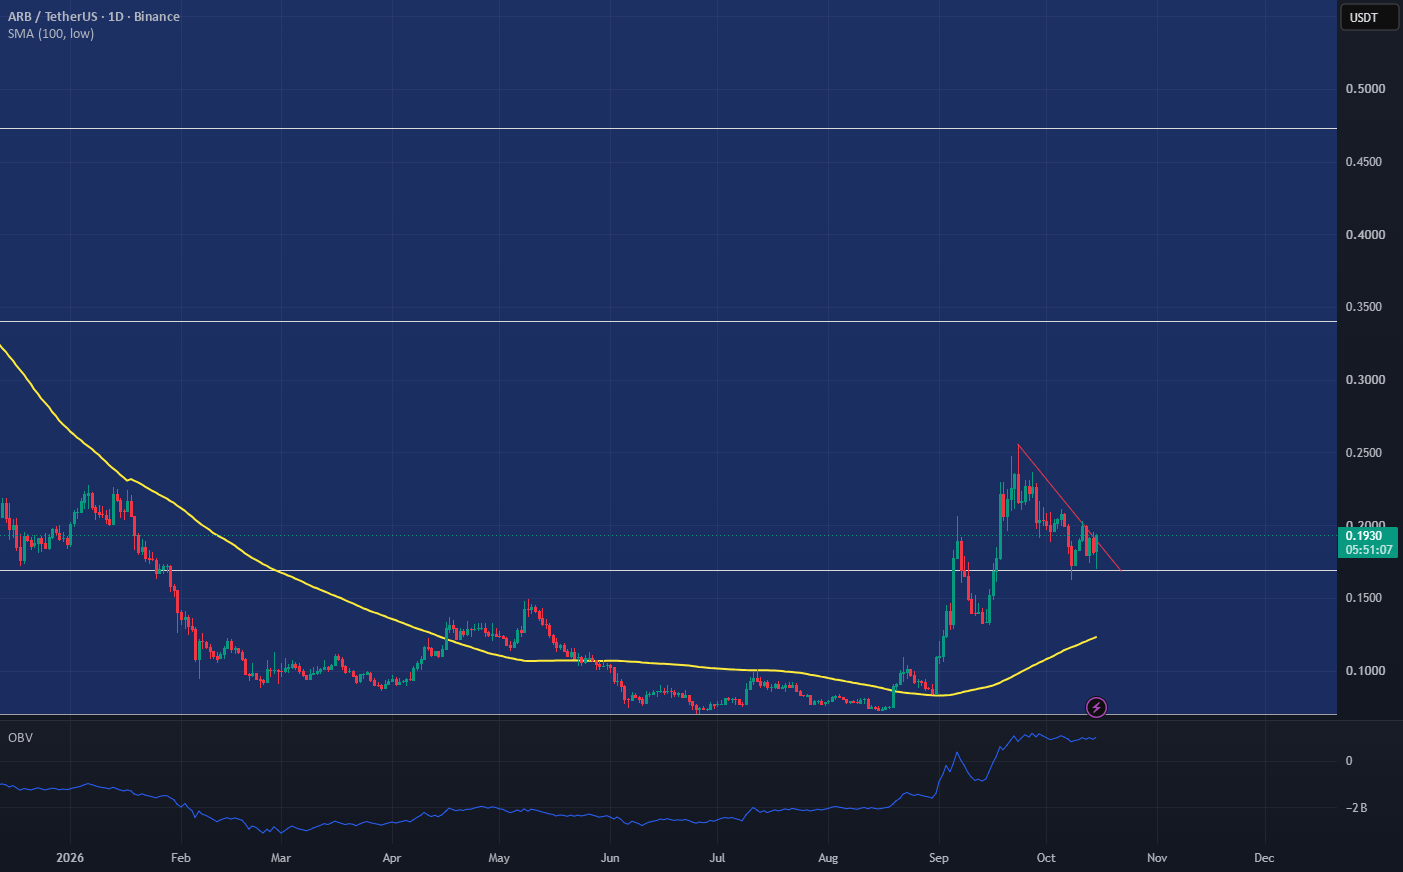
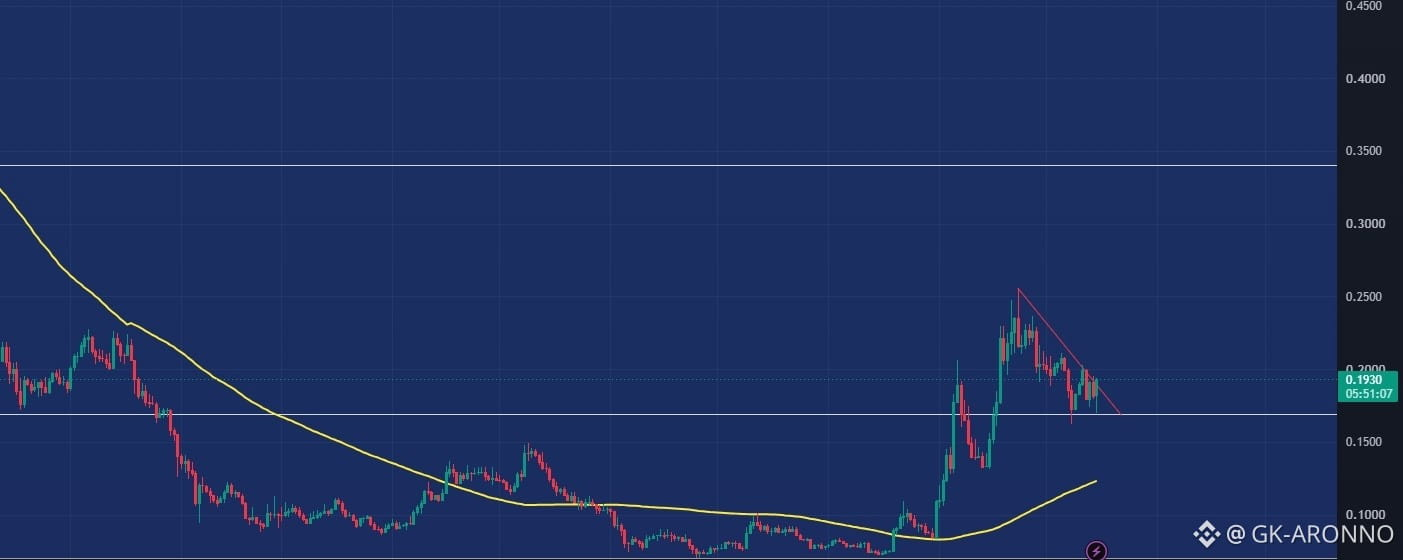
Based on the chart provided, ARB is trading near $0.1922 USDT, with price compressing beneath a descending trendline. The 100-period simple moving average (SMA 100) is around $0.1906, making the current area an important short-term decision zone. A confirmed breakout could open the way toward the next resistance zones.
**Current price:** $0.1922 USDT
### Key Price Ranges and Potential Targets
| Price Range | Potential Target After Breakout |
|---|---:|
| $0.16 – $0.22 | $0.22 |
| $0.22 – $0.34 | $0.34 |
| $0.34 – $0.47 | $0.47 |
| $0.47 – $0.55 | $0.55 |
### Bullish Scenario
If ARB holds above the $0.16–$0.17 support area and breaks above the descending trendline with a clear 4-hour candle close above $0.22, the price could move toward $0.34. A sustained breakout above $0.34 could then expose the $0.47 zone.
The rising OBV trend visible in the lower panel may indicate improving buying pressure, although it does not confirm a breakout on its own.
### Bearish Scenario
If ARB is rejected by the descending trendline and loses the $0.19 area, the price could retest support around $0.17–$0.16. A clear breakdown below $0.16 would weaken the bullish setup and increase the risk of further downside.
### Conclusion
ARB is approaching a key decision point on the 4-hour timeframe. The price is trading close to its 100-period SMA while remaining beneath a descending trendline. A confirmed breakout above $0.22 could improve the outlook and open the way toward $0.34, followed by $0.47. However, failure to hold support around $0.16–$0.17 would invalidate the immediate bullish scenario.
Trading volume, OBV behavior, and 4-hour candle closes will be important for confirmation.
*These levels represent potential scenarios, not guaranteed outcomes. This analysis is based on the provided chart and is not financial advice.*