

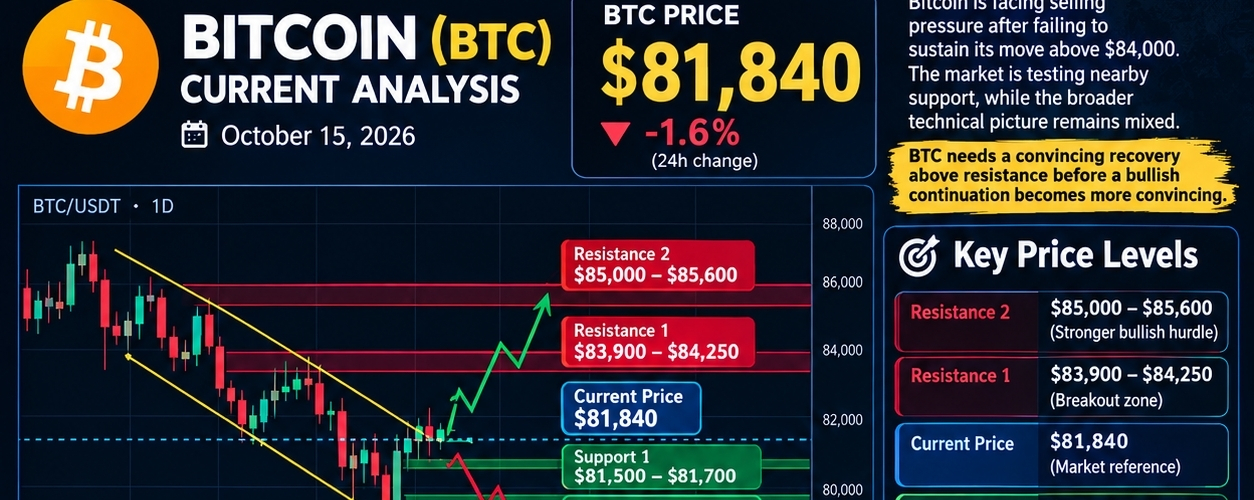

Bitcoin (BTC) Current Analysis — October 15, 2026
Piaţa cripto la un nou punct de cotitură: Prăbuşirea bitcoin sub 90.000 de dolari...
Bitcoin (BTC/USD)
$81,840
Latest reported price · October 15, 2026
Short-term bearish pressure
24-hour change: approximately −1.6%
Bybit
Bitcoin is facing selling pressure after failing to sustain its move above $84,000. The market is testing nearby support, while the broader technical picture remains mixed. BTC needs a convincing recovery above resistance before a bullish continuation becomes more convincing.
Bybit
+1
1. Key price levels
Level
Price (USD)
Importance
Resistance 2
$85,000–$85,600
Stronger bullish hurdle
Resistance 1
$83,900–$84,250
Breakout zone
Current price
$81,840
Market reference
Support 1
$81,500–$81,700
Immediate support
Support 2
$80,900–$81,000
Next downside area
Support 3
Around $78,100
Deeper correction zone
These are approximate technical levels based on recent market reports, not guaranteed turning points.
Bybit
+1
2. BTC chart outlook
Short-term scenario
Bearish pressure
BTC key levels
Illustrative price zones based on recent October 2026 technical reports, not live candle data.
Resistance 1
BTC price
$84K
$80K
$82K
$84K
$86K
Support 2
Current
Resistance 2
Illustrative level comparison; not a live trading chart.
3. What could happen next?
Bullish scenario
If BTC breaks above $84,000–$84,250 and holds that zone, the next areas to watch are $85,000–$85,600 and potentially $86,000. Confirmation from trading volume would strengthen this scenario.
Bitcoin News
+1
Bearish scenario
If BTC loses $81,500 and fails to recover, watch $80,900 and then the $80,000 area. A deeper decline could bring the $78,000 region into focus$BTC
