
TRON (TRX) — Today’s Market Analysis | October 6, 2026
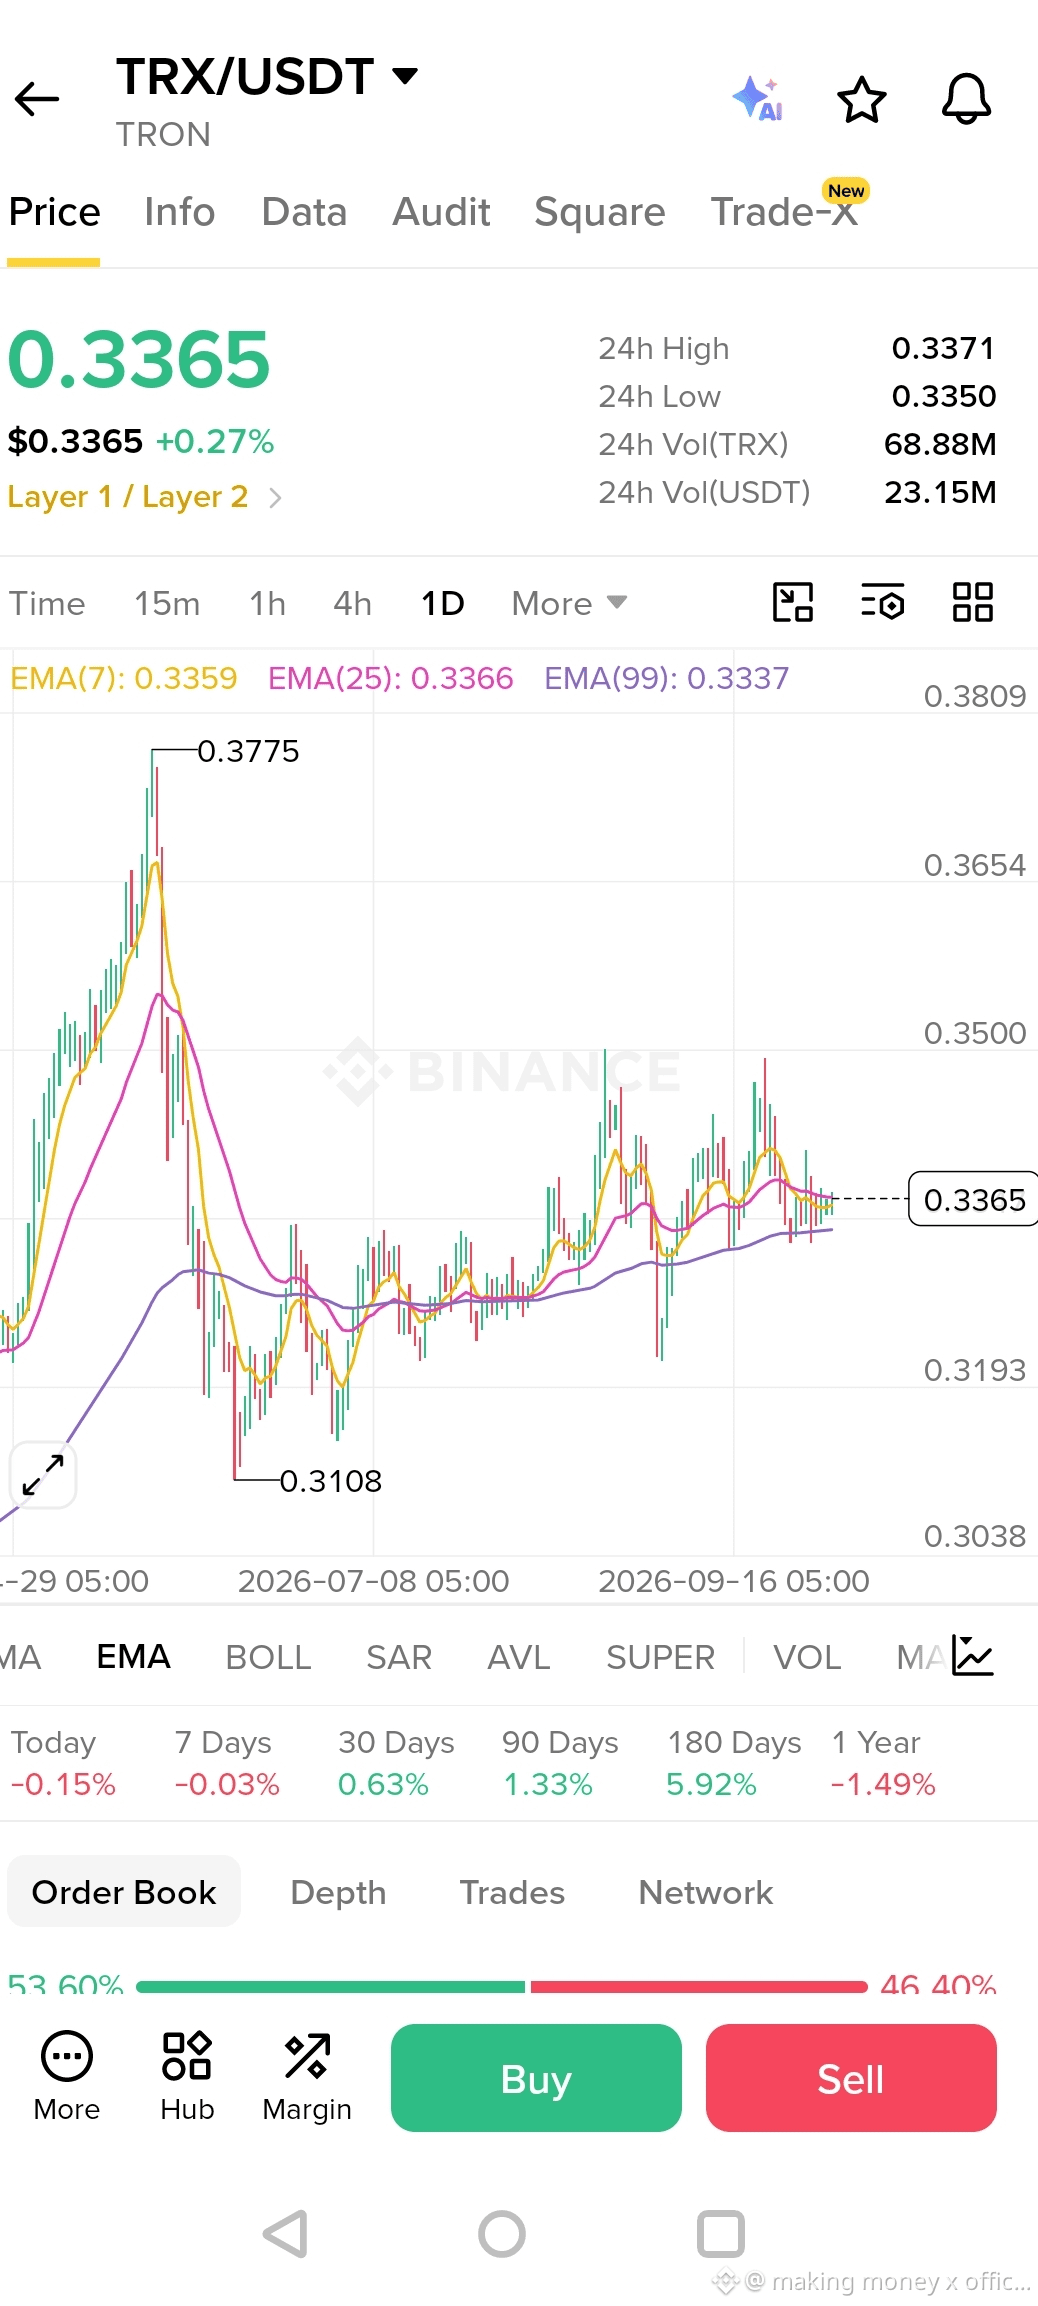
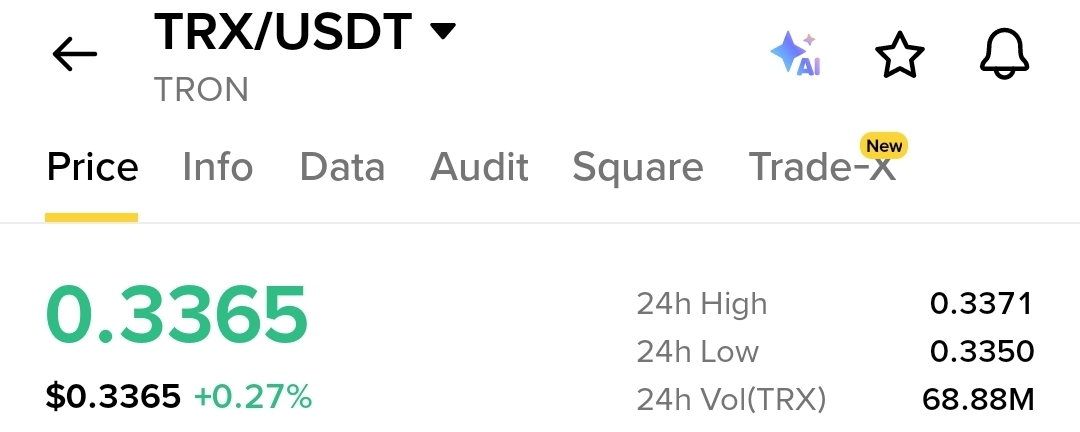
TRX/USDT: $0.3365
TRON (TRX) is showing a period of tight consolidation around the $0.335–$0.337 area. Current market data places TRX near $0.336, with the 24-hour range around $0.3349–$0.3369.
📊 Technical Analysis
On the 1D chart from the provided setup:
EMA 7: 0.3359
EMA 25: 0.3366
EMA 99: 0.3337
Immediate Support: $0.3340–$0.3350
Major Support: $0.3290–$0.3300
Key Resistance: $0.3400–$0.3420
Major Resistance: $0.3490–$0.3500
Higher Resistance: $0.3650
TRX has been moving in a relatively narrow range recently. Recent daily data also shows repeated trading around the $0.334–$0.340 region, confirming the current consolidation structure.
🔥 Market Fundamentals
TRON continues to have significant stablecoin activity on its network, with recent reports putting stablecoin holdings on TRON at roughly $95.8 billion. This provides an important fundamental backdrop for the network even though TRX itself remains range-bound.
📈 Bullish Scenario
A sustained move above $0.342 would improve the short-term structure. A stronger breakout through $0.349–$0.350 could open the way toward the $0.365 area.
📉 Bearish Scenario
If TRX loses the $0.333–$0.334 area on a daily basis, the next important downside zones are around $0.329–$0.330, followed by approximately $0.320.
🧠 Today’s Market View
TRX remains neutral to slightly bullish while holding above the $0.333–$0.334 support zone. The key point to watch is whether volume expands enough to push TRX out of its current range. Current market data also shows TRX around $0.336 with a market capitalization near $32 billion.
Key Levels:
🟢 Support: $0.334 → $0.330 → $0.320
🔴 Resistance: $0.342 → $0.350 → $0.365
Conclusion: TRX is currently in a consolidation phase. A confirmed breakout above resistance would strengthen the bullish structure, while losing the $0.333–$0.334 zone would increase downside risk.
This is market analysis for educational purposes, not a recommendation to buy or sell