
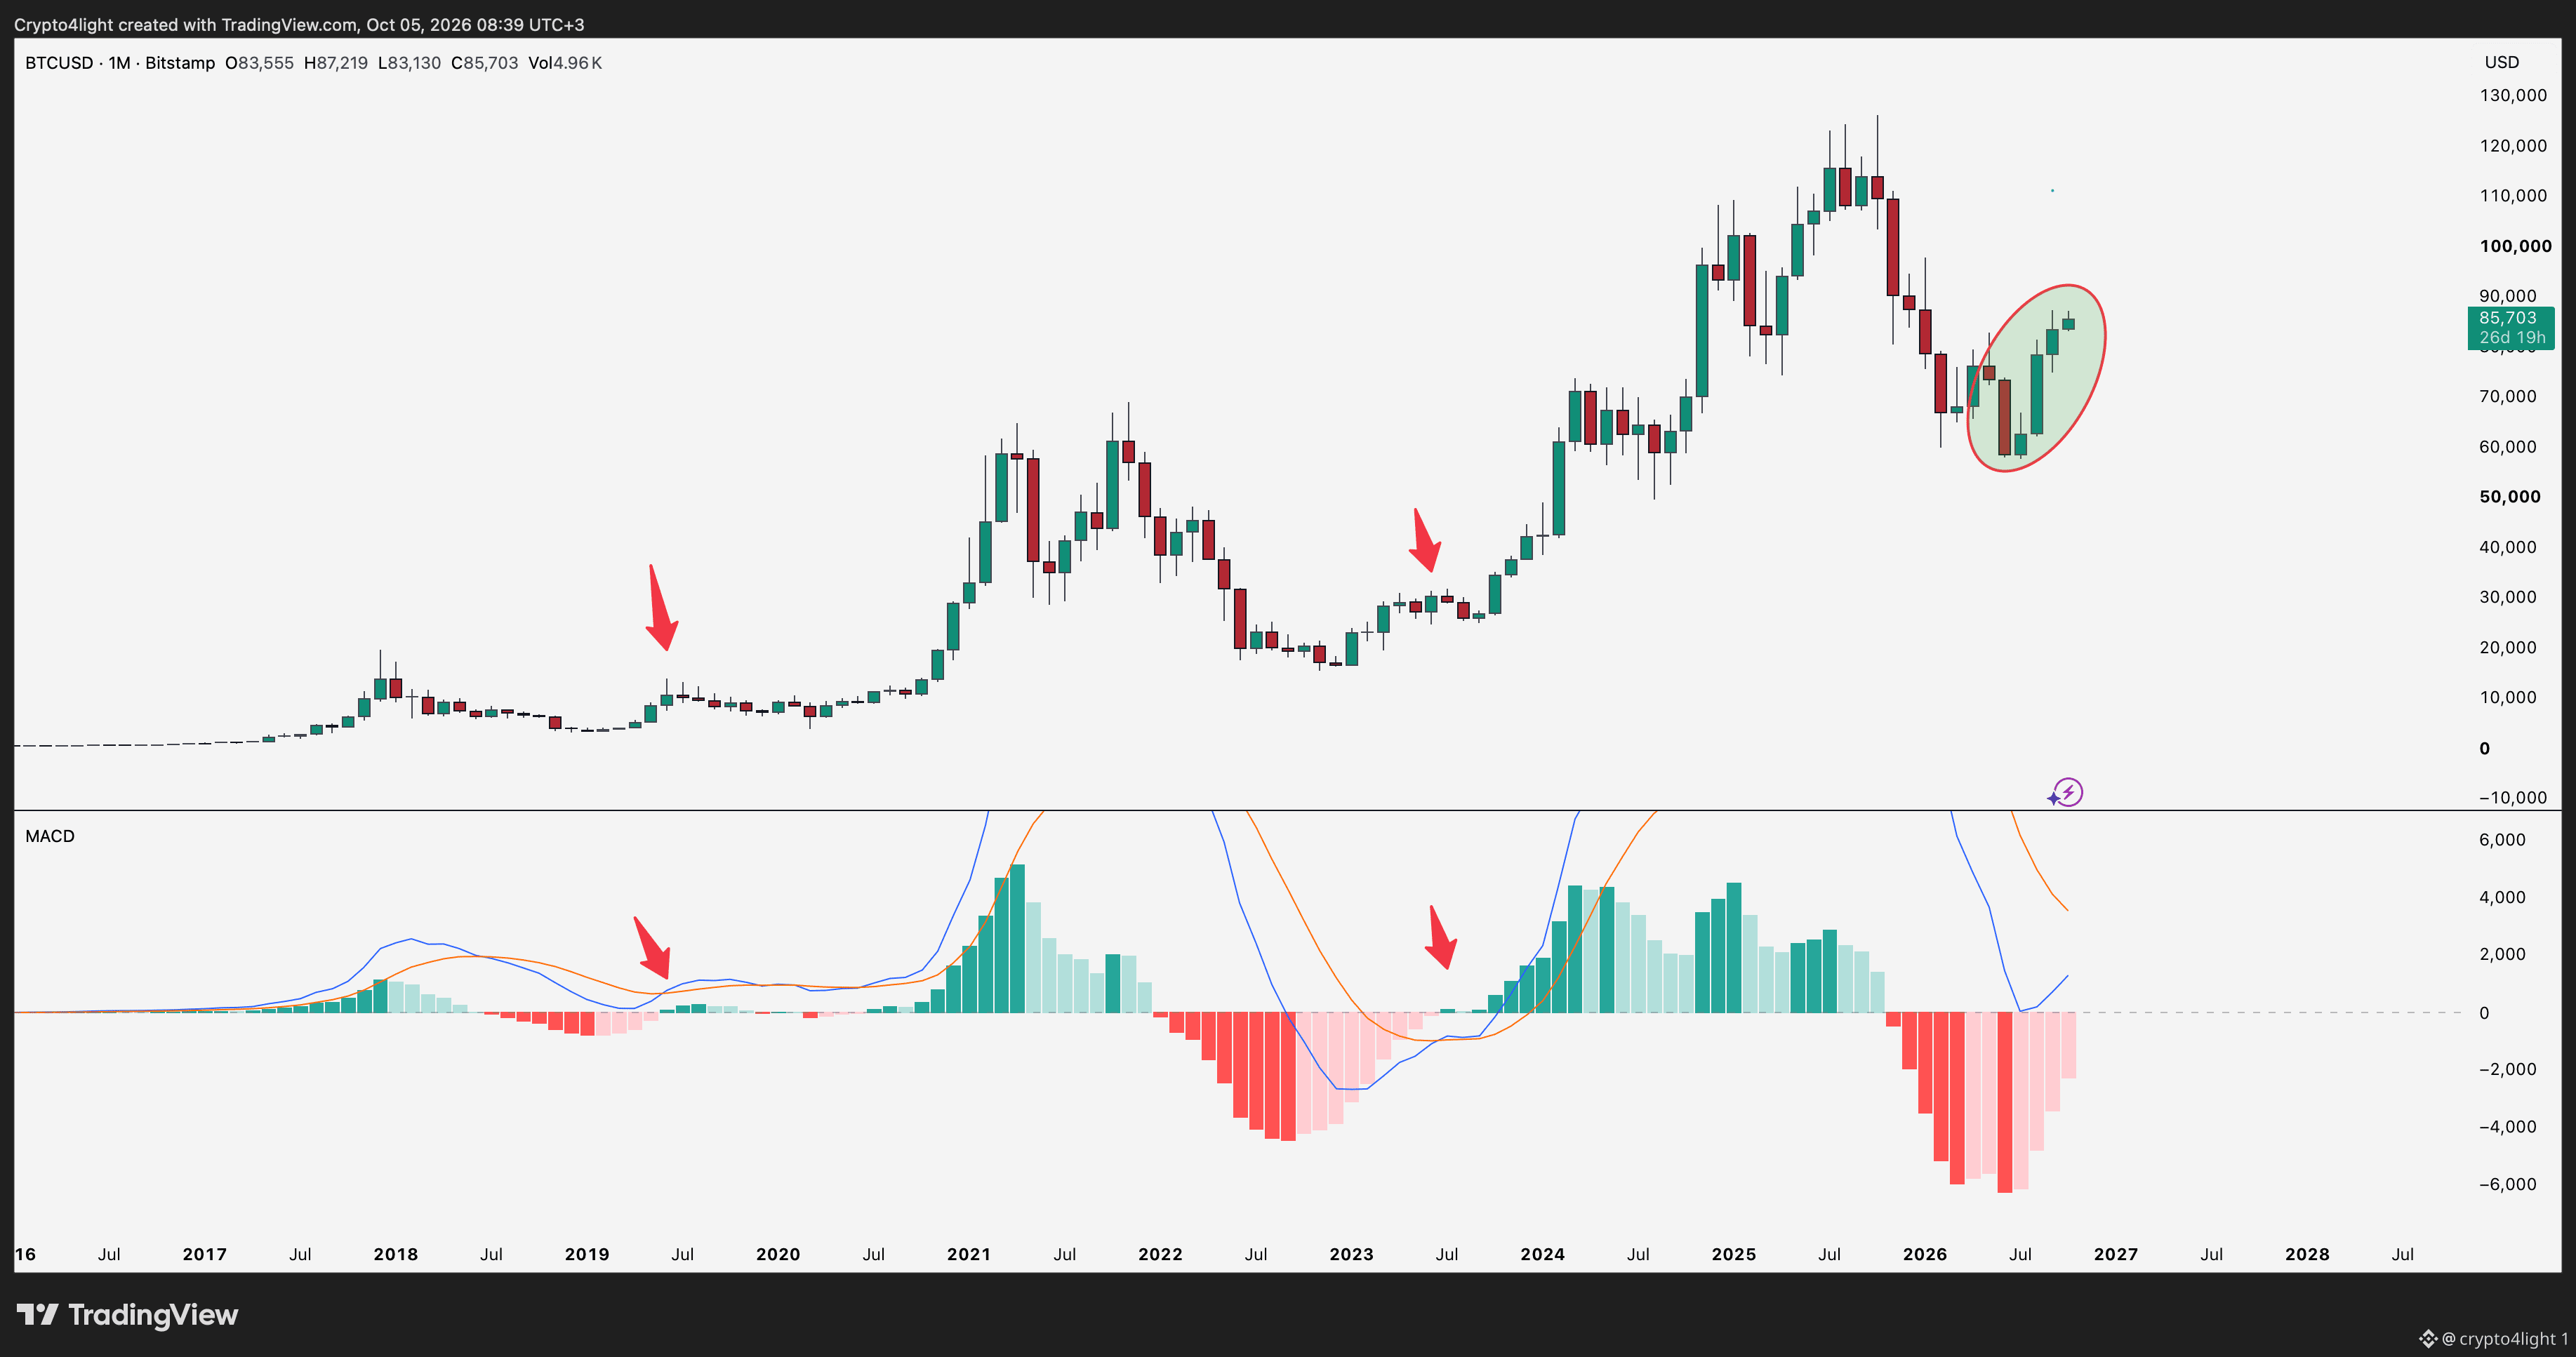
If we look at the classic MACD indicator on the monthly chart, we have several problems! Every time Bitcoin was close to moving into the green zone, we still pulled back afterward, and this raises the question: will this pullback be quick, like in 2023, followed by further growth, or will it be more like 2019, with another six months of downside and sideways movement? Plus, having four consecutive green months for Bitcoin is concerning! Another problem with everyone who uses MACD is that people buy when the indicator moves into the green zone, thinking that this is the bottom! The bottom is not formed in the green zone! It is always formed before that. $BTC


Посты
Отказ от ответственности. Содержит мнения третьих сторон. Не является рекомендацией. Binance AI не предоставляет гарантий. См. Правила и условия.