

AT/USDT (1D, Binance) is trading at 0.1346 after a sharp daily drop (-11.85%) that wicked down to 0.1075, right into the ascending trendline of a large triangle. Buyers defended that support, leaving a long lower wick.
📌 Context
Price has been consolidating for months between a descending trendline (lower highs) and an ascending one (higher lows).
There is a clear horizontal resistance at 0.1828 that has capped price several times. It is the first key level to reclaim.
Above it, I marked supply zones between 0.20 and 0.31, where I would expect sellers to show up.
Stoch RSI (3,3,14,14) is in the low zone (~18.7 / 28.1), close to oversold.
STC (12,26,50) is at its lows (~8.5), with room to turn upward.
🎯 Trade Plan (Long)
Entry: 0.1346
TP1: 0.1828 (horizontal resistance)
TP2: 0.2402 (inside the supply zone)
TP3: 0.3142 (top of the supply zones)
Conservative SL: 0.0743 (below the support level I marked)
Wide SL: 0.0351
Risk/reward with the conservative stop is roughly 0.8:1 to TP1, 1.75:1 to TP2 and 2.9:1 to TP3. With the wide stop it drops to about 0.5:1, 1.1:1 and 1.8:1 respectively. I suggest taking partial profits at TP1 and sizing the position carefully.
⚠️ Invalidation
A daily close below the ascending triangle support (and the 0.1075 wick low) invalidates the bounce. The bullish case strengthens on a daily close above 0.1828, which would also break the descending trendline.
💬 Do you see a breakout or a breakdown from this triangle? Let me know in the comments.
This is only my personal analysis and not financial advice. Do your own research and manage your risk.


Статья
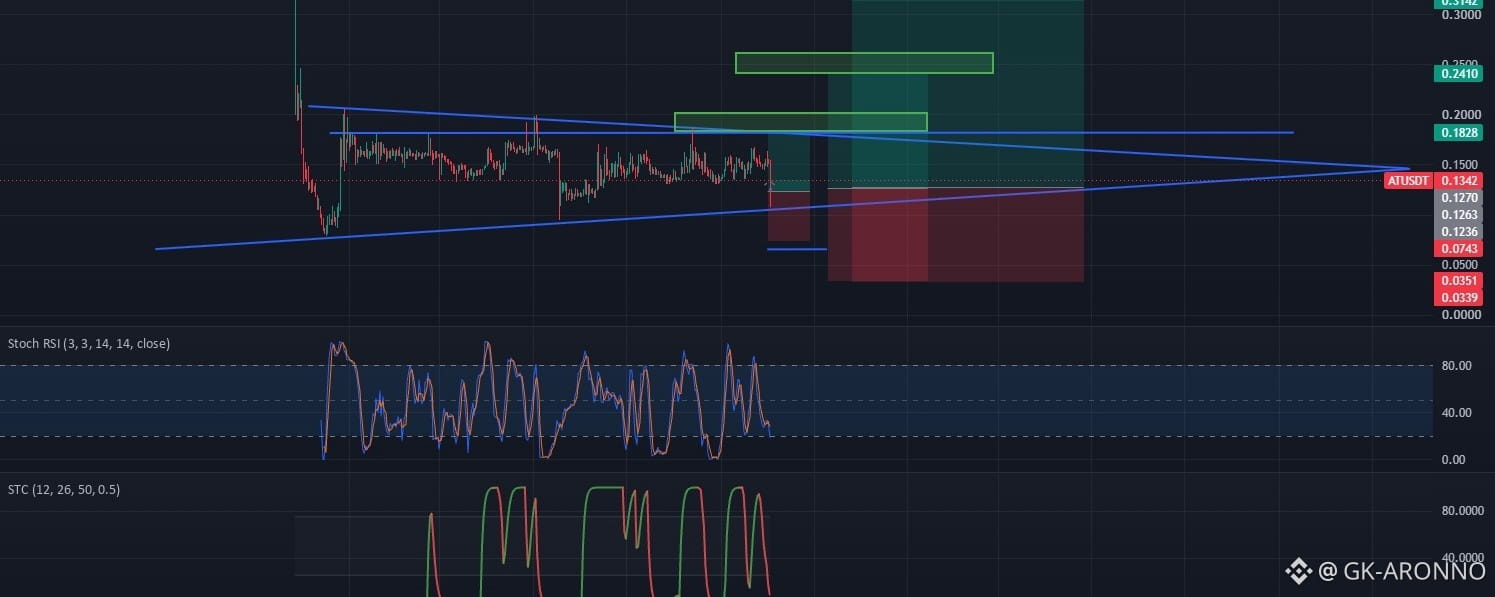
AT/USDT | Bounce from Triangle Support Toward the 0.18 Resistanc💥⚡
Отказ от ответственности. Содержит мнения третьих сторон. Не является рекомендацией. Binance AI не предоставляет гарантий. См. Правила и условия.