


Bitcoin (BTC/USDT) Technical Analysis: Key Support, Resistance and Trading Scenarios
Date: October 4, 2026
Trading Pair: BTC/USDT
Timeframe: 4-Hour (4H)
Market: Binance
Market Overview
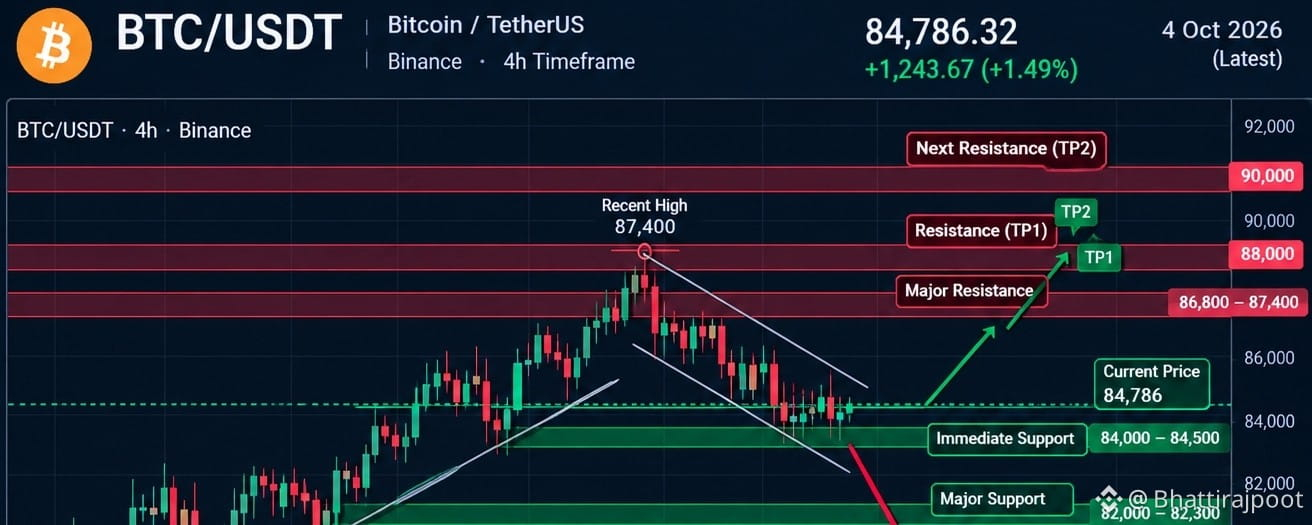
Bitcoin (BTC) is currently trading around the $84,786 level, according to the illustrative chart analysis. Recent price action shows a pullback from the $87,400 resistance area, indicating that the market is experiencing consolidation after an upward move.
The current price structure suggests that traders should closely monitor key support and resistance levels before entering new positions. A confirmed breakout or breakdown could provide a clearer indication of the next potential market direction.
Note: The quoted price and technical levels should be verified against a live exchange chart before publication or trading.
1. Candlestick Chart Analysis
The 4-hour candlestick chart shows that Bitcoin previously moved upward from the lower price levels before facing selling pressure near $87,400.
Following this rejection, BTC entered a short-term downward channel. The price is now trading near the $84,000–$84,500 support zone.
The next move may depend on whether buyers can defend this support area or sellers can push the price below it.
2. Important Support and Resistance Levels
Support Levels
$84,000–$84,500: Immediate support zone.
$82,000–$82,300: Major support zone.
$80,000: Potential downside reference if selling pressure continues.
Resistance Levels
$86,800–$87,400: Major resistance zone and recent high area.
$88,000: Potential upside target following a confirmed breakout.
$90,000: Higher resistance and psychological price level.
These levels are technical reference points rather than guaranteed reversal areas.
3. Potential Bullish Scenario
A bullish scenario could develop if Bitcoin breaks above the $86,800–$87,400 resistance zone and a 4-hour candle closes above it.
Traders may then watch for a retest of the breakout zone as potential confirmation that buyers remain active.
Potential upside reference levels are:
First target: $88,000
Second target: $90,000
A breakout without sufficient buying volume or a successful retest may fail, so confirmation is important.
4. Potential Bearish Scenario
A bearish scenario could develop if Bitcoin closes below $84,000 on the 4-hour timeframe and subsequently fails to reclaim that level.
Such price action could increase the possibility of a move toward the next support zone.
Potential downside reference levels are:
First target: $82,300
Second target: $80,000
A quick recovery above broken support could invalidate the bearish setup, so traders should avoid relying on a single candle alone.
5. Pullback Trading Opportunity
If BTC revisits the $84,000–$84,500 area and forms a clear bullish rejection candle, traders may monitor the zone for a possible pullback setup.
However, support alone is not sufficient confirmation. A stronger setup would include a bullish candle close, improving momentum and a defined stop-loss level.
If support fails, waiting for a new structure may be preferable to entering prematurely.
6. Risk Management
Trading Bitcoin involves substantial volatility, particularly when leverage is used. Every trade should have a predefined entry, stop-loss and profit-taking plan.
Consider the following risk-management principles:
Risk only a small, predefined portion of trading capital per position.
Avoid excessive leverage.
Confirm candle closes instead of reacting to temporary price movements.
Calculate position size according to the stop-loss distance.
Do not enter a trade simply because the price reaches a support or resistance level.
Conclusion
Bitcoin is trading within an important technical range, with immediate support around $84,000–$84,500 and major resistance around $86,800–$87,400, according to the chart levels presented.
A confirmed breakout could open the way toward $88,000 and $90,000, while a confirmed breakdown could expose the $82,300 and $80,000 areas.
The market's next direction remains uncertain. Traders should wait for price confirmation, follow a disciplined risk-management strategy and verify all levels using current market data.
Disclaimer: This article is for educational and informational purposes only. It is not financial advice or a guarantee of future price movements. Cryptocurrency trading involves significant risk, including the possible loss of capital.