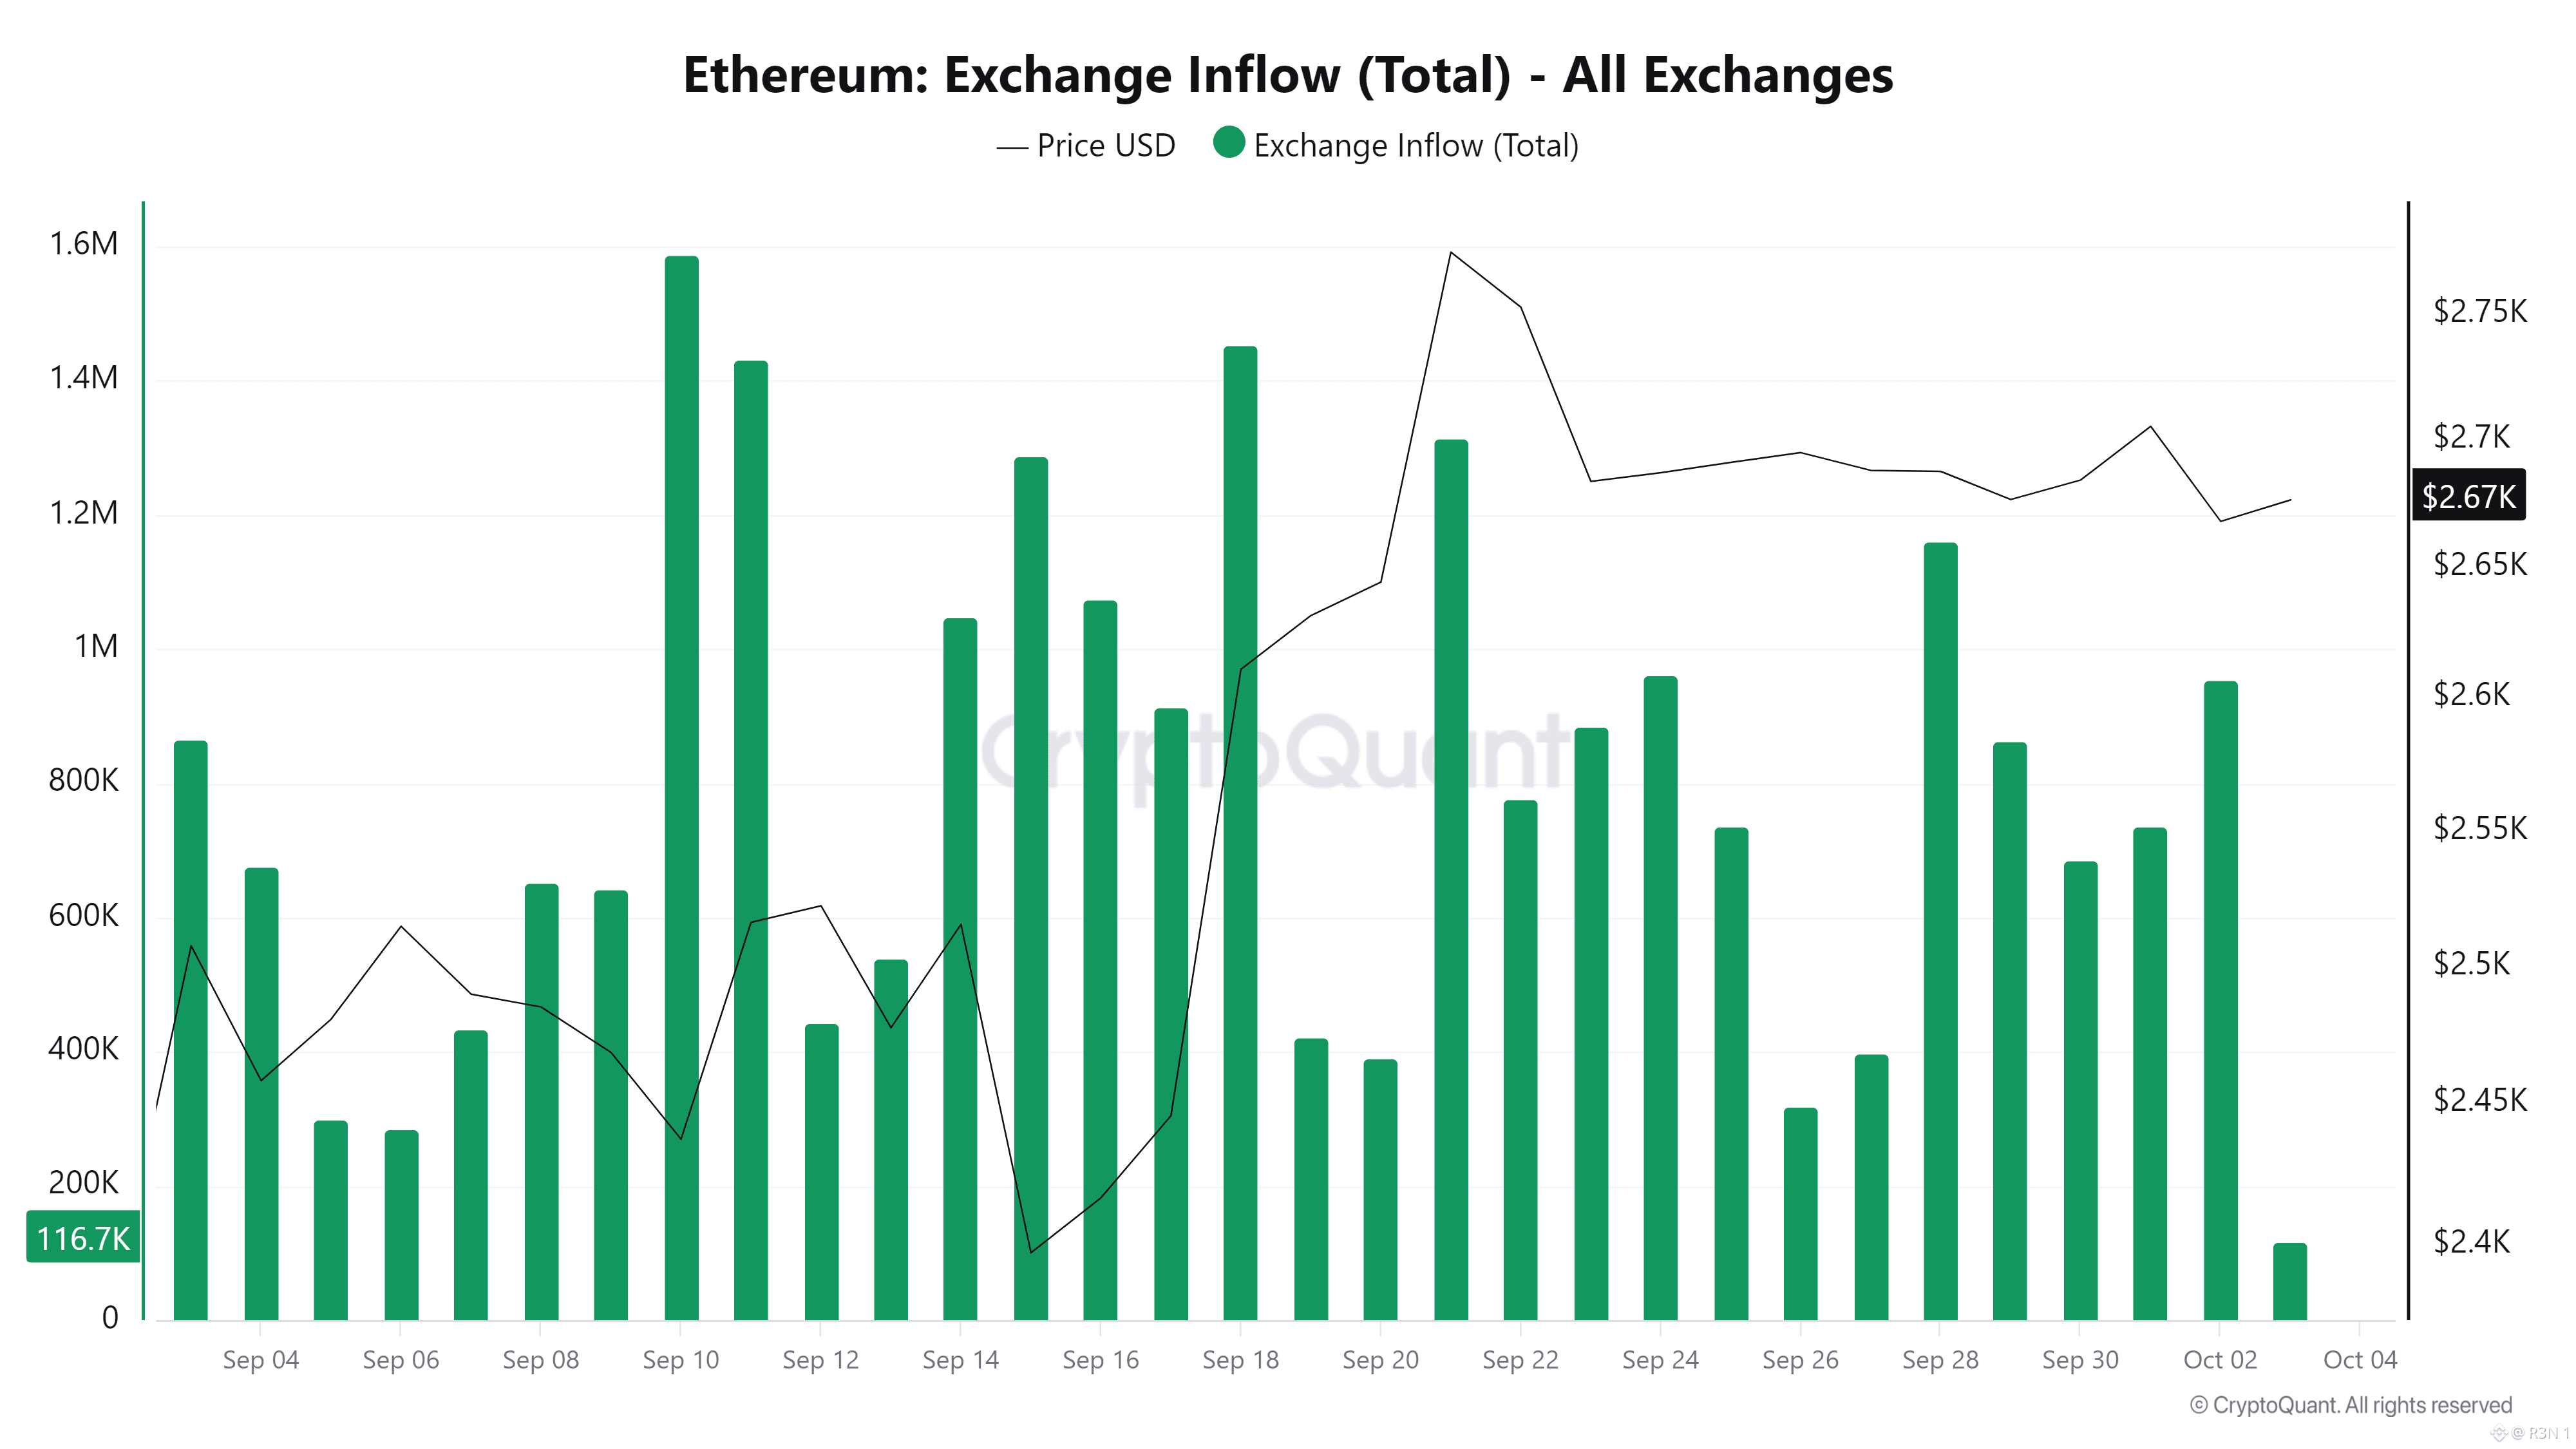
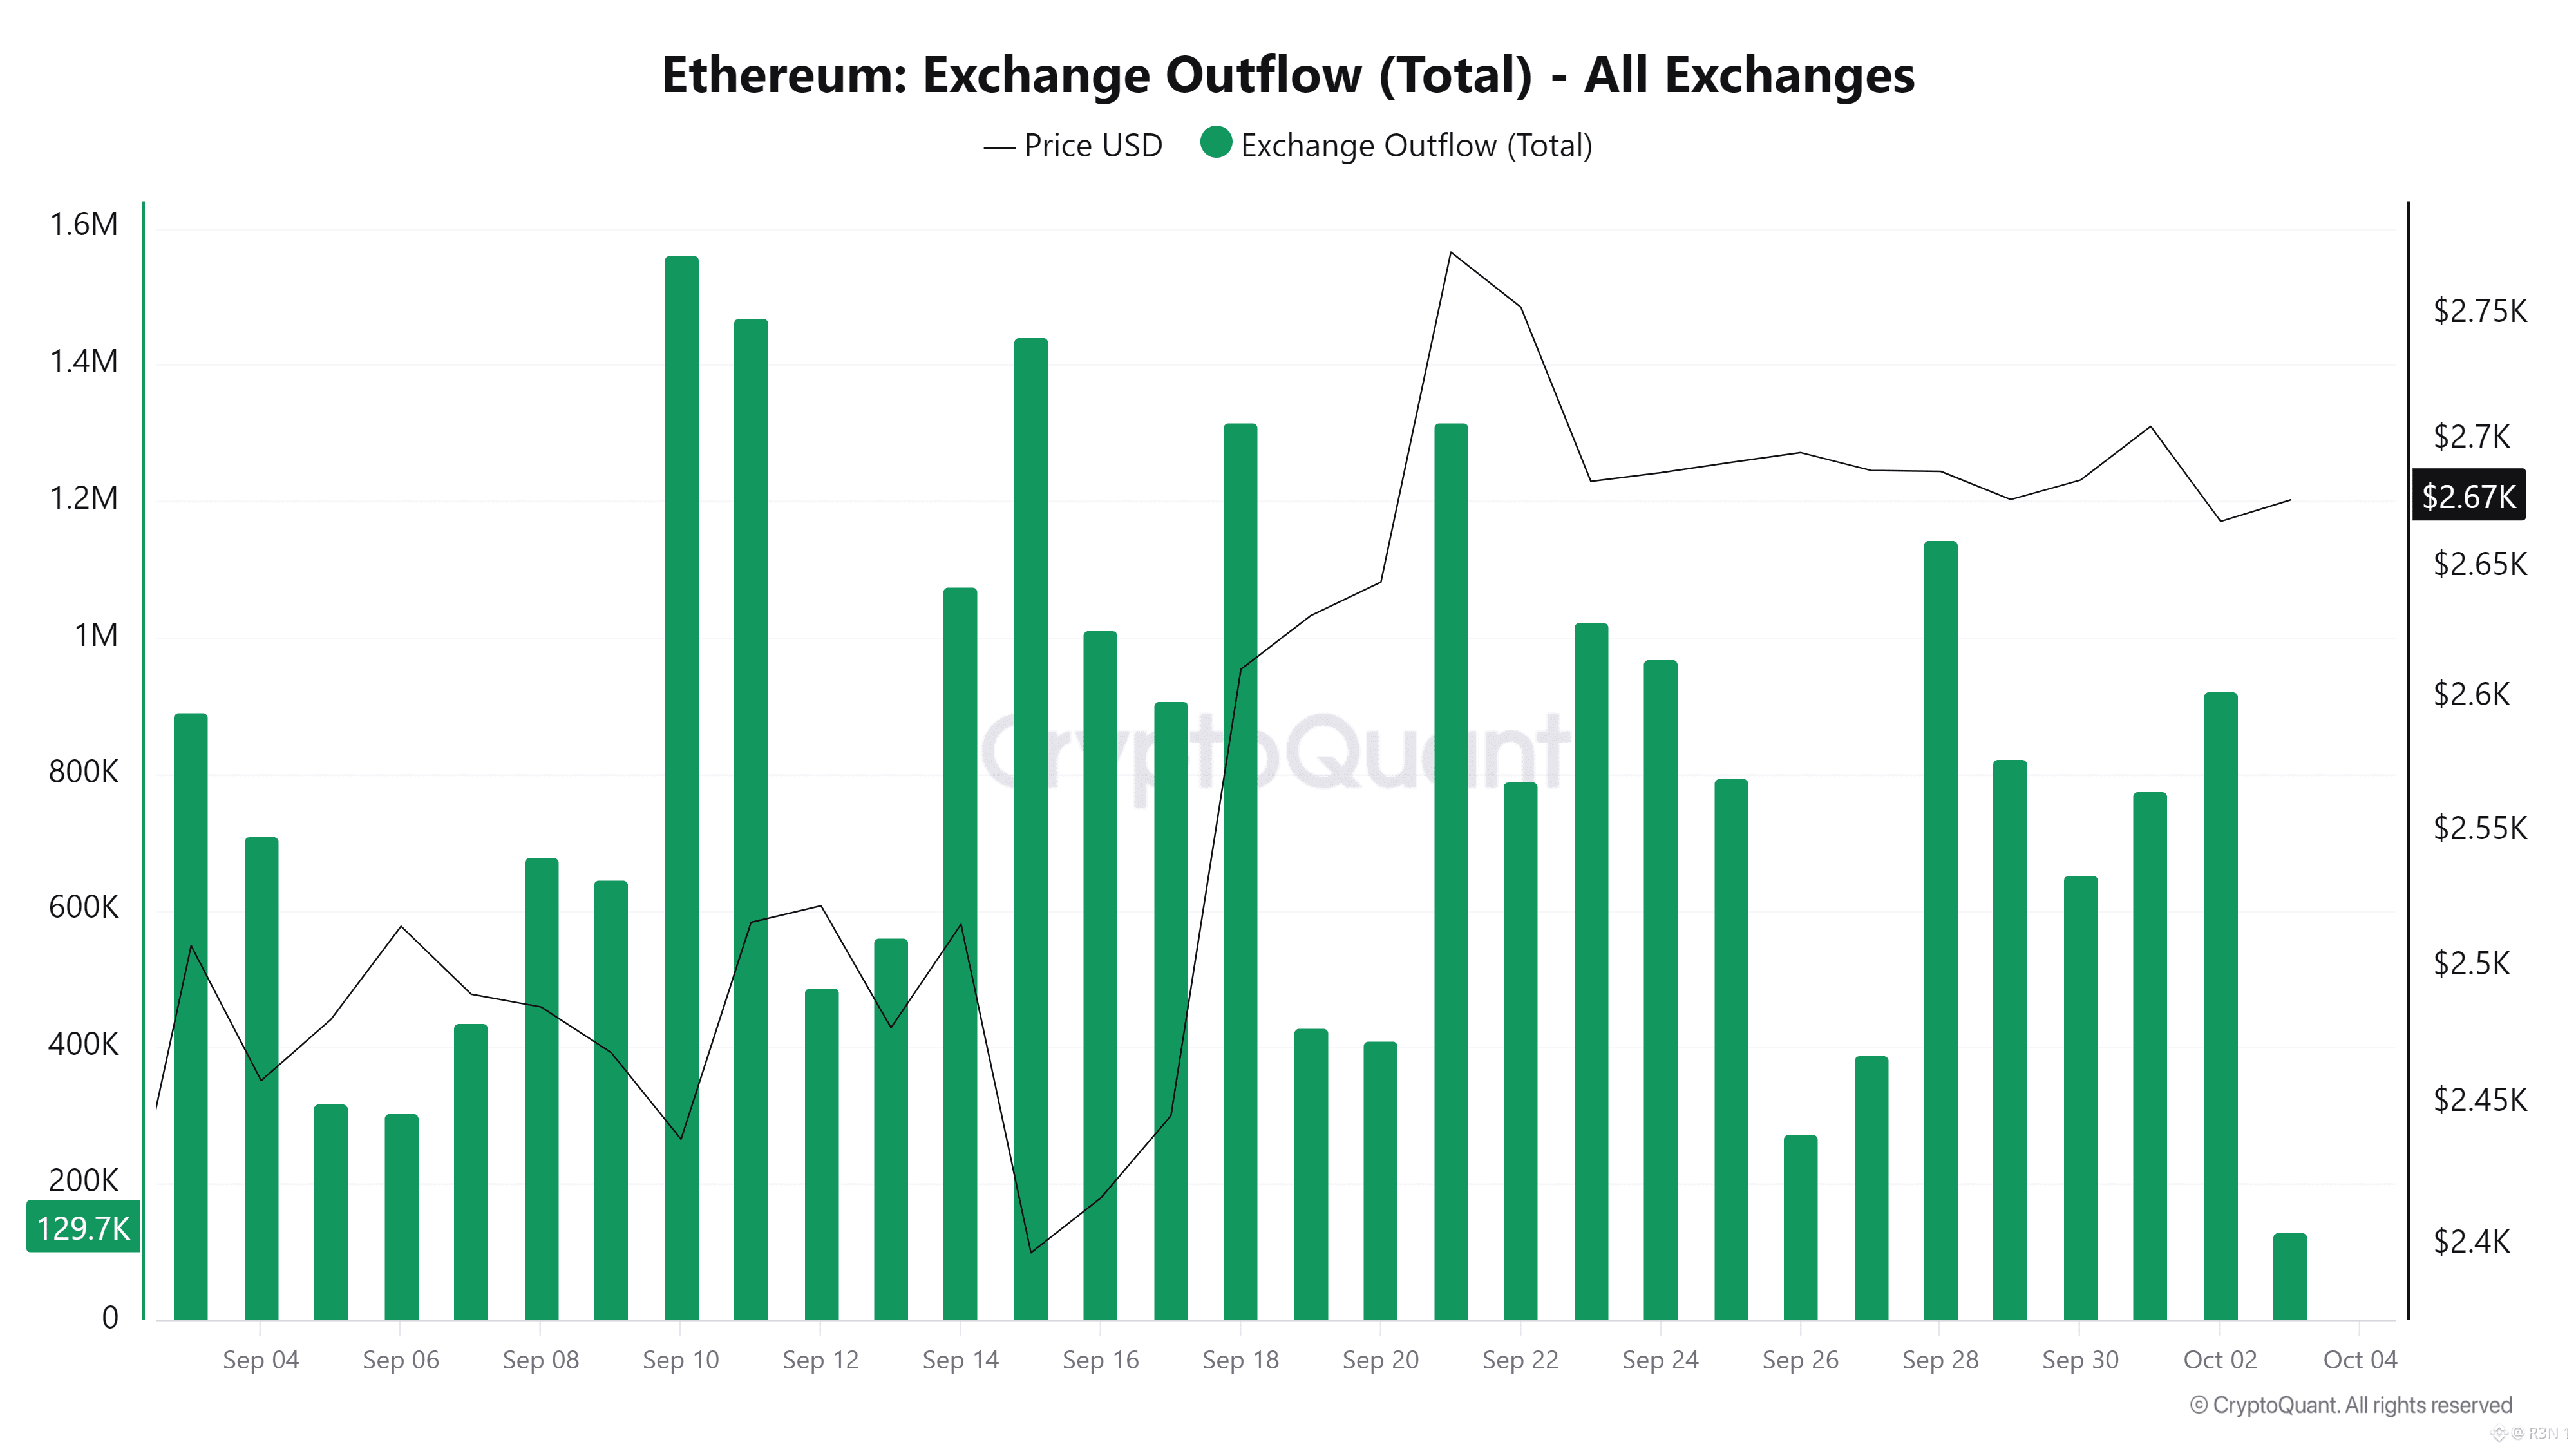
Ethereum's exchange inflow and outflow have basically mirrored each other all month, until the very last reading, where that pattern finally broke. What strikes me looking at both charts together is how synchronized they've been. September 10, 18, 22, and 28 all show matching spikes on both inflow and outflow, roughly 1.58M and 1.55M, 1.45M and 1.3M, 1.3M on both sides, 1.15M on both sides. That kind of twin movement usually reads as churn to me, high volume cycling through exchanges, not one directional trend quietly building underneath. Personally, the detail I'd actually flag is the most recent print. Outflow just hit 129.7K against inflow at 116.7K, a real net outflow day after weeks of near perfect balance. I wouldn't call that a confirmed shift yet, it's one data point, but it's the first genuine divergence in an otherwise matched month. Price climbed from around $2.40K in mid September to $2.67K now, with the sharpest jump, roughly $2.45K to $2.70K, landing right between September 19 and 21, right after that September 18 spike on both sides. I think that timing is worth noting, large two sided flow activity showing up just before a real price move, though I wouldn't claim it caused the breakout outright. My honest read: a month of matched flows mostly tells you the market's been active and repositioning, not accumulating or distributing in any clear direction. Where I'd push back on getting ahead of this, one outflow heavy day doesn't confirm a new trend, it just breaks the pattern that held for weeks. What I'm watching: whether outflow actually keeps leading inflow from here, or whether this snaps back to the matched twin spikes that defined most of September. $ETH #BTC Price Analysis# #Altcoin Season# #Meme Alpha#


Посты

--
Отказ от ответственности. Содержит мнения третьих сторон. Не является рекомендацией. Binance AI не предоставляет гарантий. См. Правила и условия.