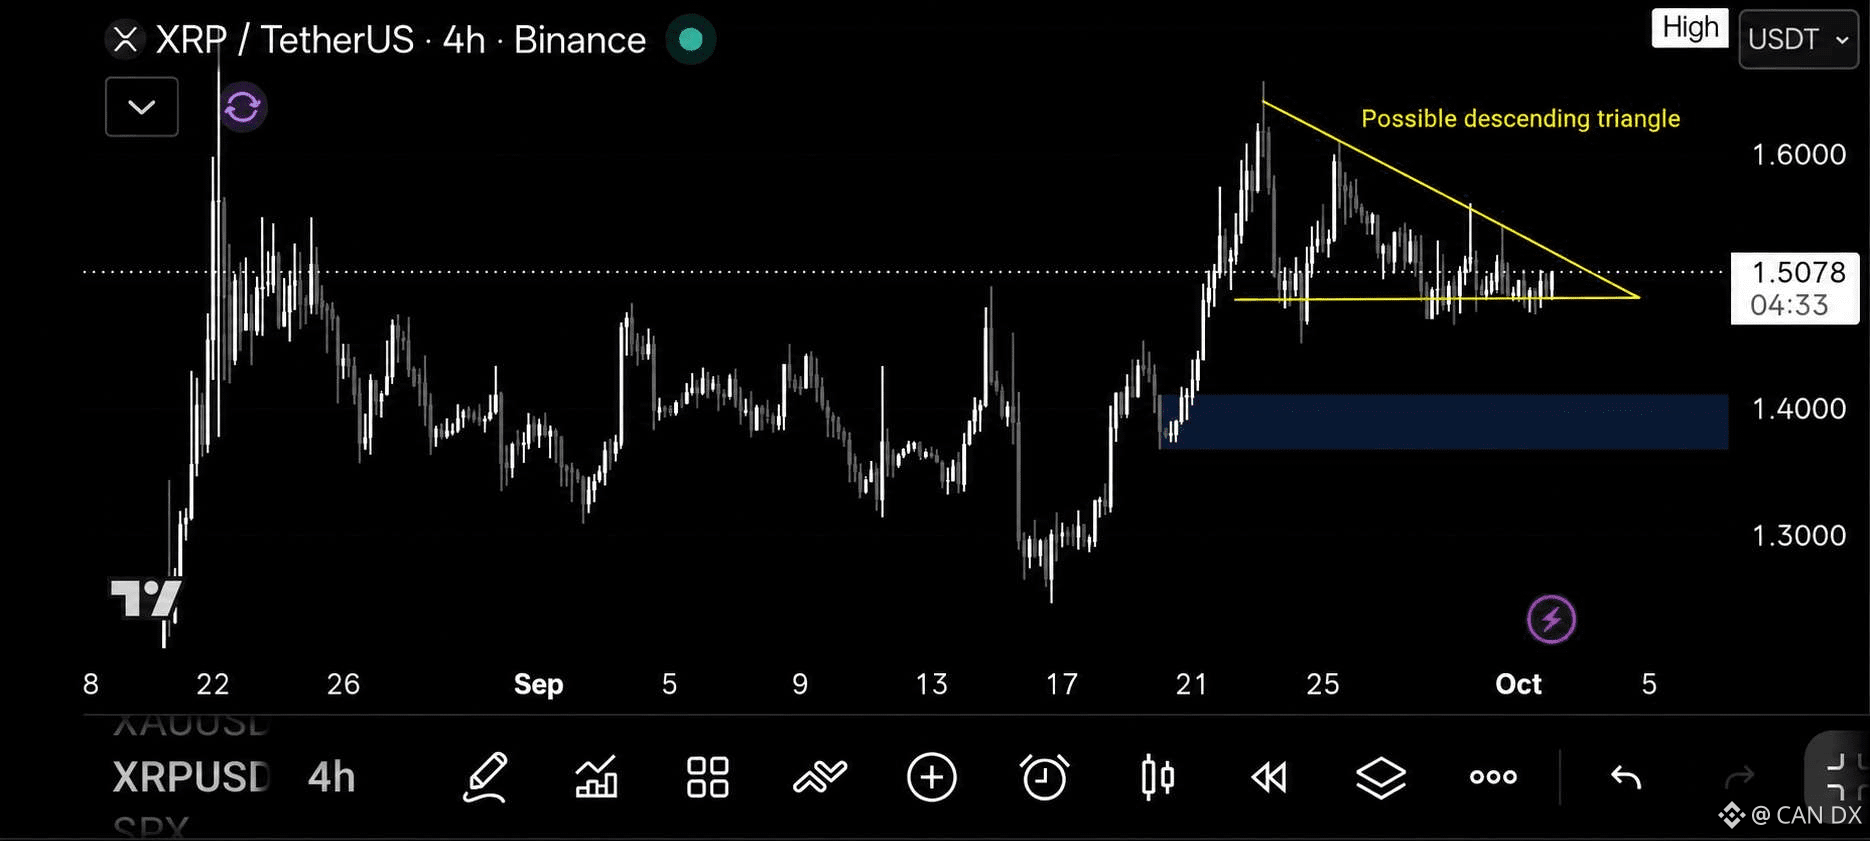
$XRP is getting squeezed between lower highs and a support zone.
On this 4H chart, a possible descending triangle is forming, with support around 1.47–1.48.
A confirmed close below support could bring the blue demand zone around 1.37–1.41 into focus. A break above the descending trendline would weaken the bearish setup, with 1.55 and 1.60 worth watching.
My view: I’m waiting for a clear break and retest. The pattern is still developing, and guessing the direction too early can be costly.
Which breaks first: resistance or support?
DYOR, not financial advice.
#XRP #Ripple #Altcoins #Crypto #TechnicalAnalysis
On this 4H chart, a possible descending triangle is forming, with support around 1.47–1.48.
A confirmed close below support could bring the blue demand zone around 1.37–1.41 into focus. A break above the descending trendline would weaken the bearish setup, with 1.55 and 1.60 worth watching.
My view: I’m waiting for a clear break and retest. The pattern is still developing, and guessing the direction too early can be costly.
Which breaks first: resistance or support?
DYOR, not financial advice.
#XRP #Ripple #Altcoins #Crypto #TechnicalAnalysis