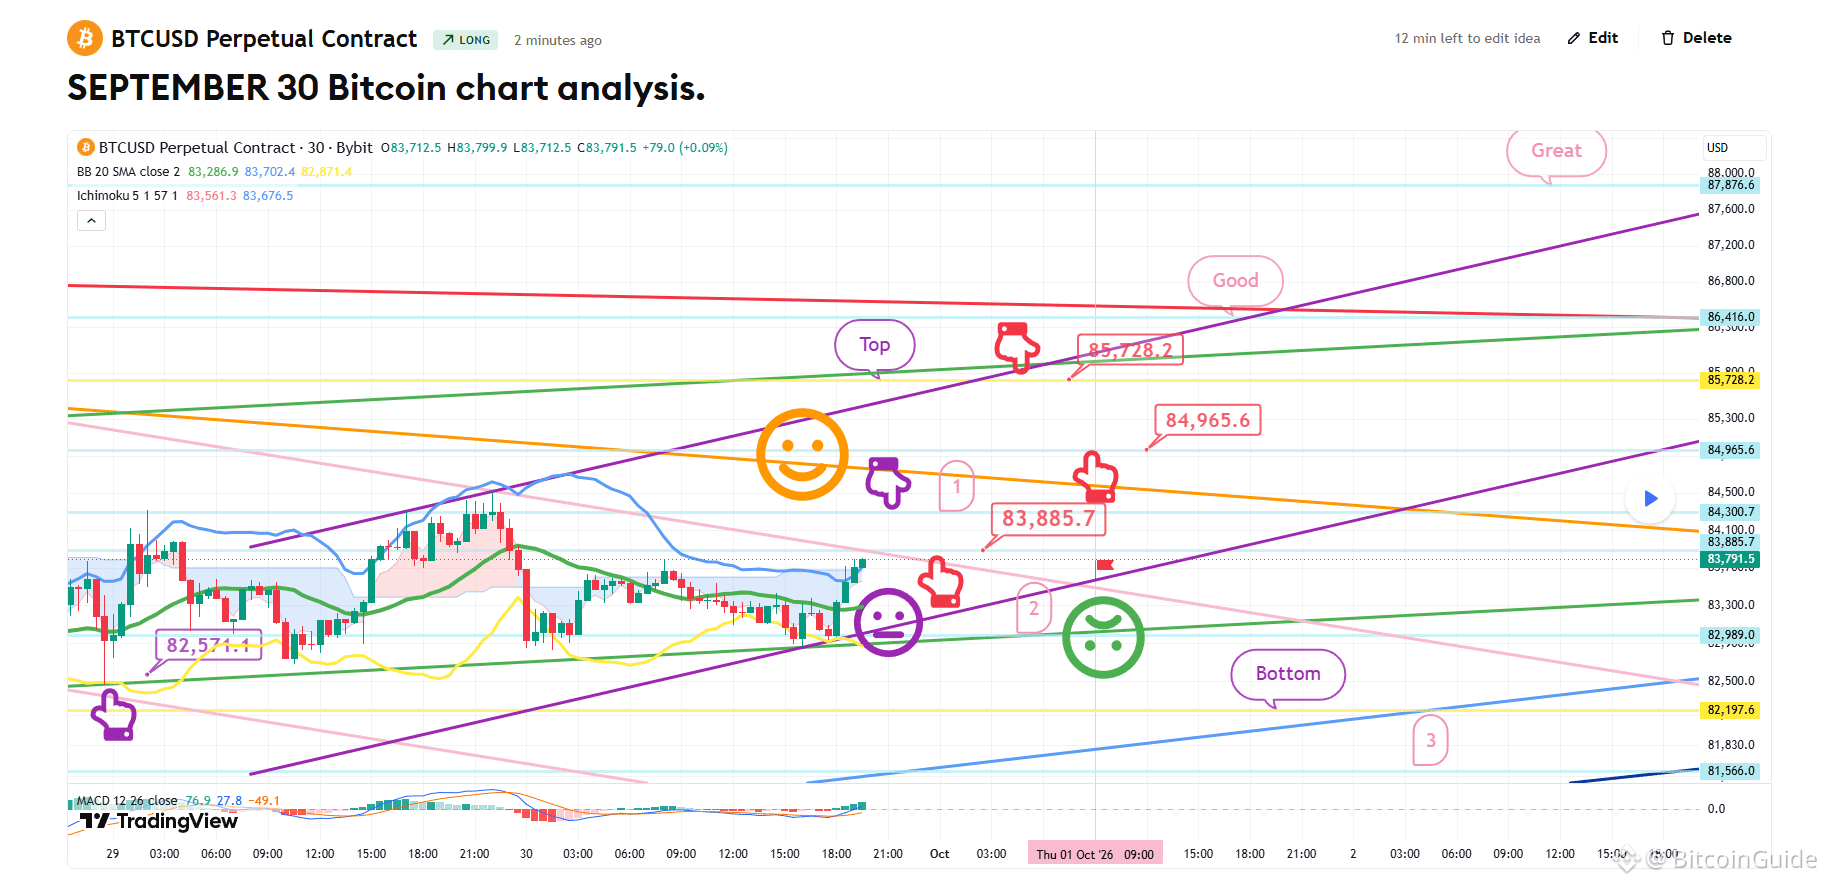
[September 30 Bitcoin chart analysis]
BTCUSD 30Min Chart
*My analysis is optimized for TradingView.
If you press the replay button, you can check real-time movements.
-Long position strategy-
At the bottom left, indicated by a purple finger,
I have maintained the strategy for the long position entered on the 28th at $82,571.1.
*Long position strategy regarding the touch of the area marked by purple finger 1 at the top:
1) After confirming a touch on the area marked by purple finger 1 at the top,
look for a long entry at the level marked by the red finger ($83,885.7)
/ Stop-loss if the green support line is breached.
2) Top target area: $85,728.2 (1st target) -> Targets follow the sequence of "Good" then "Great."
If the strategy succeeds, the 84.9K level serves as a zone for re-entering a long position.
3) If the price drops without touching the area marked by purple finger 1,
wait for a long entry at the bottom area marked 1 / Stop-loss if the green support line is breached.
The same stop-loss level applies to those currently holding the 82.5K long position.
- Although the probability is very low before the new monthly candle forms tomorrow,
if the "Great" target is touched, a strong upward trend could continue.
This would increase the likelihood of hitting a new all-time high by the end of the year.
- If the price holds without breaking below the purple parallel lines,
there is a possibility of a vertical or strong upward surge.
- If the green support line is breached,
be aware that the price could drop toward the "Bottom" area—potentially down to the 3rd zone.
I post the analysis results as a Comment every day.
Thank you.
(You can find the link on my profile.)
- Click Follow to receive faster information every day.
- Check the results using the replay button on TradingView.
#BTC100K #BTC Price Analysis# #Altcoin Season# #Crypto #Trading $ETH $XRP $USDT $BTC
BTCUSD 30Min Chart
*My analysis is optimized for TradingView.
If you press the replay button, you can check real-time movements.
-Long position strategy-
At the bottom left, indicated by a purple finger,
I have maintained the strategy for the long position entered on the 28th at $82,571.1.
*Long position strategy regarding the touch of the area marked by purple finger 1 at the top:
1) After confirming a touch on the area marked by purple finger 1 at the top,
look for a long entry at the level marked by the red finger ($83,885.7)
/ Stop-loss if the green support line is breached.
2) Top target area: $85,728.2 (1st target) -> Targets follow the sequence of "Good" then "Great."
If the strategy succeeds, the 84.9K level serves as a zone for re-entering a long position.
3) If the price drops without touching the area marked by purple finger 1,
wait for a long entry at the bottom area marked 1 / Stop-loss if the green support line is breached.
The same stop-loss level applies to those currently holding the 82.5K long position.
- Although the probability is very low before the new monthly candle forms tomorrow,
if the "Great" target is touched, a strong upward trend could continue.
This would increase the likelihood of hitting a new all-time high by the end of the year.
- If the price holds without breaking below the purple parallel lines,
there is a possibility of a vertical or strong upward surge.
- If the green support line is breached,
be aware that the price could drop toward the "Bottom" area—potentially down to the 3rd zone.
I post the analysis results as a Comment every day.
Thank you.
(You can find the link on my profile.)
- Click Follow to receive faster information every day.
- Check the results using the replay button on TradingView.
#BTC100K #BTC Price Analysis# #Altcoin Season# #Crypto #Trading $ETH $XRP $USDT $BTC