

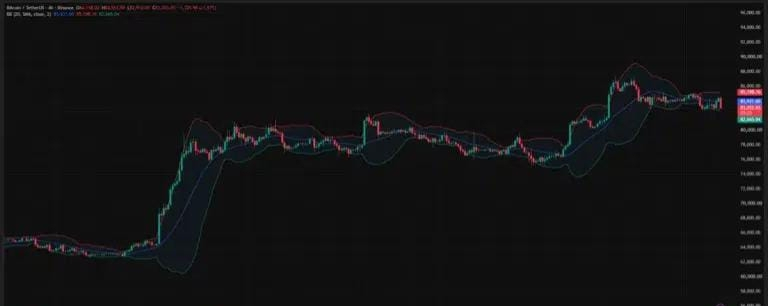

Bitcoin price fell toward $83,000 on Sep. 29 after retreating from last week’s high near $87,400. The latest 4-hour decline brought the price close to a support area that also holds a dense band of potential long liquidations.
Chart showed Bitcoin ( $BTC ) near $83,050 late on Sep. 29, down from a Sep. 21 high near $87,400. The daily price had fallen below $84,000, although it remained above the 20-day simple moving average at $80,944. The move leaves Bitcoin between the recent high and a cluster of nearer support levels around $82,600–$83,000.
The pullback has unfolded alongside higher U.S. Treasury yields and volatile oil prices. Those pressures offer a macro backdrop for the move, but the price chart alone cannot establish how much of the decline came from profit-taking, changes in interest-rate expectations, or other selling.
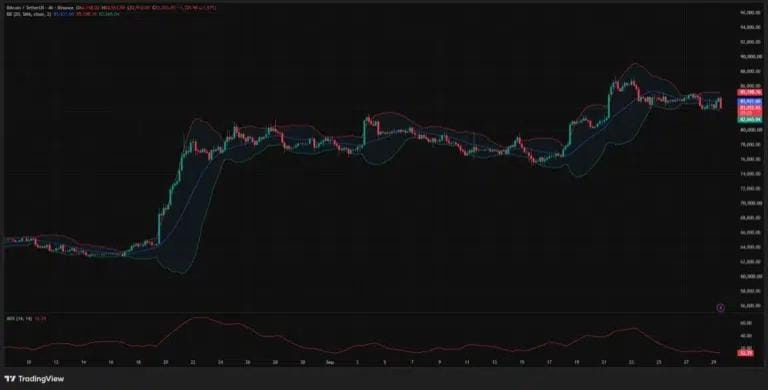
A recovery above the middle band would put $84,000 back in play before Bitcoin tests the $85,000–$85,200 area. The recent high near $87,400 would remain a further hurdle. Bitcoin’s attempts to rebound during the past several sessions have stalled below that high.
The 4-hour average directional index, or ADX, stood at 12.39. ADX measures the strength of a trend rather than its direction, and the low reading indicates that the earlier upward move has lost strength on this timeframe. Price has moved back and forth around the middle Bollinger Band since the initial drop from the weekly high, before the latest move toward the lower band.
On the daily chart, the broader moving-average structure remains above its longer-term measures. Bitcoin traded above the 20-day average at $80,944, the 50-day average at $76,883, and the 100-day average at $70,135. The 200-day average stood near $71,235.
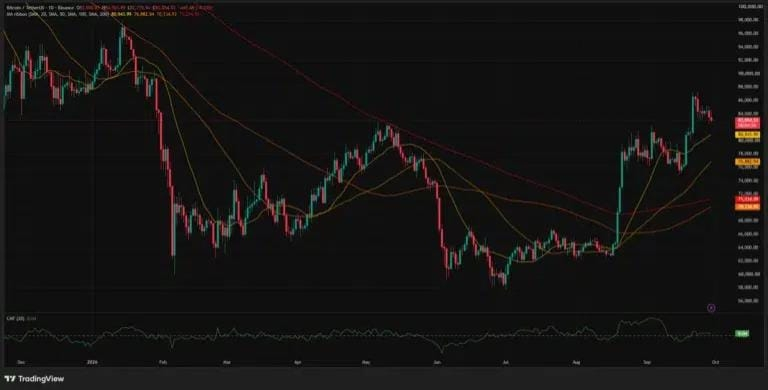
The daily Chaikin Money Flow reading was slightly positive at 0.04. That reading sits much closer to zero than it did during the earlier part of the September rally, pointing to weaker buying pressure on the daily chart even as the indicator remains positive.