




Looking at the $ZEC chart, a question comes to mind: will it really head upwards from here, or is the momentum it has built up gradually fading?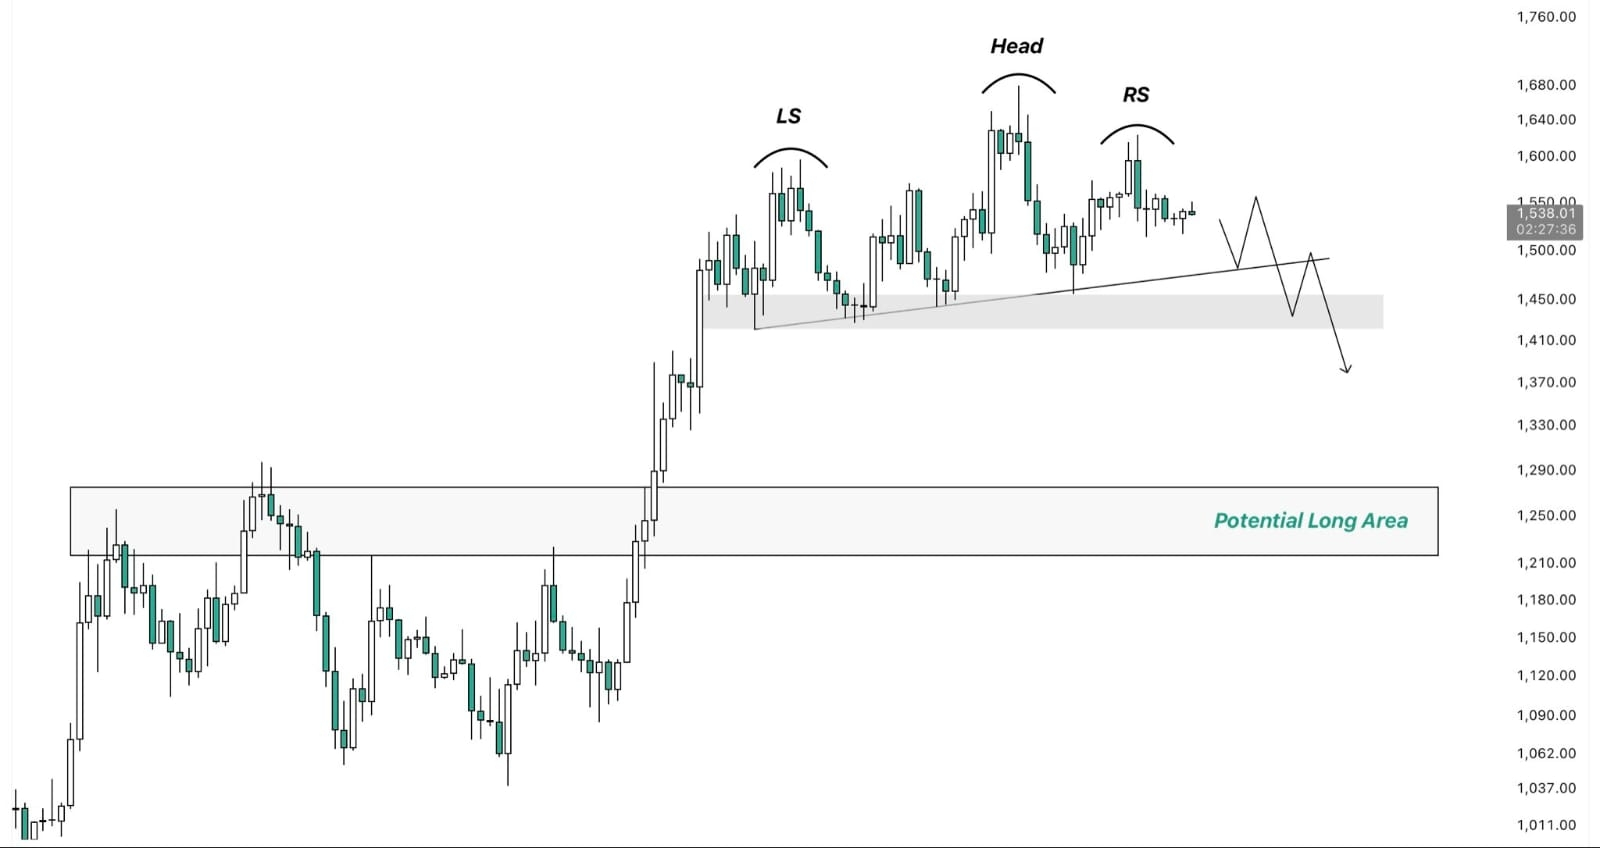
One thing stands out on the chart: the price is currently hovering in a zone where a "Head and Shoulders" pattern seems to be forming. However, I don't want to jump into a short position based solely on the pattern—especially since the key support level below is still holding firm.
That’s where it gets interesting.
On one hand, the pattern looks bearish; on the other, the support is still holding the price up, meaning buyers haven't completely disappeared. In situations like this, it often looks like a breakdown is imminent... only for the price to bounce back. That’s why, for me, confirmation below the neckline/support is the crucial factor. If the support actually breaks and the price sustains that level, the short setup will become much clearer. In that case, I’d be eyeing the $1,200–$1,300 zone.
Why this zone?
Because it’s the area where $ZEC previously established the high of its trading range—the very point from which we saw the recent breakout. If the price returns to that old range high, how the market reacts will be significant.
There’s an interesting twist here, too.
If the level that previously acted as resistance—and then as support after the breakout—comes into play again, the narrative of the entire setup could shift. If buyers step in there, a new opportunity might arise—this time for a long position in the opposite direction.
In other words, I’m not simply viewing this as "breakdown equals short."
I’m actually considering two distinct scenarios.
First: the neckline/support breaks → the retest fails → the downward trend continues → targeting the $1,200–$1,300 zone.
Second: the price drops to that zone but triggers a strong reaction → it reclaims the old range high → a long setup for upward expansion could then emerge. One thing keeps crossing my mind: the market often places more importance on the actual reaction than on the pattern itself. There is no rule stating that the market will necessarily respect a "Head and Shoulders" pattern just because it appears on the chart. Until confirmation is received, the pattern remains merely a possibility.
And for a trader, this is the tricky part.
It is tempting to preemptively assume the outcome when a clear bearish pattern is right in front of you, even though the price hasn't confirmed it yet. I would prefer to wait until there is acceptance below the support level.
For me, $ZEC is currently more a matter of observation than prediction.
A breakdown would be one scenario.
On the other hand, if buyers step back in around the $1,200–$1,300 range, the story could change completely.
Let’s see which side ultimately proves its case.
