$BTW
USDT — 15m chart analysis
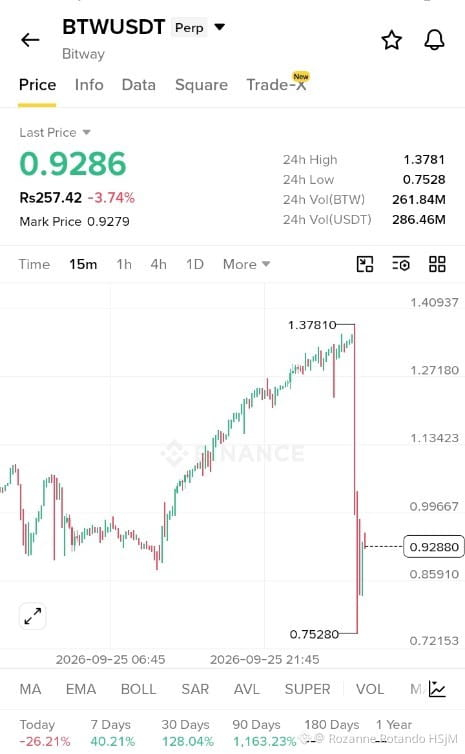
The chart shows an extreme liquidation/rejection move from 1.3781 → 0.7528, followed by a bounce to around 0.9286.
Key levels:
🟢 Support: 0.85–0.86
🟢 Major support: 0.75–0.78
🔴 Resistance: 0.96–1.00
🔴 Next resistance: 1.13–1.14
🔴 Major resistance: 1.27–1.38
Possible LONG setup
Rather than chasing the current bounce, I'd watch for:
Entry: 0.88–0.92 after a confirmed 15m higher low
Stop: below 0.84
TP1: 0.97–1.00
TP2: 1.05–1.10
TP3: 1.13–1.14
Confirmation: A 15m close back above 0.96–1.00 with volume would make the rebound structure stronger. A break below 0.85 would weaken the bullish setup and expose 0.75–0.78.
Because the move is unusually volatile, position size and leverage matter a lot here; the levels are chart-based scenarios, not guaranteed outcomes.
USDT — 15m chart analysis
The chart shows an extreme liquidation/rejection move from 1.3781 → 0.7528, followed by a bounce to around 0.9286.
Key levels:
🟢 Support: 0.85–0.86
🟢 Major support: 0.75–0.78
🔴 Resistance: 0.96–1.00
🔴 Next resistance: 1.13–1.14
🔴 Major resistance: 1.27–1.38
Possible LONG setup
Rather than chasing the current bounce, I'd watch for:
Entry: 0.88–0.92 after a confirmed 15m higher low
Stop: below 0.84
TP1: 0.97–1.00
TP2: 1.05–1.10
TP3: 1.13–1.14
Confirmation: A 15m close back above 0.96–1.00 with volume would make the rebound structure stronger. A break below 0.85 would weaken the bullish setup and expose 0.75–0.78.
Because the move is unusually volatile, position size and leverage matter a lot here; the levels are chart-based scenarios, not guaranteed outcomes.