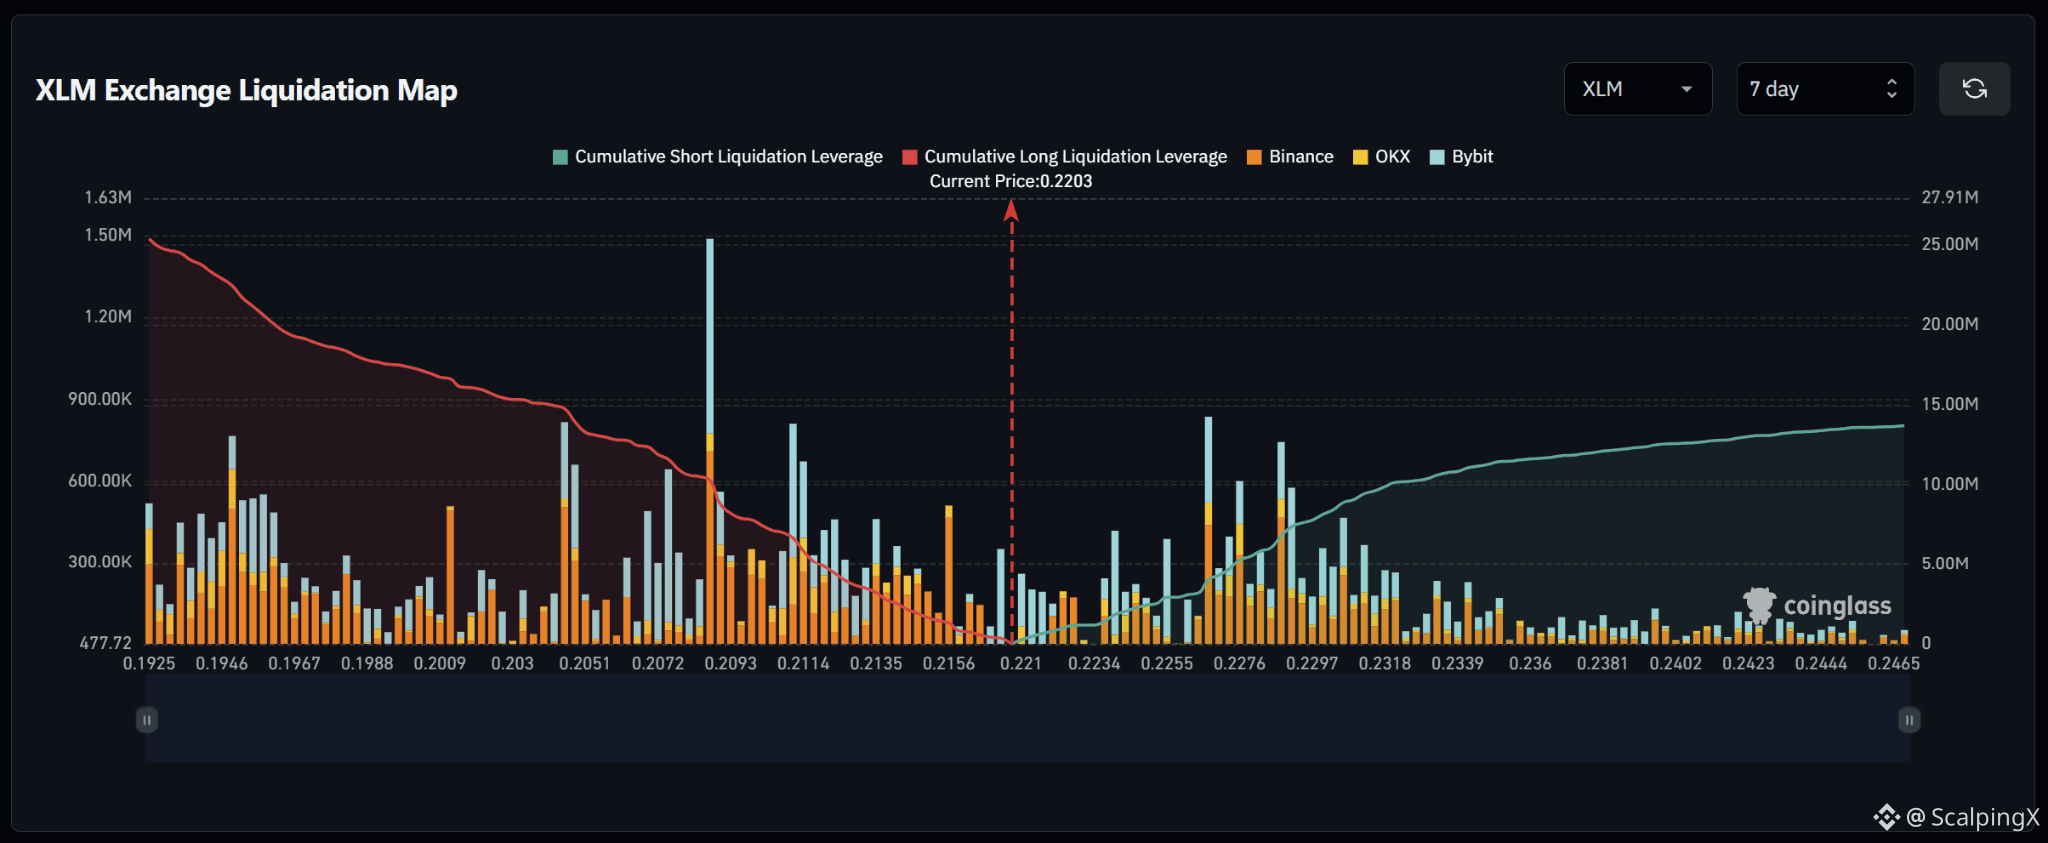
$XLM – Liquidation Map (7 Days) – Current Price 0.2203
🔎 The 7-day liquidation map shows roughly 25 million USD in long liquidations below the current price, significantly exceeding approximately 14 million USD in short liquidations above. The liquidity structure therefore favors the downside, with around 1.8 times more cumulative liquidity below the market.
📉 Below the market, long-liquidation liquidity is concentrated heavily across 0.205–0.214. The strongest cluster sits around 0.208–0.209 with a bar near 1.5 million USD; 0.211–0.212 also contains a bar around 0.8 million USD, while 0.204–0.205 holds another cluster above 0.8 million USD. Losing 0.216 would shift attention toward 0.214–0.211 and then 0.209–0.205.
📈 Above the market, short-liquidation liquidity is concentrated mainly across 0.225–0.231. The strongest cluster sits around 0.226–0.227 with a bar near 0.8 million USD, while 0.228–0.230 contains several bars around 0.6–0.75 million USD. Above 0.232, liquidity density declines noticeably.
🧭 The broader setup still favors the downside because long-liquidation exposure below is meaningfully larger. Losing 0.216 would increase the probability of a sweep toward 0.214–0.211, followed by 0.209–0.205. Breaking above 0.223 would instead expose 0.226–0.230 before price enters a thinner liquidity zone.
🔎 The 7-day liquidation map shows roughly 25 million USD in long liquidations below the current price, significantly exceeding approximately 14 million USD in short liquidations above. The liquidity structure therefore favors the downside, with around 1.8 times more cumulative liquidity below the market.
📉 Below the market, long-liquidation liquidity is concentrated heavily across 0.205–0.214. The strongest cluster sits around 0.208–0.209 with a bar near 1.5 million USD; 0.211–0.212 also contains a bar around 0.8 million USD, while 0.204–0.205 holds another cluster above 0.8 million USD. Losing 0.216 would shift attention toward 0.214–0.211 and then 0.209–0.205.
📈 Above the market, short-liquidation liquidity is concentrated mainly across 0.225–0.231. The strongest cluster sits around 0.226–0.227 with a bar near 0.8 million USD, while 0.228–0.230 contains several bars around 0.6–0.75 million USD. Above 0.232, liquidity density declines noticeably.
🧭 The broader setup still favors the downside because long-liquidation exposure below is meaningfully larger. Losing 0.216 would increase the probability of a sweep toward 0.214–0.211, followed by 0.209–0.205. Breaking above 0.223 would instead expose 0.226–0.230 before price enters a thinner liquidity zone.