

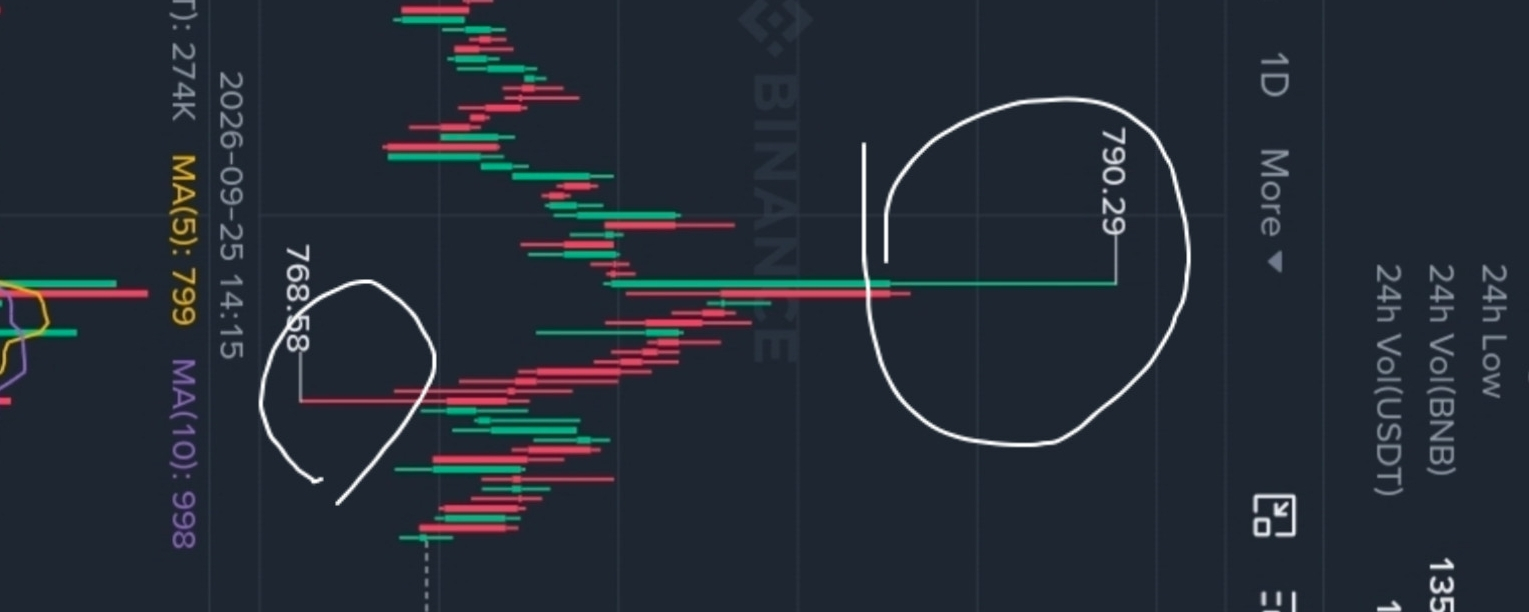

Based on the chart you shared, $BNB B is showing short-term bearish/weak momentum.
Current price: ~$771.92
24h high: $790.29
24h low: $768.58
Price made a sharp spike toward $790.29, but that move was rejected strongly.
After the rejection, the chart formed lower highs and lower lows, indicating sellers currently have more control.
The large volume spike around the $790 area suggests strong activity during the breakout/rejection.
Key levels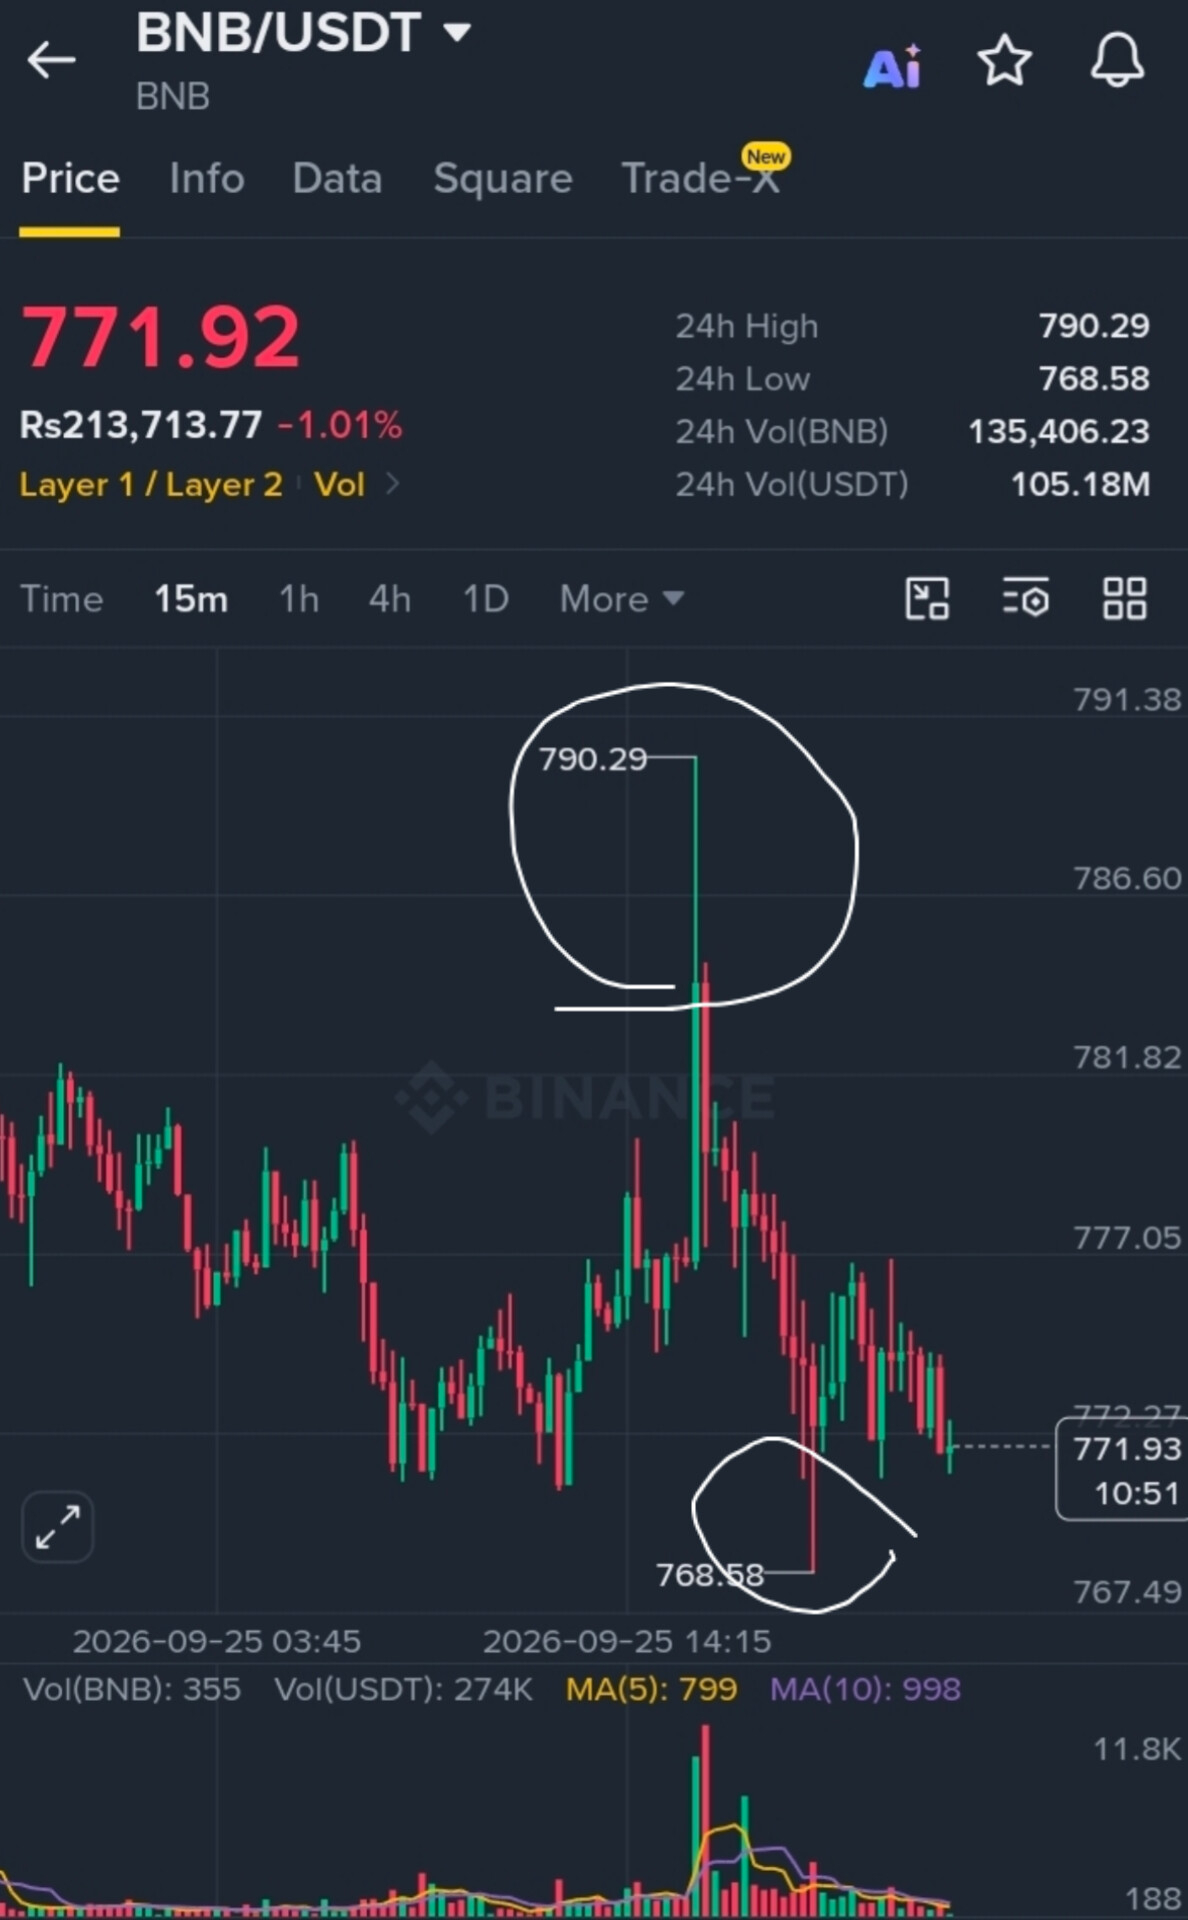
Resistance:
$777–$778 — immediate resistance
$781.80 — stronger resistance
$786.60–$790.30 — major resistance zone
Support:
$768.58 — important support
$767.50 — nearby chart support
Possible scenarios
Bullish: If $BNB gets back above $777–$778 and holds it, the next areas to watch are $781.80 → $786.60 → $790.30.
Bearish: If price breaks and holds below $768.58, the short-term structure could weaken further.
Overall: On this 15-minute screenshot, the structure is bearish/sideways near support, but $768–$769 is an important area. A break above $778 or below $768.58 would provide a clearer short-term direction.