



Healthcare Triangle (HCTI) stock is experiencing one of its most volatile sessions in recent memory. Shares swung from $1.28 to $3.07 intraday, with the daily close still unconfirmed near $1.60. Extreme overbought signals now clash with a neutral daily structure.
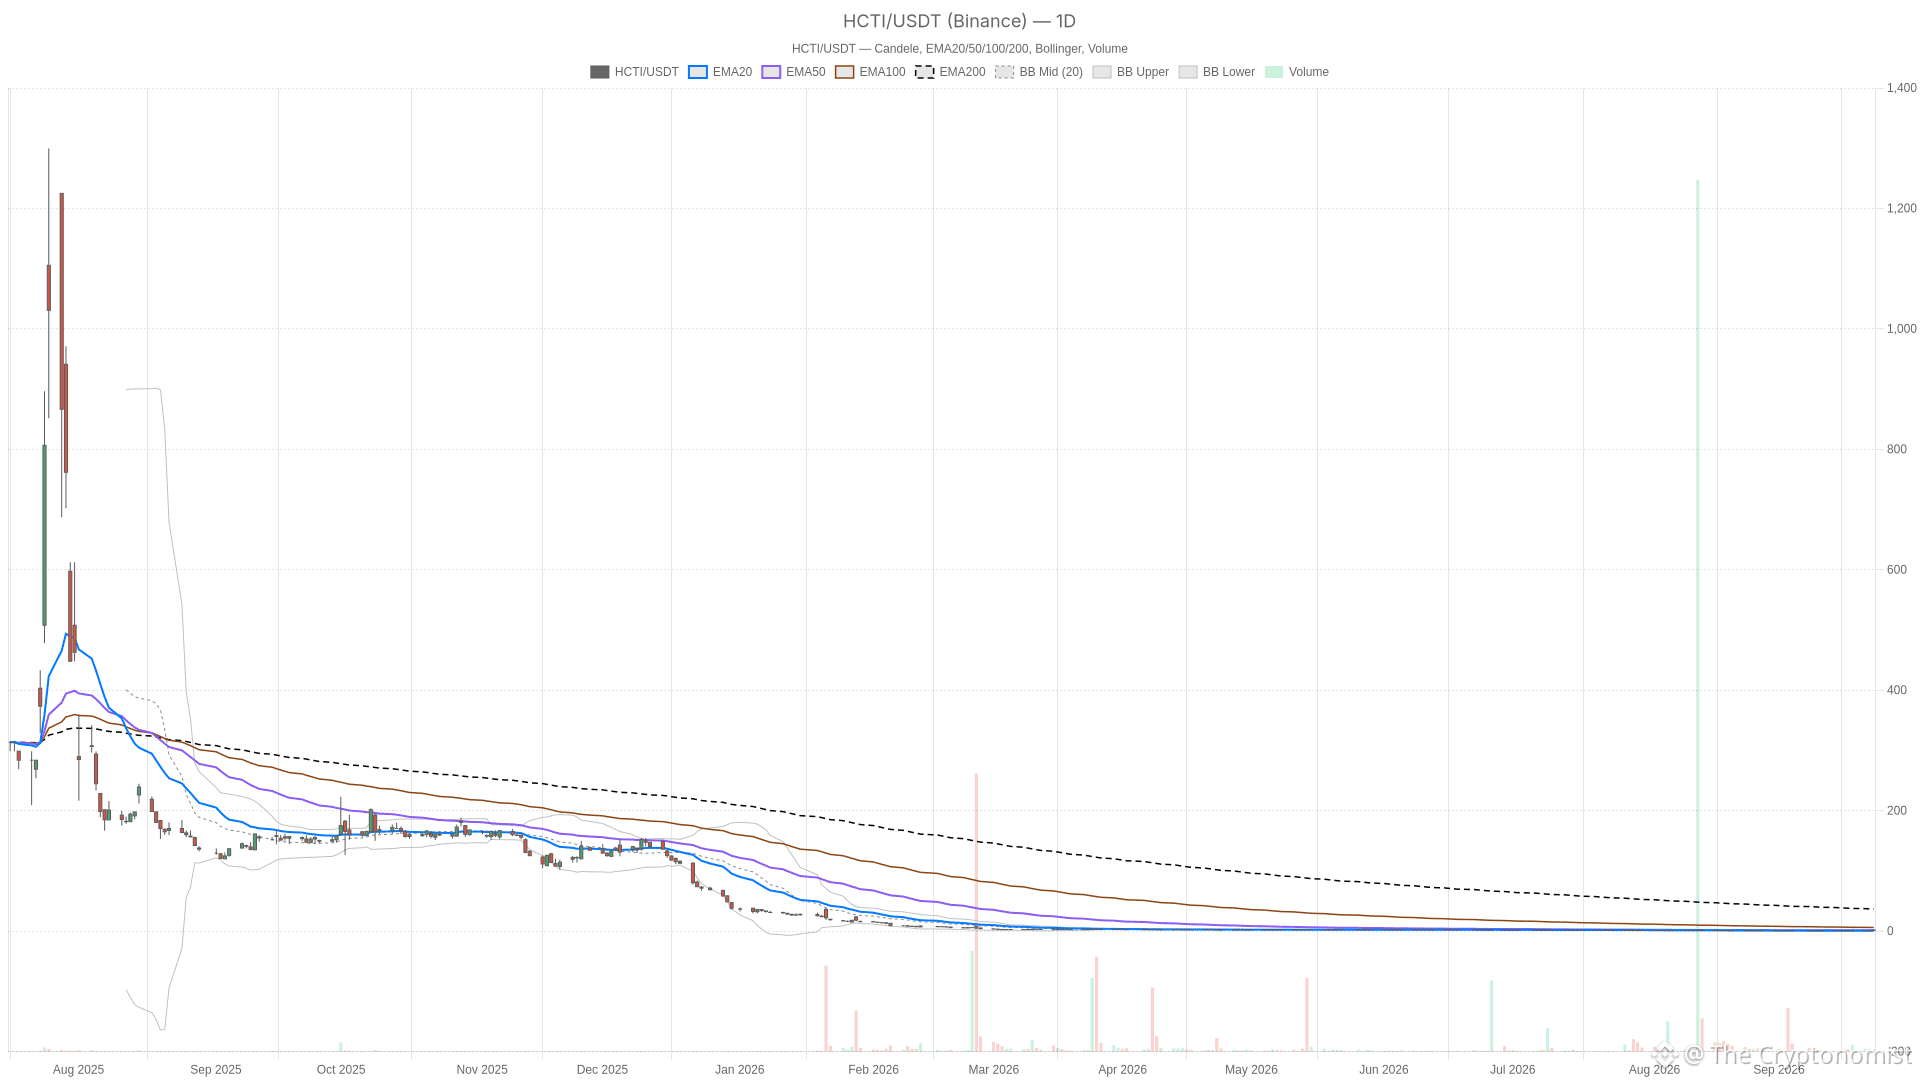 HCTI — daily chart with candlesticks, EMA20/EMA50 and volume.
Key takeaways
Healthcare Triangle (HCTI) intraday range hit $1.28–$3.07, far exceeding its typical daily range.
Daily RSI14 stands at 76.3 in overbought territory, while the 1-hour RSI14 has reached an extreme 95.65.
Price trades well above the daily Bollinger upper band at $1.20 and the 1-hour upper band at $1.46.
The 200-day EMA sits at $36.64, underscoring a severe multi-year decline despite the short-term spike.
Daily MACD has not confirmed a bullish trend reversal, with the MACD line still negative at -0.03.
Healthcare Triangle Daily Chart: How Stretched Is Price?
The daily chart shows Healthcare Triangle stock trading at a fraction of its 200-day EMA. That long-term average sits at $36.64, and the gap reflects a severe multi-year decline rather than a recent event. Daily RSI14 at 76.3 confirms overbought conditions.
The most striking feature on the daily chart is not the spike itself, but the distance between price and the long-term average. Notably, Healthcare Triangle stock trades at a small fraction of its moving average. Therefore, any short-term rally, however sharp, must be read against that backdrop.
Meanwhile, the daily MACD histogram has turned positive at 0.09, hinting at emerging upside momentum. However, the MACD line itself remains negative at -0.03, though it sits above its signal line of -0.12. Still, that combination is telling. Momentum is improving, but the broader daily trend has not fully flipped bullish yet.
Price has also pushed above the daily Bollinger upper band at $1.20. Trading above the upper band typically signals an overextended move rather than a stable trend.
1-Hour Chart: How Extreme Are Healthcare Triangle’s Overbought Signals?
The 1-hour chart reveals extreme overbought conditions for Healthcare Triangle. RSI14 has reached 95.65, and price trades well above the Bollinger upper band of $1.46.
On the 1-hour chart, the picture becomes more aggressive. The H1 MACD line sits at 0.13, above its signal at 0.04, confirming short-term bullish momentum. However, price is also trading at $2.15, well above the H1 Bollinger upper band. This is a clear sign of an overheated short-term move, even as directional momentum stays positive.
All three H1 EMAs sit tightly clustered well below current price. EMA20 is at $0.93, EMA50 at $0.83, and EMA200 at $0.92. In turn, that clustering shows how quickly this spike has detached price from its recent average levels. Similarly, the daily EMA20 at $0.91 and EMA50 at $1.26 remain far beneath the last daily close. Overall, the same message echoes across timeframes: this is an unusually stretched move.
15-Minute Chart: What Is the Near-Term Execution Context?
The 15-minute chart confirms buyers remain in control for Healthcare Triangle. RSI14 reads 75.78, and the MACD histogram is positive at 0.17.
On the 15-minute chart, the regime is explicitly labeled bullish. RSI14, while elevated, is slightly less extreme than the H1 reading. Price at $2.15 sits just above the 15m Bollinger upper band of $2.09. Therefore, for short-term execution, this confirms buyers remain in control. Still, the room for further upside without a pause looks limited.
Pivot Levels Frame the Battle Zone
Pivot levels add useful context for near-term positioning. On the daily timeframe, resistance sits at R1 of $2.69, with support at S1 of $0.90. Meanwhile, the 1-hour pivot resistance stands higher, at $3.14, while its support level is $1.10. The 15-minute pivot places resistance at $2.85 and support at $1.68. Together, these levels frame a wide but well-defined battle zone for the next several sessions.
Bullish Scenario: What Would Sustain a Healthcare Triangle Rally?
A bullish continuation for Healthcare Triangle stock would require price to hold above two key levels. These are the 15-minute EMA20 near $1.21 and the H1 EMA20 near $0.93.
Sustained closes above the daily pivot at $1.98 would strengthen the case for a push toward the daily R1 at $2.69. From there, the next target would be the H1 R1 at $3.14. For that scenario to unfold, the daily MACD line would ideally need to cross back above its signal line. That would confirm momentum has genuinely turned rather than just bounced. Volume would also need to stay elevated, echoing the 115,577 shares traded on the daily candle so far.
Bearish Scenario: What Could Trigger a Mean Reversion?
The bearish case for Healthcare Triangle rests on mean reversion from extreme conditions. RSI readings above 90 on the H1 chart have historically been associated with pullbacks.
Moreover, RSI readings above 75 on both the daily and 15-minute charts reinforce the overbought signal. Consequently, a drop back below the daily S1 at $0.90 would invalidate the bullish scenario. A break under the H1 EMA200 near $0.92 would do the same. In that case, price could retrace toward the Bollinger mid-bands. Notably, those levels sit near $0.83 on the daily chart and $0.87 on the H1 chart. In effect, such a move would erase much of the recent spike.
Final Take: Where Does Healthcare Triangle Stock Stand?
Healthcare Triangle (HCTI) is caught between two conflicting forces. A powerful short-term bullish push clashes with a daily structure that has not fully confirmed the move.
Volatility, as measured by ATR readings between 0.18 and 0.23 across timeframes, is elevated. However, it does not fully capture the scale of today’s intraday range. Overall, positioning here calls for caution rather than conviction. Until the daily candle closes and confirms direction, both bullish and bearish outcomes remain plausible. Traders should treat current levels as a battleground rather than a settled trend.
FAQ
Why is Healthcare Triangle (HCTI) stock so volatile today?
Healthcare Triangle shares have swung from $1.28 to $3.07 intraday, a range far exceeding its typical daily movement. The stock is experiencing a clash between a violent short-term rally and an unconfirmed daily structure, creating extreme volatility.
Is Healthcare Triangle stock overbought?
Yes, across multiple timeframes. The daily RSI14 is at 76.3, the 1-hour RSI14 has reached an extreme 95.65, and the 15-minute RSI14 reads 75.78. All three readings sit firmly in overbought territory.
What are the key support and resistance levels for HCTI?
Key resistance levels include the daily R1 at $2.69, the 15-minute pivot resistance at $2.85, and the 1-hour R1 at $3.14. Key support levels include the daily S1 at $0.90 and the 1-hour support at $1.10.
Has the daily trend turned bullish for Healthcare Triangle?
Not yet. While momentum is improving, the daily MACD line remains negative at -0.03, though it sits above its signal line of -0.12. The broader daily trend has not fully confirmed a bullish reversal.
Disclaimer: This article is for informational purposes only and does not constitute financial advice, an investment recommendation, or a solicitation to buy or sell any financial instrument or cryptocurrency. The analysis provided is not indicative of future results. Investing in crypto assets and financial markets carries a high risk of capital loss. Always do your own research (DYOR) and consult a qualified financial advisor before making any decision.
Article produced with the assistance of artificial intelligence and reviewed by the editorial team.