
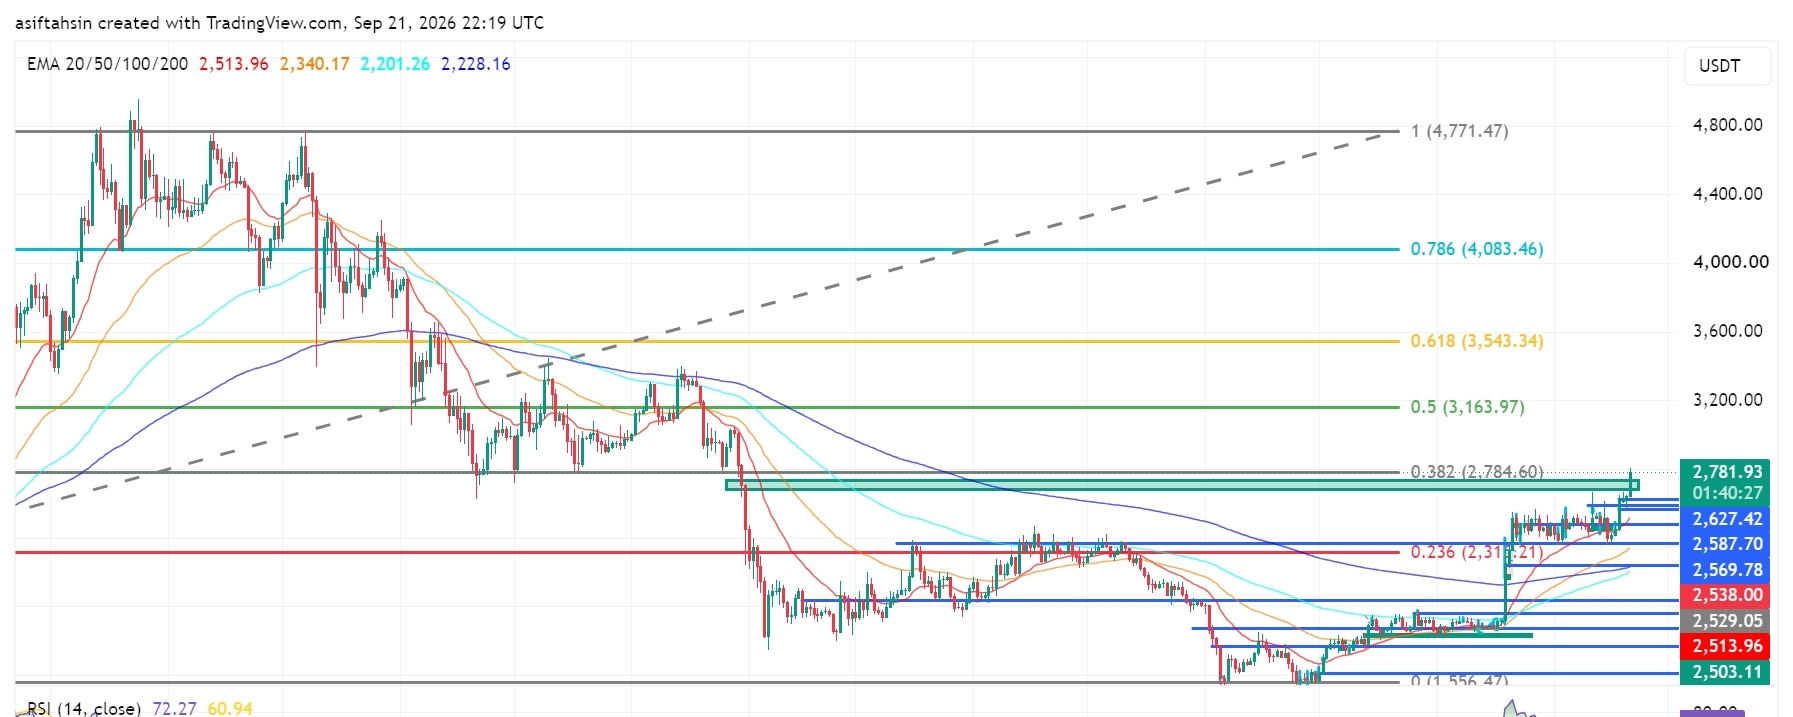

ETH is currently trading around $2,781.93, pushing into the major $2,784.60 Fibonacci resistance after a strong recovery from the $2,475–$2,500 area.
The broader structure has improved significantly, with ETH reclaiming the $2,500–$2,600 region and breaking above the previous consolidation range. A sustained breakout above $2,784.60 would bring the higher Fibonacci levels into focus.
📈 EMA Structure
20 EMA: $2,513.96
50 EMA: $2,340.17
100 EMA: $2,201.26
200 EMA: $2,228.16
ETH is trading well above all four major EMAs.
The 20 EMA remains above the 50 EMA, while the 100 EMA and 200 EMA are positioned significantly lower. This alignment reflects a strong recovery structure and improving medium-term momentum.
The $2,500–$2,540 region is now an important EMA/support zone.
📐 Fibonacci Levels
0.236: $2,315.21
0.382: $2,784.60
0.5: $3,163.97
0.618: $3,543.34
0.786: $4,083.46
1.0: $4,771.47
ETH is currently testing the 0.382 Fibonacci level at $2,784.60.
A clean breakout and sustained close above this level would shift attention toward $3,163.97, followed by the higher Fibonacci extensions.
🟢 Bullish Scenario
Immediate resistance sits around:
$2,784.60 → $2,800
A confirmed breakout above this area could open the path toward:
$3,163.97 → $3,543.34 → $4,083.46 → $4,771.47
The first major objective is the 0.5 Fibonacci level at $3,163.97. If ETH can establish support above $2,784.60 after the breakout, the recovery structure would become substantially stronger.
🔴 Pullback Scenario
Key support levels:
$2,672.47
$2,627.42
$2,587.70
$2,569.78
$2,538.00
$2,529.05
$2,513.96
$2,503.11
$2,479.06
$2,475.84
The $2,570–$2,630 zone is particularly important for a healthy retest.
Holding this area after a breakout would allow ETH to consolidate before another attempt higher. A deeper move below $2,500 would weaken the current breakout structure and bring the lower support zone back into focus.
🧠 Market Structure & Liquidity
Liquidity Sweep → Accumulation → Higher Lows → Breakout → Expansion → Retest → Consolidation → Continuation
ETH has transitioned from the prolonged decline into a clear recovery structure. The recent move above the $2,600–$2,670 region represents an important expansion phase, while the current move toward $2,784.60 is testing the next major structural resistance.
📊 RSI Momentum
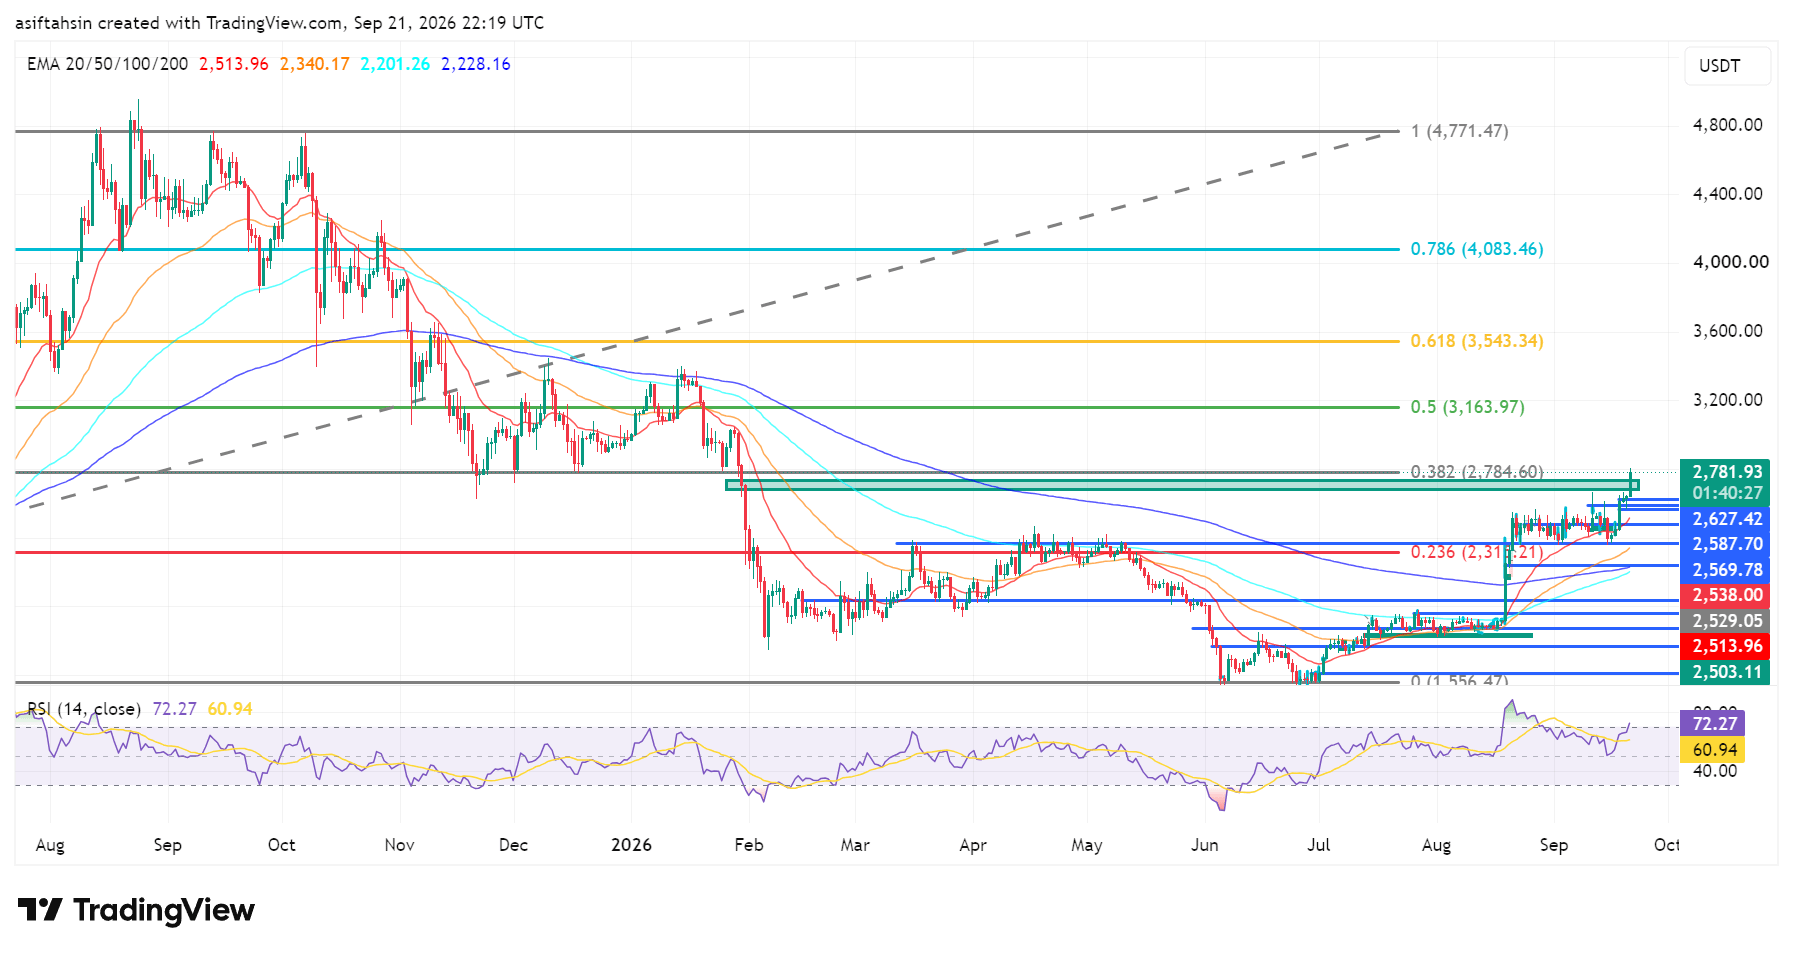
RSI: 72.27
RSI MA: 60.94
RSI has moved above 70, showing strong momentum but also indicating that ETH is entering an overbought zone on this chart.
That does not automatically mean a reversal; however, after such a strong expansion, a short-term consolidation or pullback would be technically normal before another continuation attempt.
🎯 Key Levels
Resistance:
$2,784.60 → $2,800 → $3,163.97 → $3,543.34 → $4,083.46 → $4,771.47
Support:
$2,672.47 → $2,627.42 → $2,587.70 → $2,569.78 → $2,538 → $2,513.96 → $2,503.11 → $2,479.06
Major EMA Support:
$2,513.96 / $2,340.17 / $2,228.16 / $2,201.26
📌 Final Outlook
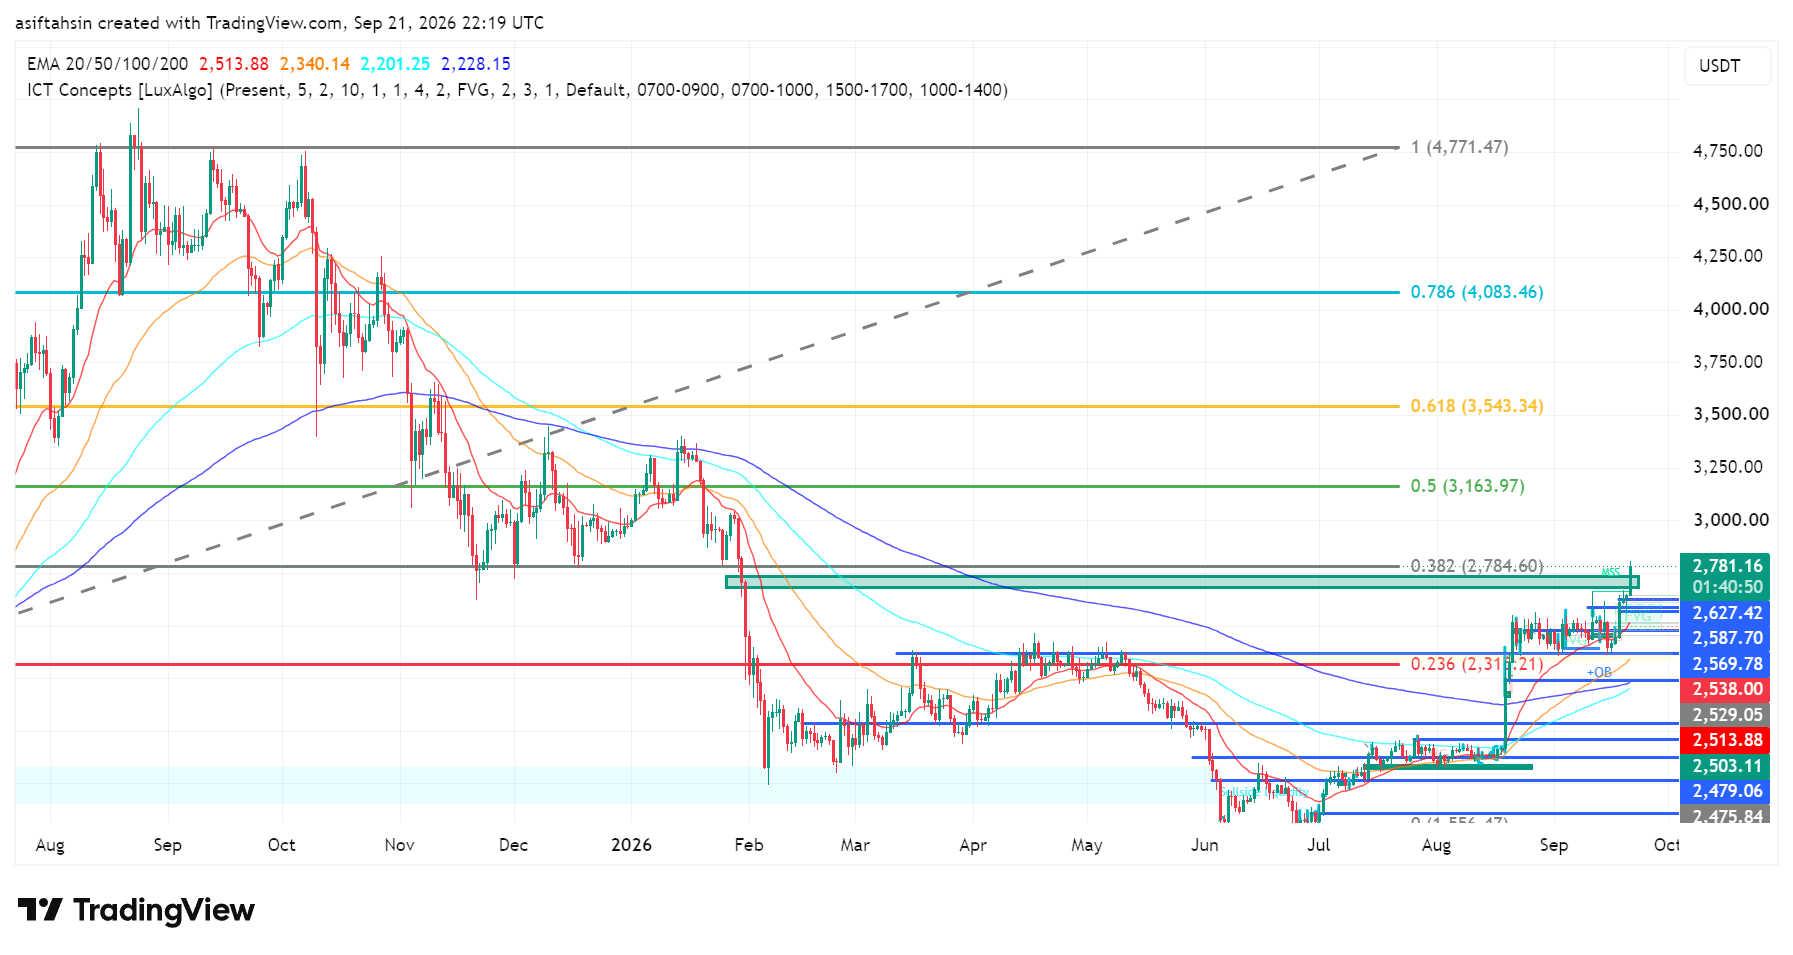
ETH has strengthened considerably after reclaiming the $2,500–$2,600 region and pushing toward the $2,784.60 Fibonacci resistance.
The key battle now is $2,784.60–$2,800.
A sustained breakout above this zone could open the path toward $3,163.97, followed by $3,543.34 and potentially $4,083.46.
On the downside, $2,570–$2,630 is the first major retest zone, while $2,500–$2,514 remains critical structural support.
Bias: Recovery structure remains strong above $2,500. A sustained breakout above $2,784.60 could open the path toward $3,163.97, with $3,543.34 as the next major Fibonacci level.
