



• Биткоин тормозит ниже уровня сопротивления $80 000, в то время как $77 000 обеспечивает краткосрочную поддержку.
• Ethereum корректируется в сторону зоны спроса $2 400, несмотря на $697 млн притоков в еженедельные ETF.
• XRP ускоряет снижение после затяжного ралли, определяемого перекупленностью по RSI.

В целом рынок криптовалют в понедельник корректируется, поскольку инвесторы переключают внимание на фиксацию прибыли после ралли на прошлой неделе. Биткоин (BTC) слегка снижается на фоне ограниченного потенциала роста ниже $80 000, при этом ближайшая поддержка находится на уровне $77 000.
Тем временем Ethereum (ETH) удерживается выше краткосрочной поддержки на уровне $2 400, но отстает от восходящего импульса, направленного к следующему ключевому сопротивлению на уровне $2 600. С другой стороны, Ripple (XRP) держится около $1,48, пока импульс остывает на фоне 72%-го роста на прошлой неделе — с $1,00 до максимумов около $1,70.
🗣️ ETF на Биткоин, Ethereum и XRP привлекают заметные притоки
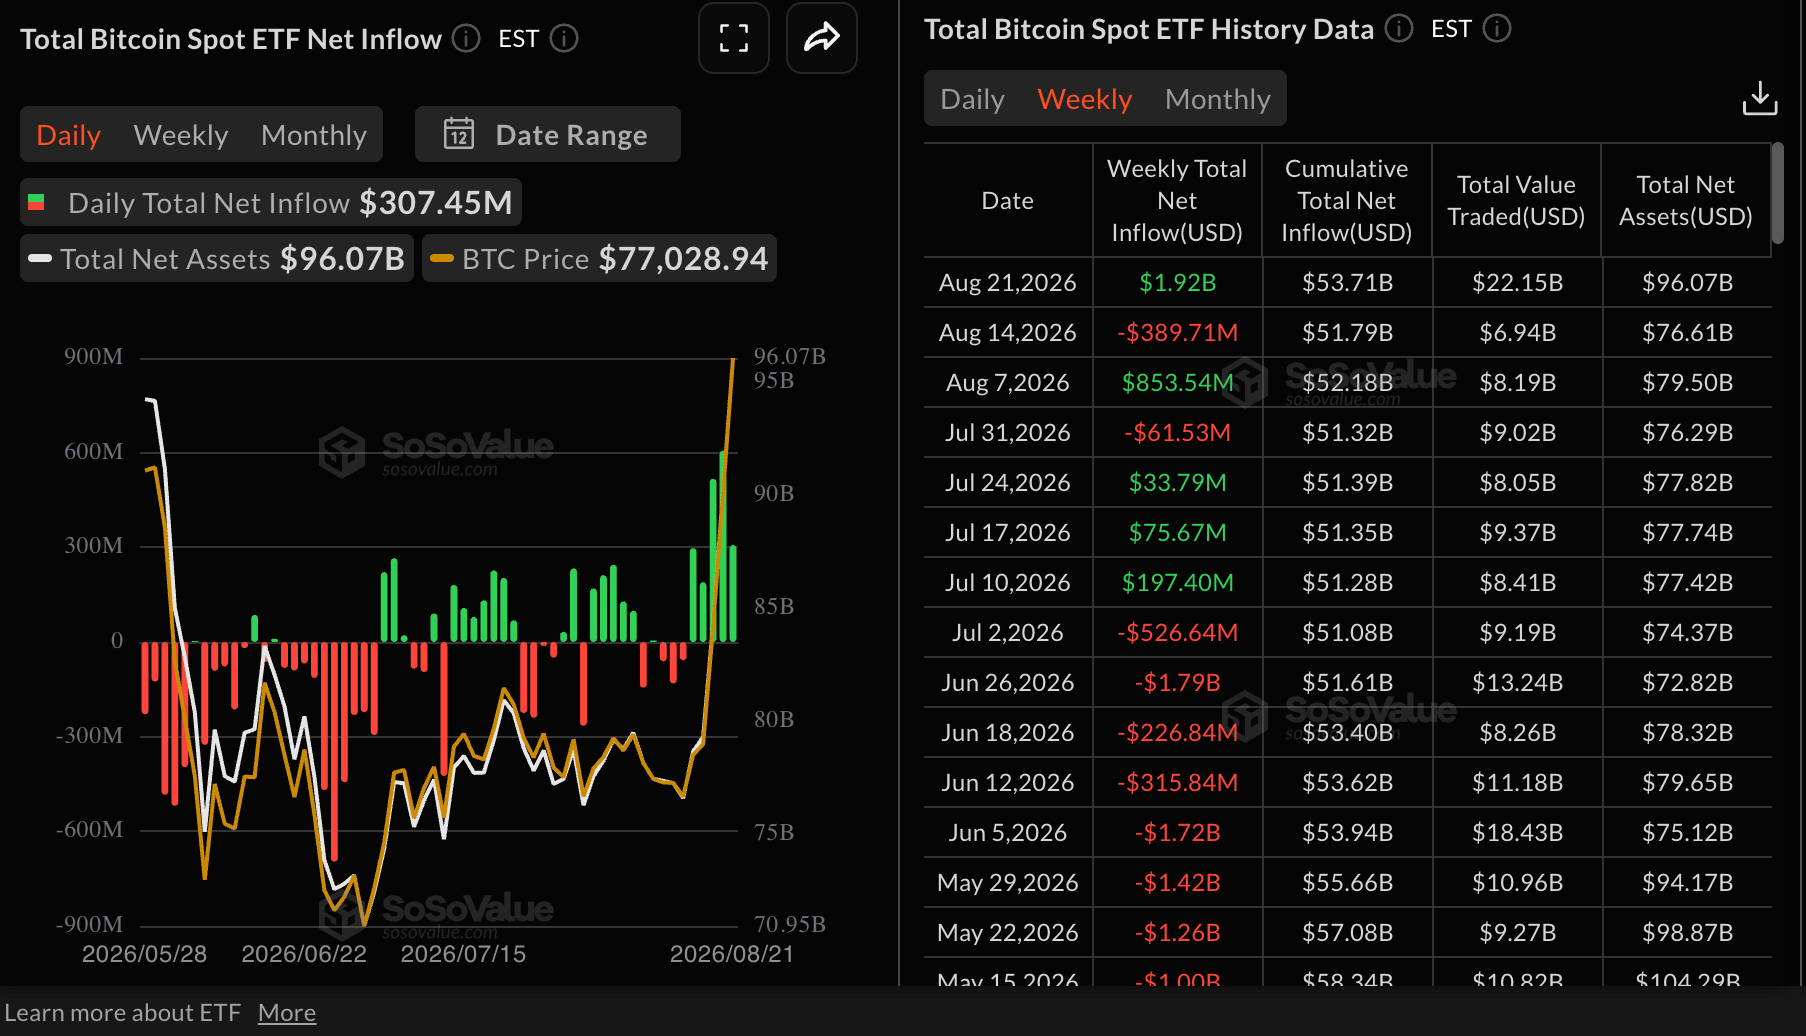
Спотовые биржевые фонды (ETF) на Биткоин зафиксировали заметный скачок притоков: за последнюю неделю к пятнице они составили $1,92 млрд. Это был крупнейший объем притоков с октября, поддерживая улучшающиеся настроения «risk-on». Кумулятивные притоки теперь составляют $53,71 млрд — с $51,79 млрд неделей ранее.
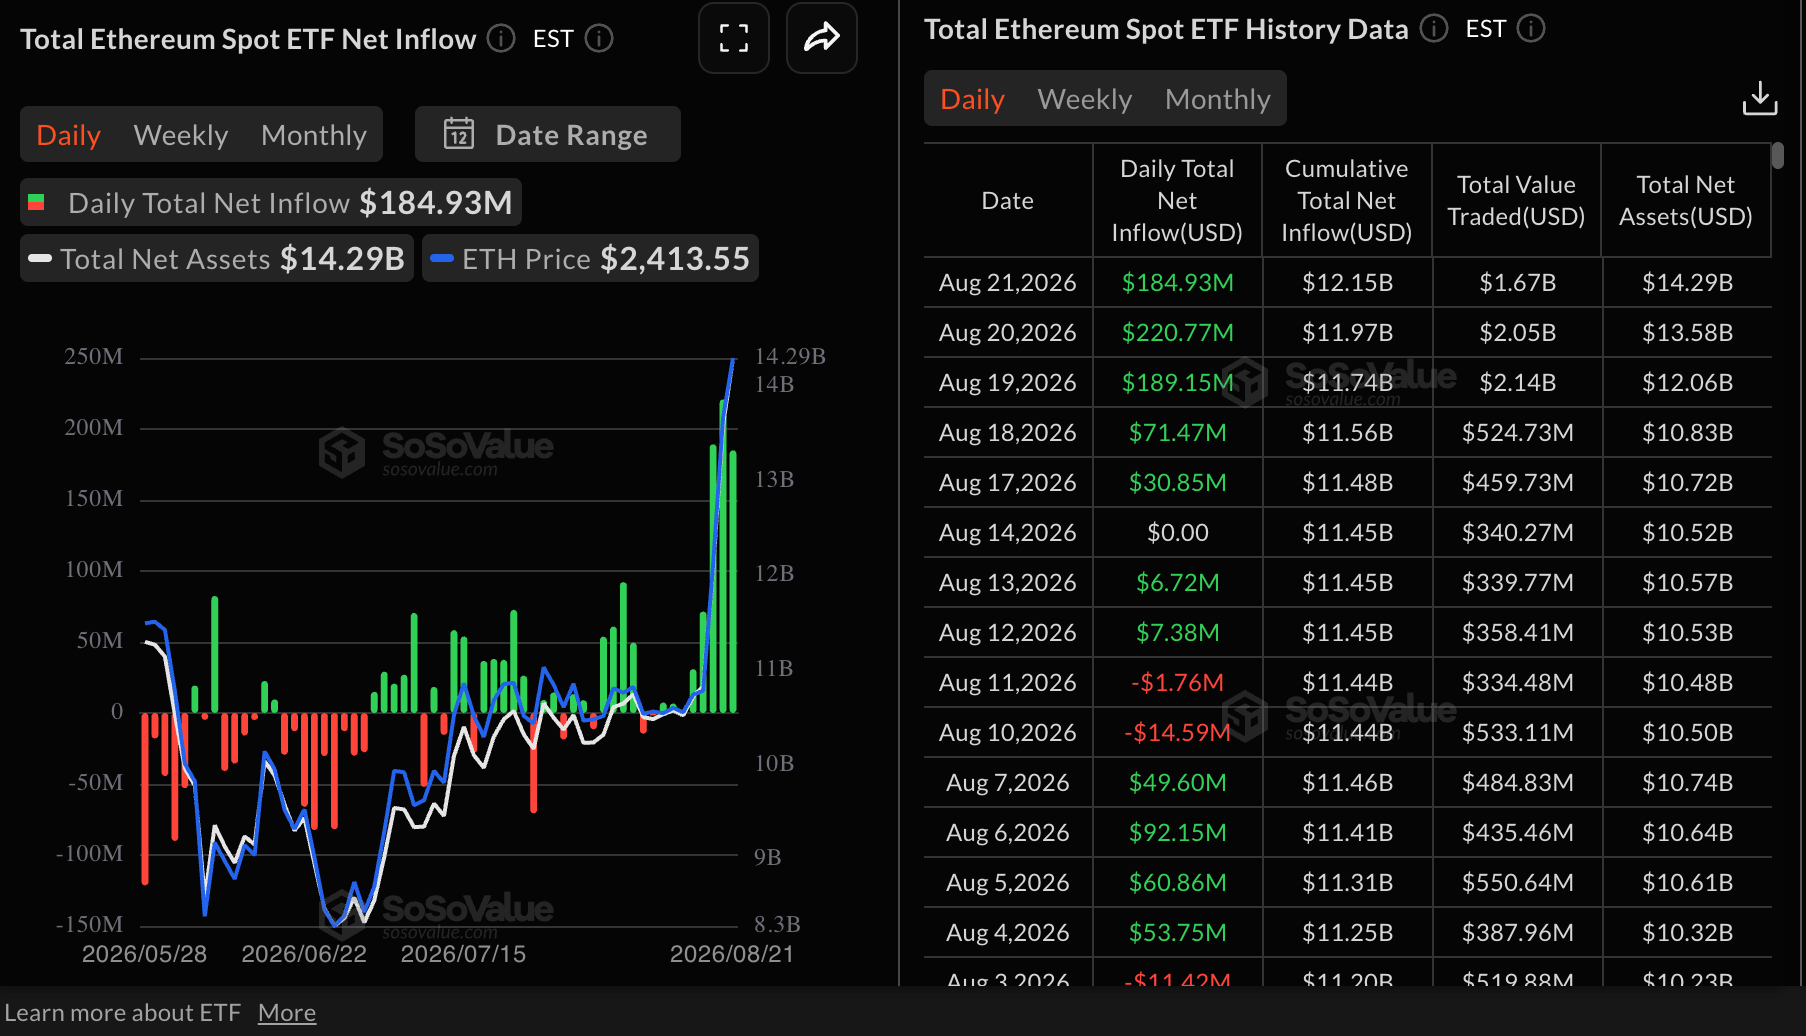
Спотовые ETF на Ethereum увидели возобновившийся спрос: притоки составили $697 млн к пятнице. Это означает резкий рост по сравнению примерно с $2,26 млн оттоков, зафиксированных неделей ранее. Тем временем кумулятивные притоки составляют $12,15 млрд — против $11,45 млрд неделей ранее.
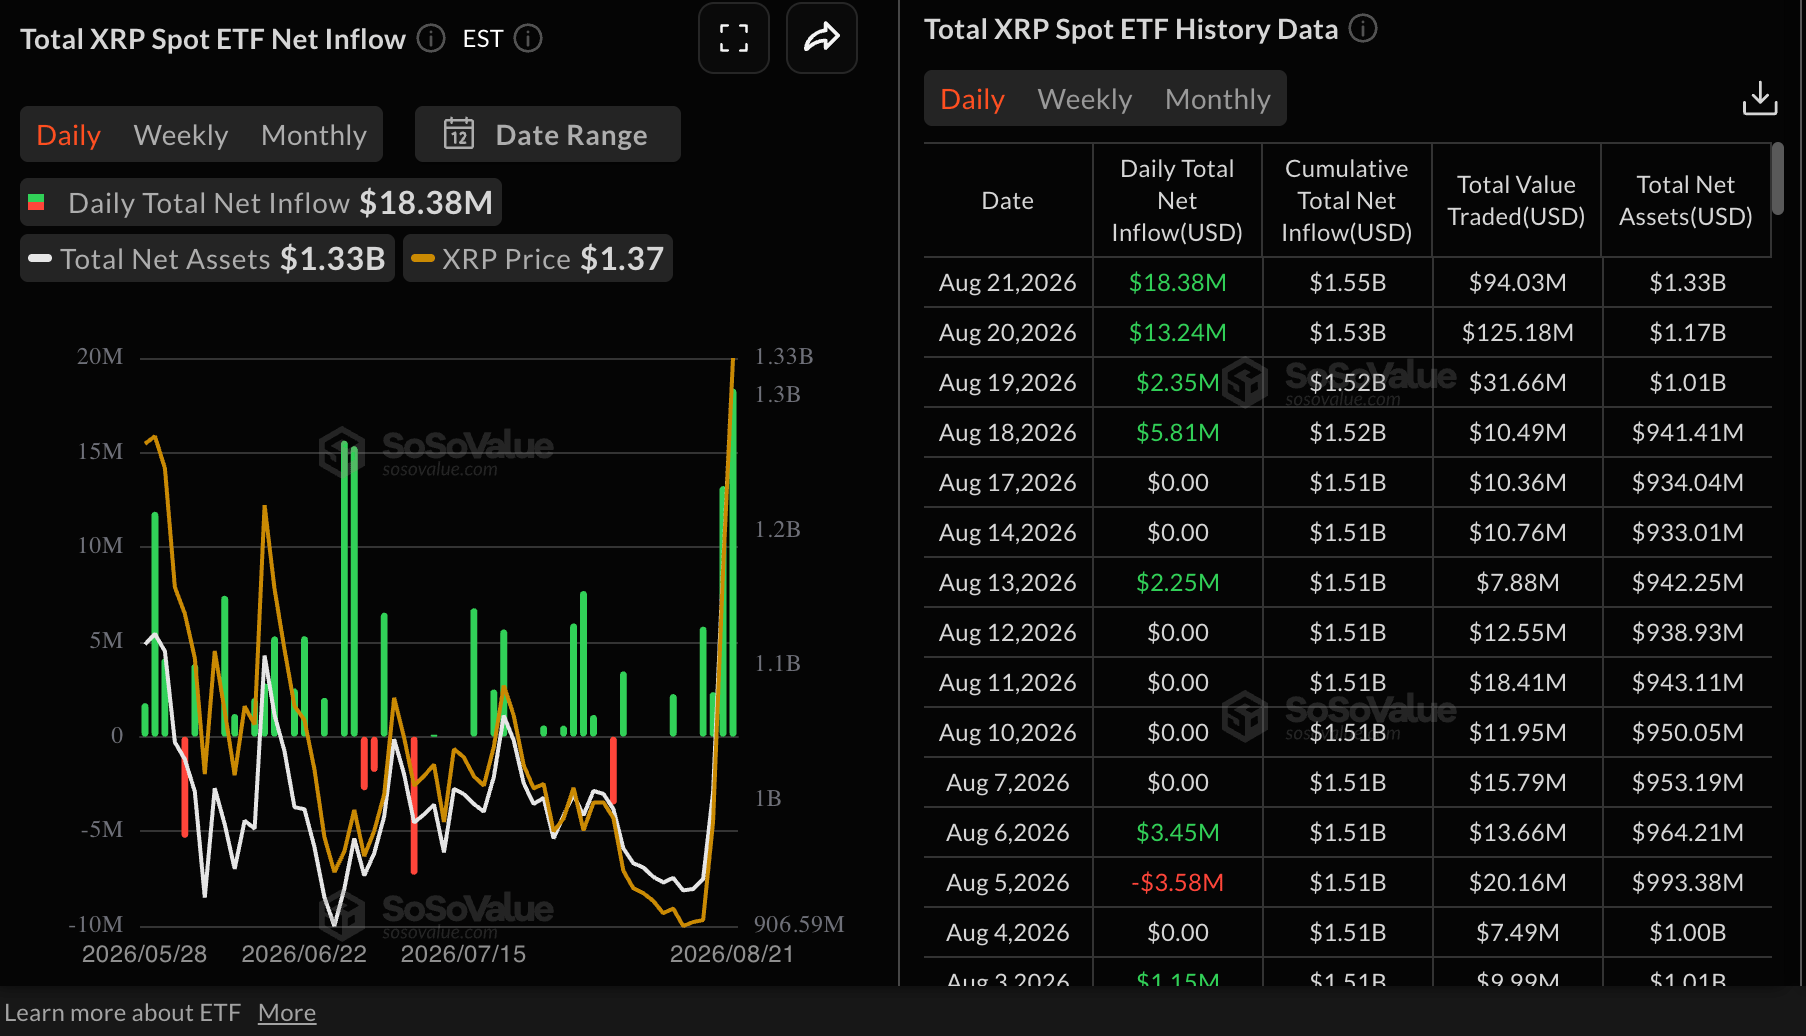
Институциональные инвесторы также проявляют больший интерес к XRP: притоки составили $40 млн к пятнице, что выше $2,25 млн неделей ранее. Согласно данным SoSoValue, средние кумулятивные притоки составляют $1,55 млрд, при этом общие активы под управлением — $1,33 млрд.
Если спрос будет устойчивым, рост интереса к продуктам для криптоинвестиций может повысить ожидания восстановления более широкого рынка. Однако трейдерам стоит умерить ожидания, поскольку фиксация прибыли может затормозить динамику и повысить вероятность более глубокой коррекции.
🚨Технический анализ: Биткоин буксует на фоне ограниченного потенциала роста
Биткоин торгуется по $77,240, удерживаясь значительно выше ключевых экспоненциальных скользящих средних (EMA) и сохраняя четкий бычий уклон на ближайшую перспективу. 50-дневная EMA на $66,777, 100-дневная EMA на $67,410 и 200-дневная EMA на $71,805 отстают от цены и подкрепляют хорошо поддерживаемый восходящий тренд, в то время как линия SuperTrend на $70,570 также располагается ниже спотовой цены, намекая на сохранность бычьей структуры.
Хотя Биткоин скорректировался от следующего ключевого уровня сопротивления около $80,000, импульс остается «натянутым»: индекс относительной силы (RSI) на уровне 78 находится в зоне перекупленности, а MACD выше нуля при сильном положительном гистограмме — это предполагает, что последняя волна роста может оказаться уязвимой для консолидации, а не для прямого продолжения вверх.
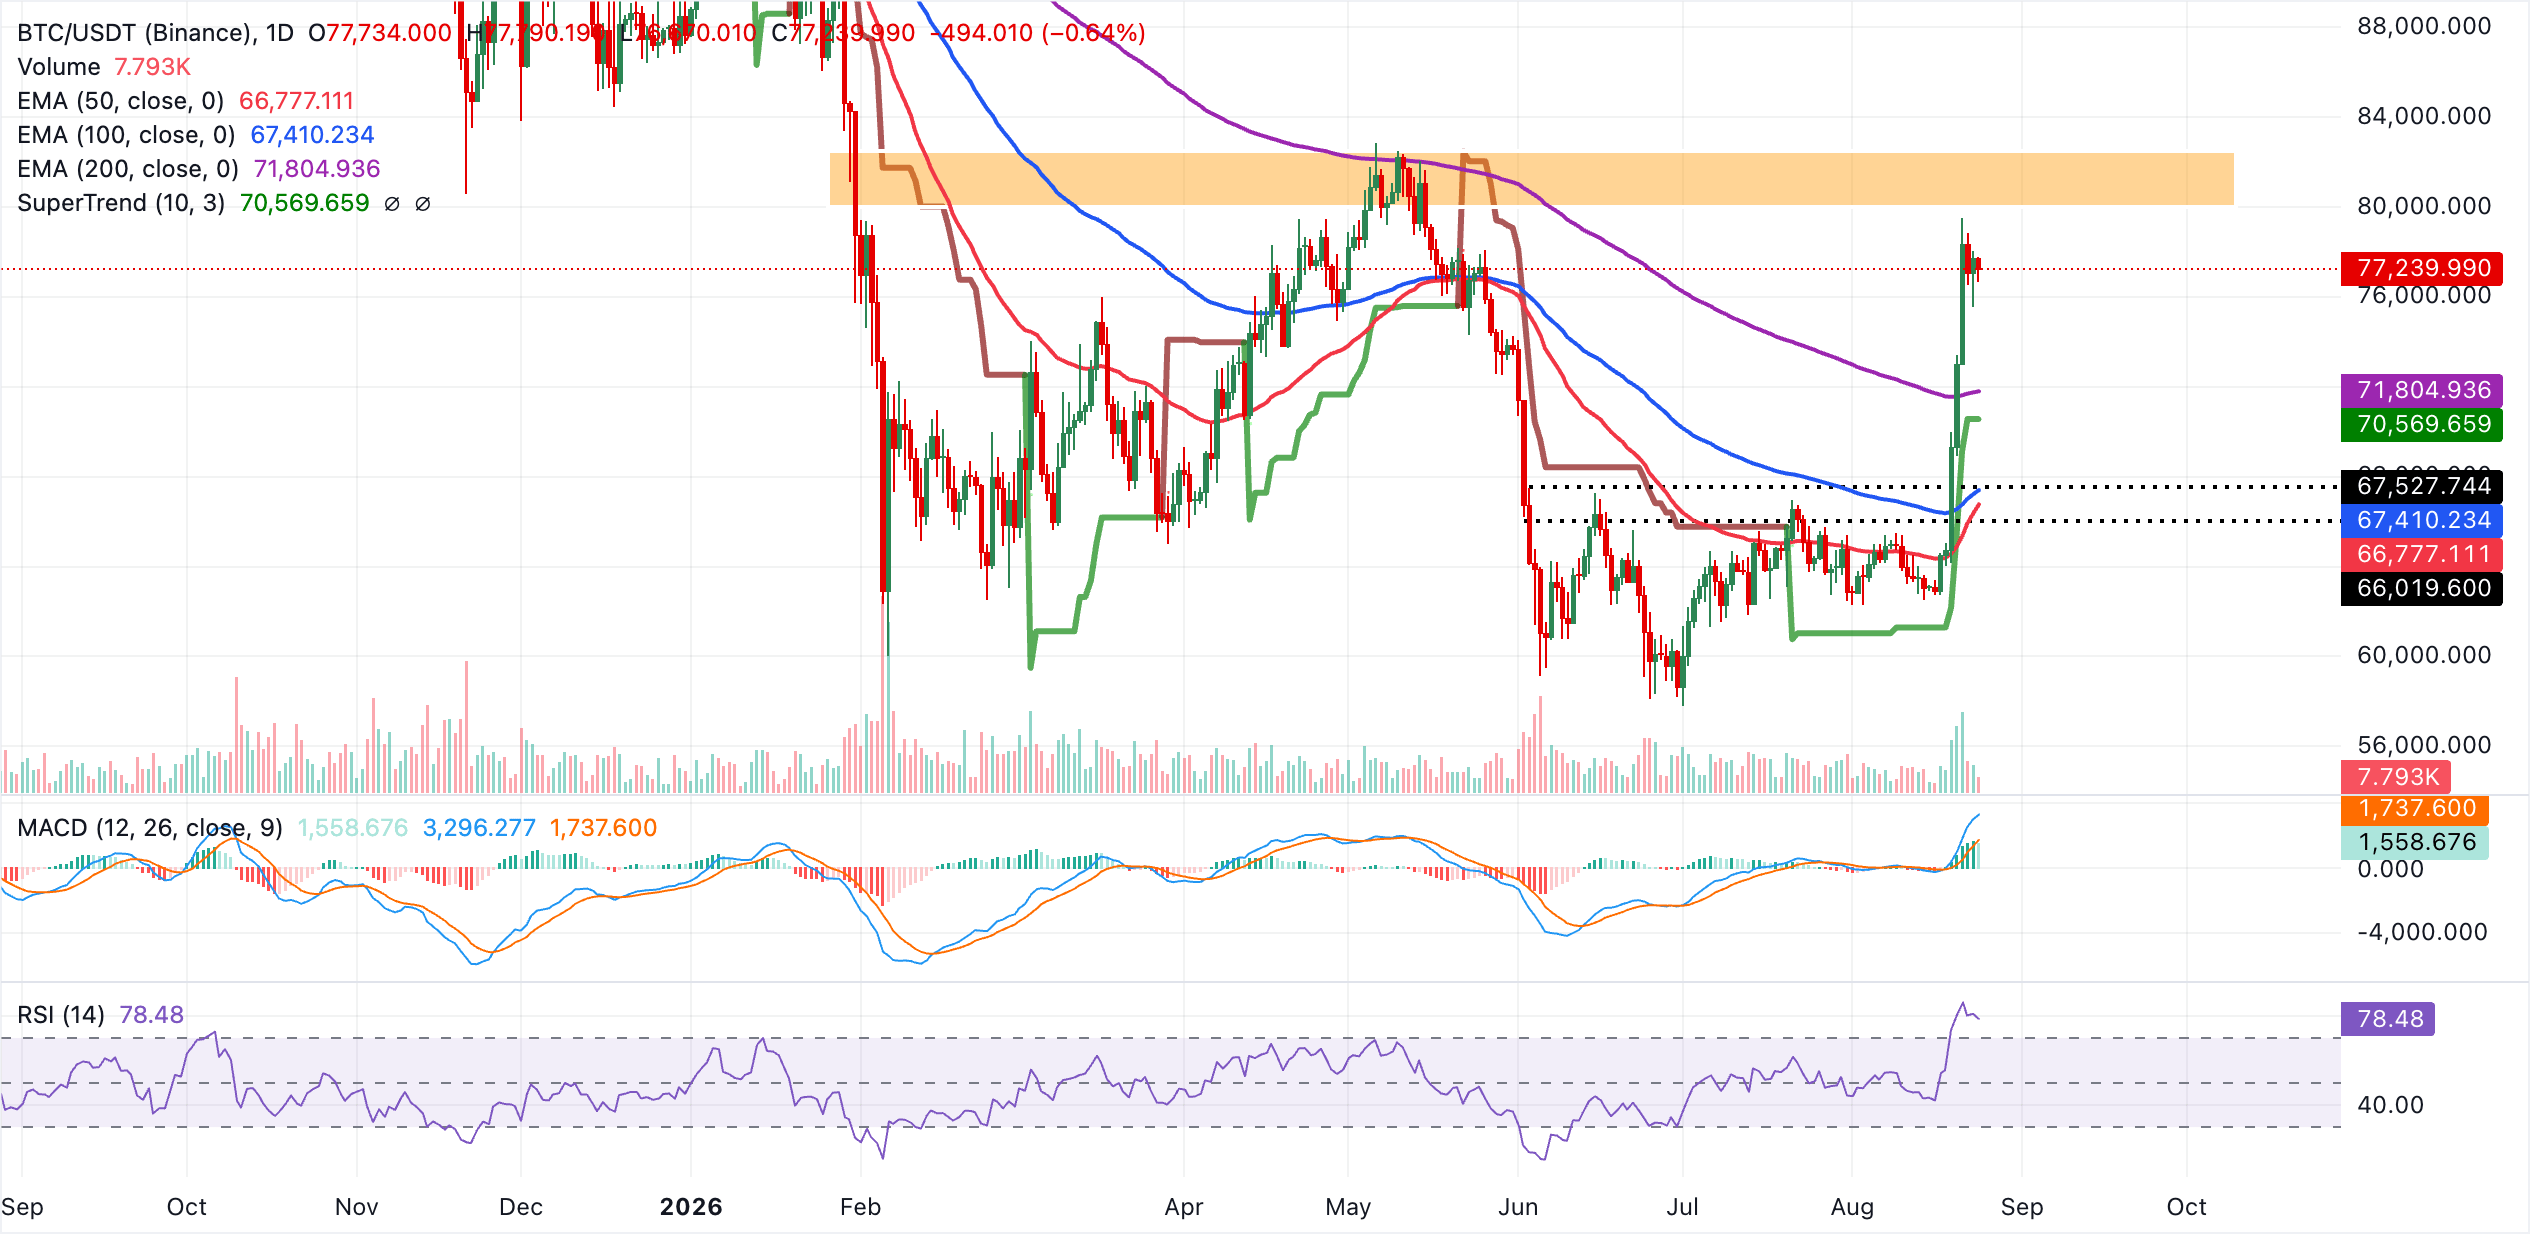
Ближайшая поддержка находится в текущем ценовом диапазоне около $77,000, впереди более «структурного» буфера на 200-дневной EMA примерно на $71,805. Ниже располагается линия SuperTrend на $70,570, а также сгруппированные 100-дневная и 50-дневная EMA на $67,410 и $66,777 — они формируют более широкую зону спроса, которая должна привлечь покупателей при более глубоких откатах. Сверху технически пространство остается открытым, однако перекупленный RSI и повышенные показания MACD предполагают, что новые длинные позиции лучше открывать во время откатов к указанным слоям поддержки, а не «догонять» цену на текущих максимумах.
📊😱 Перспективы альткоинов: Ethereum и XRP нацелены на более высокие уровни поддержки
Ethereum торгуется по $2,444, продолжая рост далеко выше ключевых скользящих средних, что сохраняет краткосрочный бычий уклон. Цена уверенно держится выше 50-дневной EMA примерно на $1,985 и 100-дневной EMA около $1,973, а также удерживает 200-дневную EMA на более длительном горизонте примерно на $2,141, что указывает на конструктивную структуру тренда.
Импульс остается сильным: MACD находится в положительной зоне, а RSI держится вблизи уровня перекупленности около 77, намекая, что давление вверх сохраняется, даже несмотря на то, что ралли начинает выглядеть «перегретым».
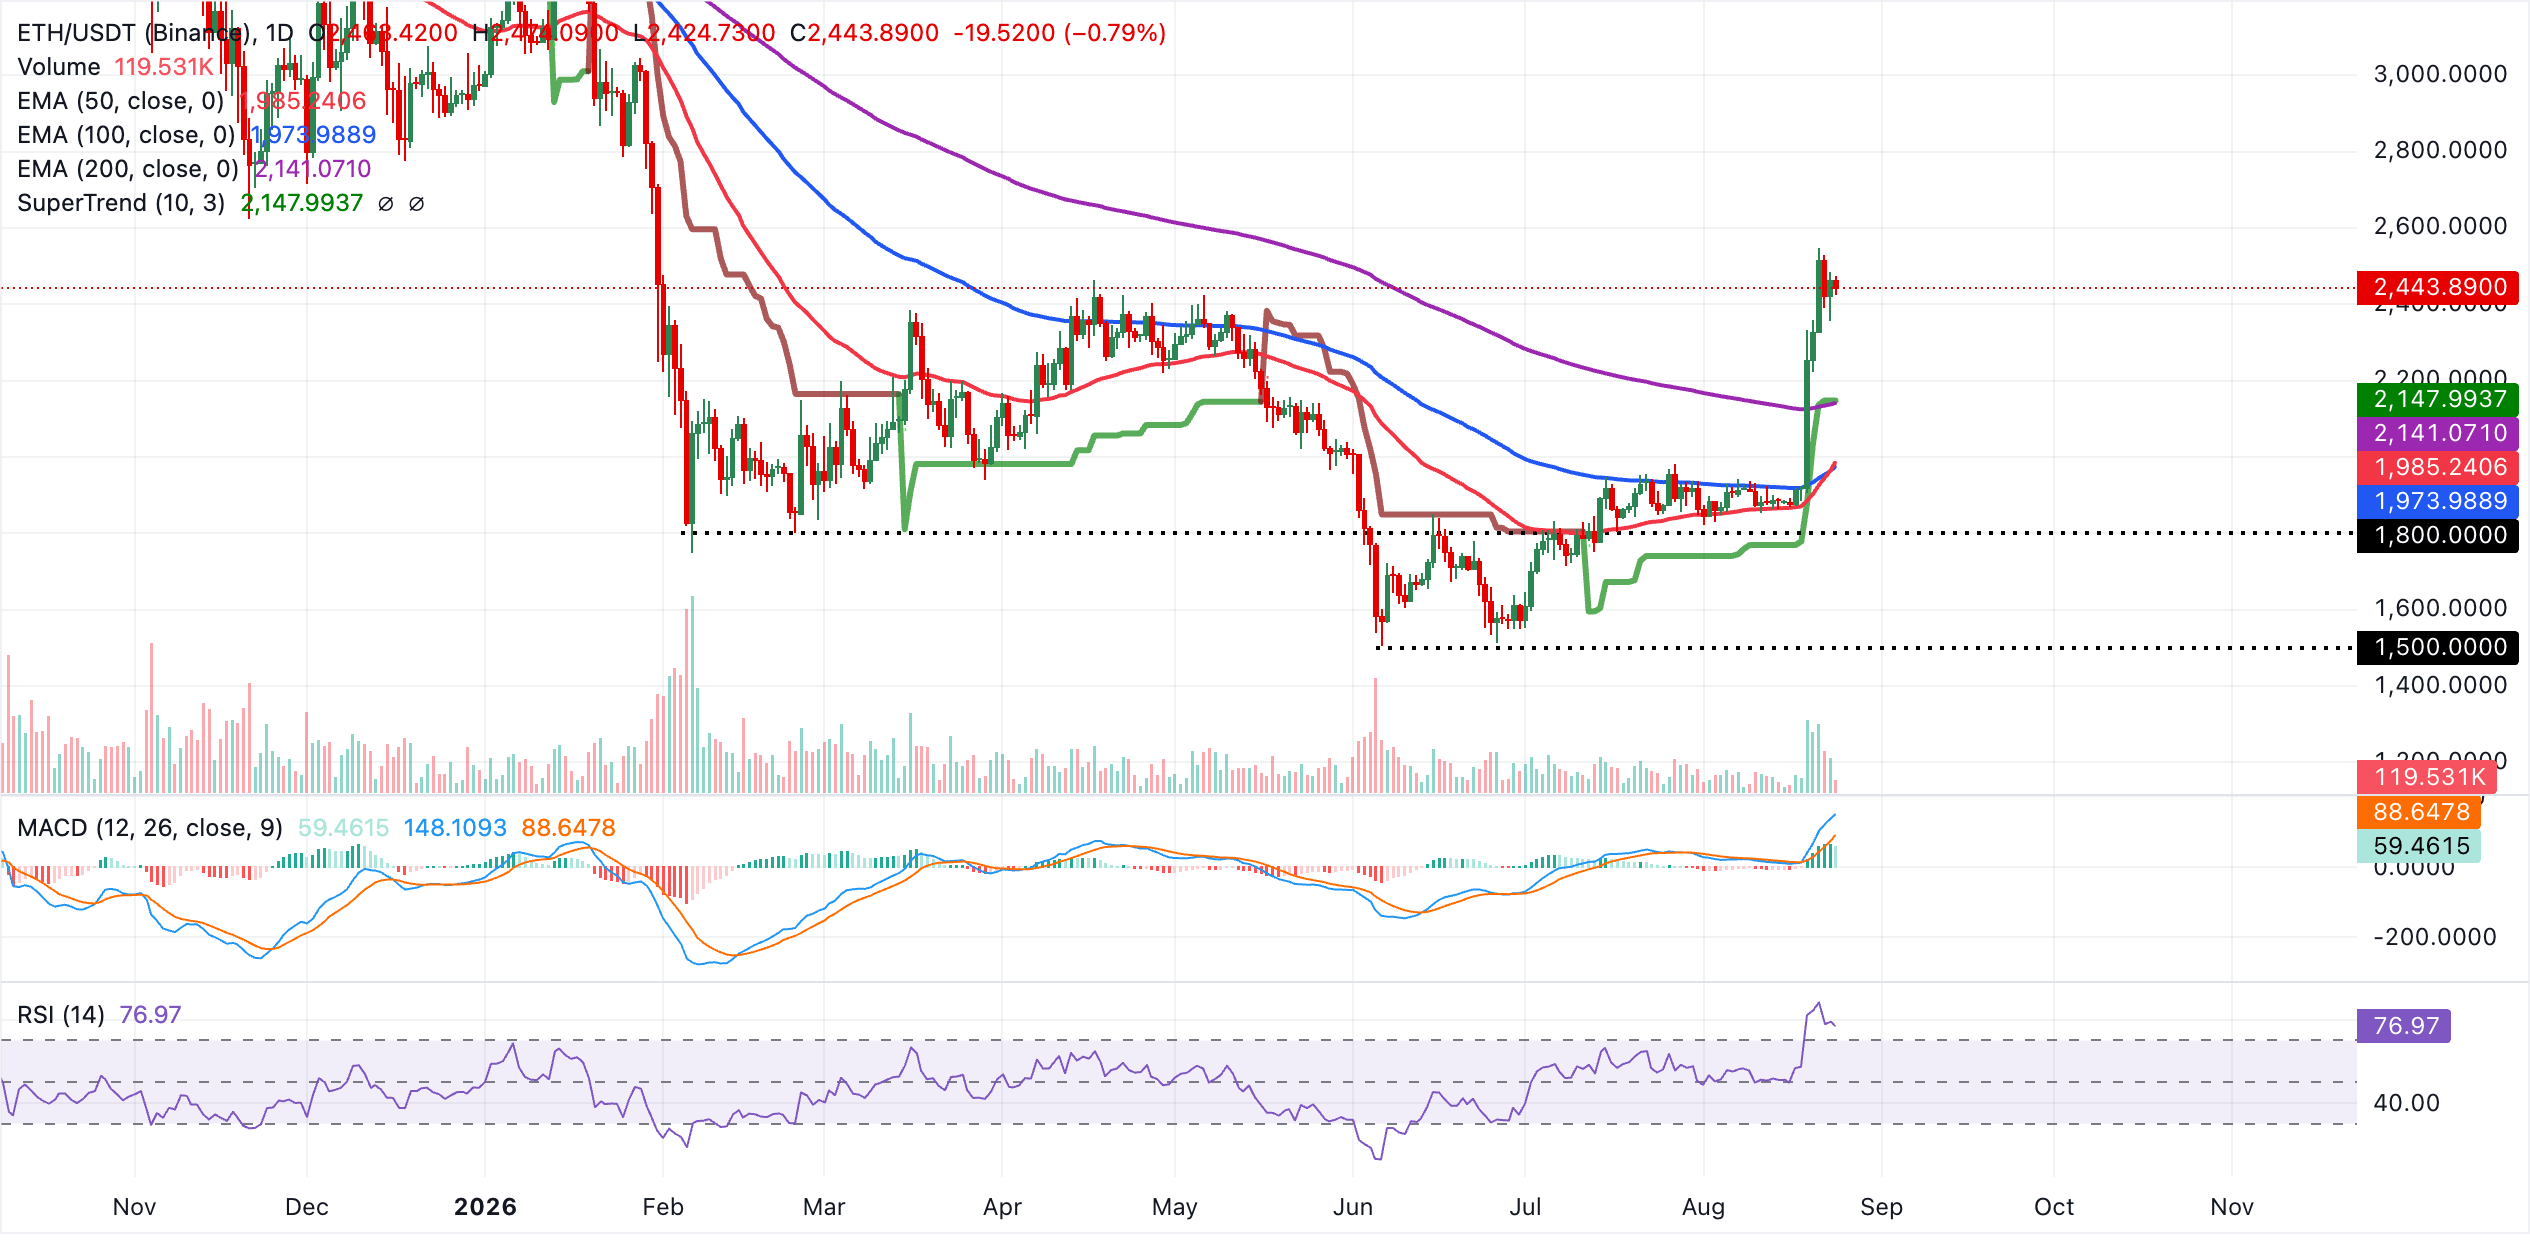
Непосредственная поддержка находится около $2,400, затем следует 200-дневная EMA на $2,141 — это более значимый структурный «пол». Ниже расположены 50-дневная EMA на $1,985 и 100-дневная EMA на $1,973, образующие плотный кластер поддержки, который должен привлечь покупателей при более глубоких откатах, если текущие условия перекупленности запустят коррекционную фазу. Между тем решающий пробой следующего уровня сопротивления на $2,600 может проложить путь к росту с целью $3,000.
С другой стороны, XRP торгуется по $1.45, продолжая резкий отскок и оставаясь значительно выше ключевых скользящих средних, что твердо смещает краткосрочный уклон в сторону бычьего сценария. Спотовая цена пробила вверх 50-дневную EMA на $1.14, 100-дневную EMA на $1.18 и 200-дневную EMA на $1.35, что указывает на сильное импульсное движение, а не на постепенную смену тренда.
RSI около 77 указывает на условия перекупленности, тогда как MACD остается положительным — это говорит о том, что восходящий импульс устойчив, но все больше растянут по времени.
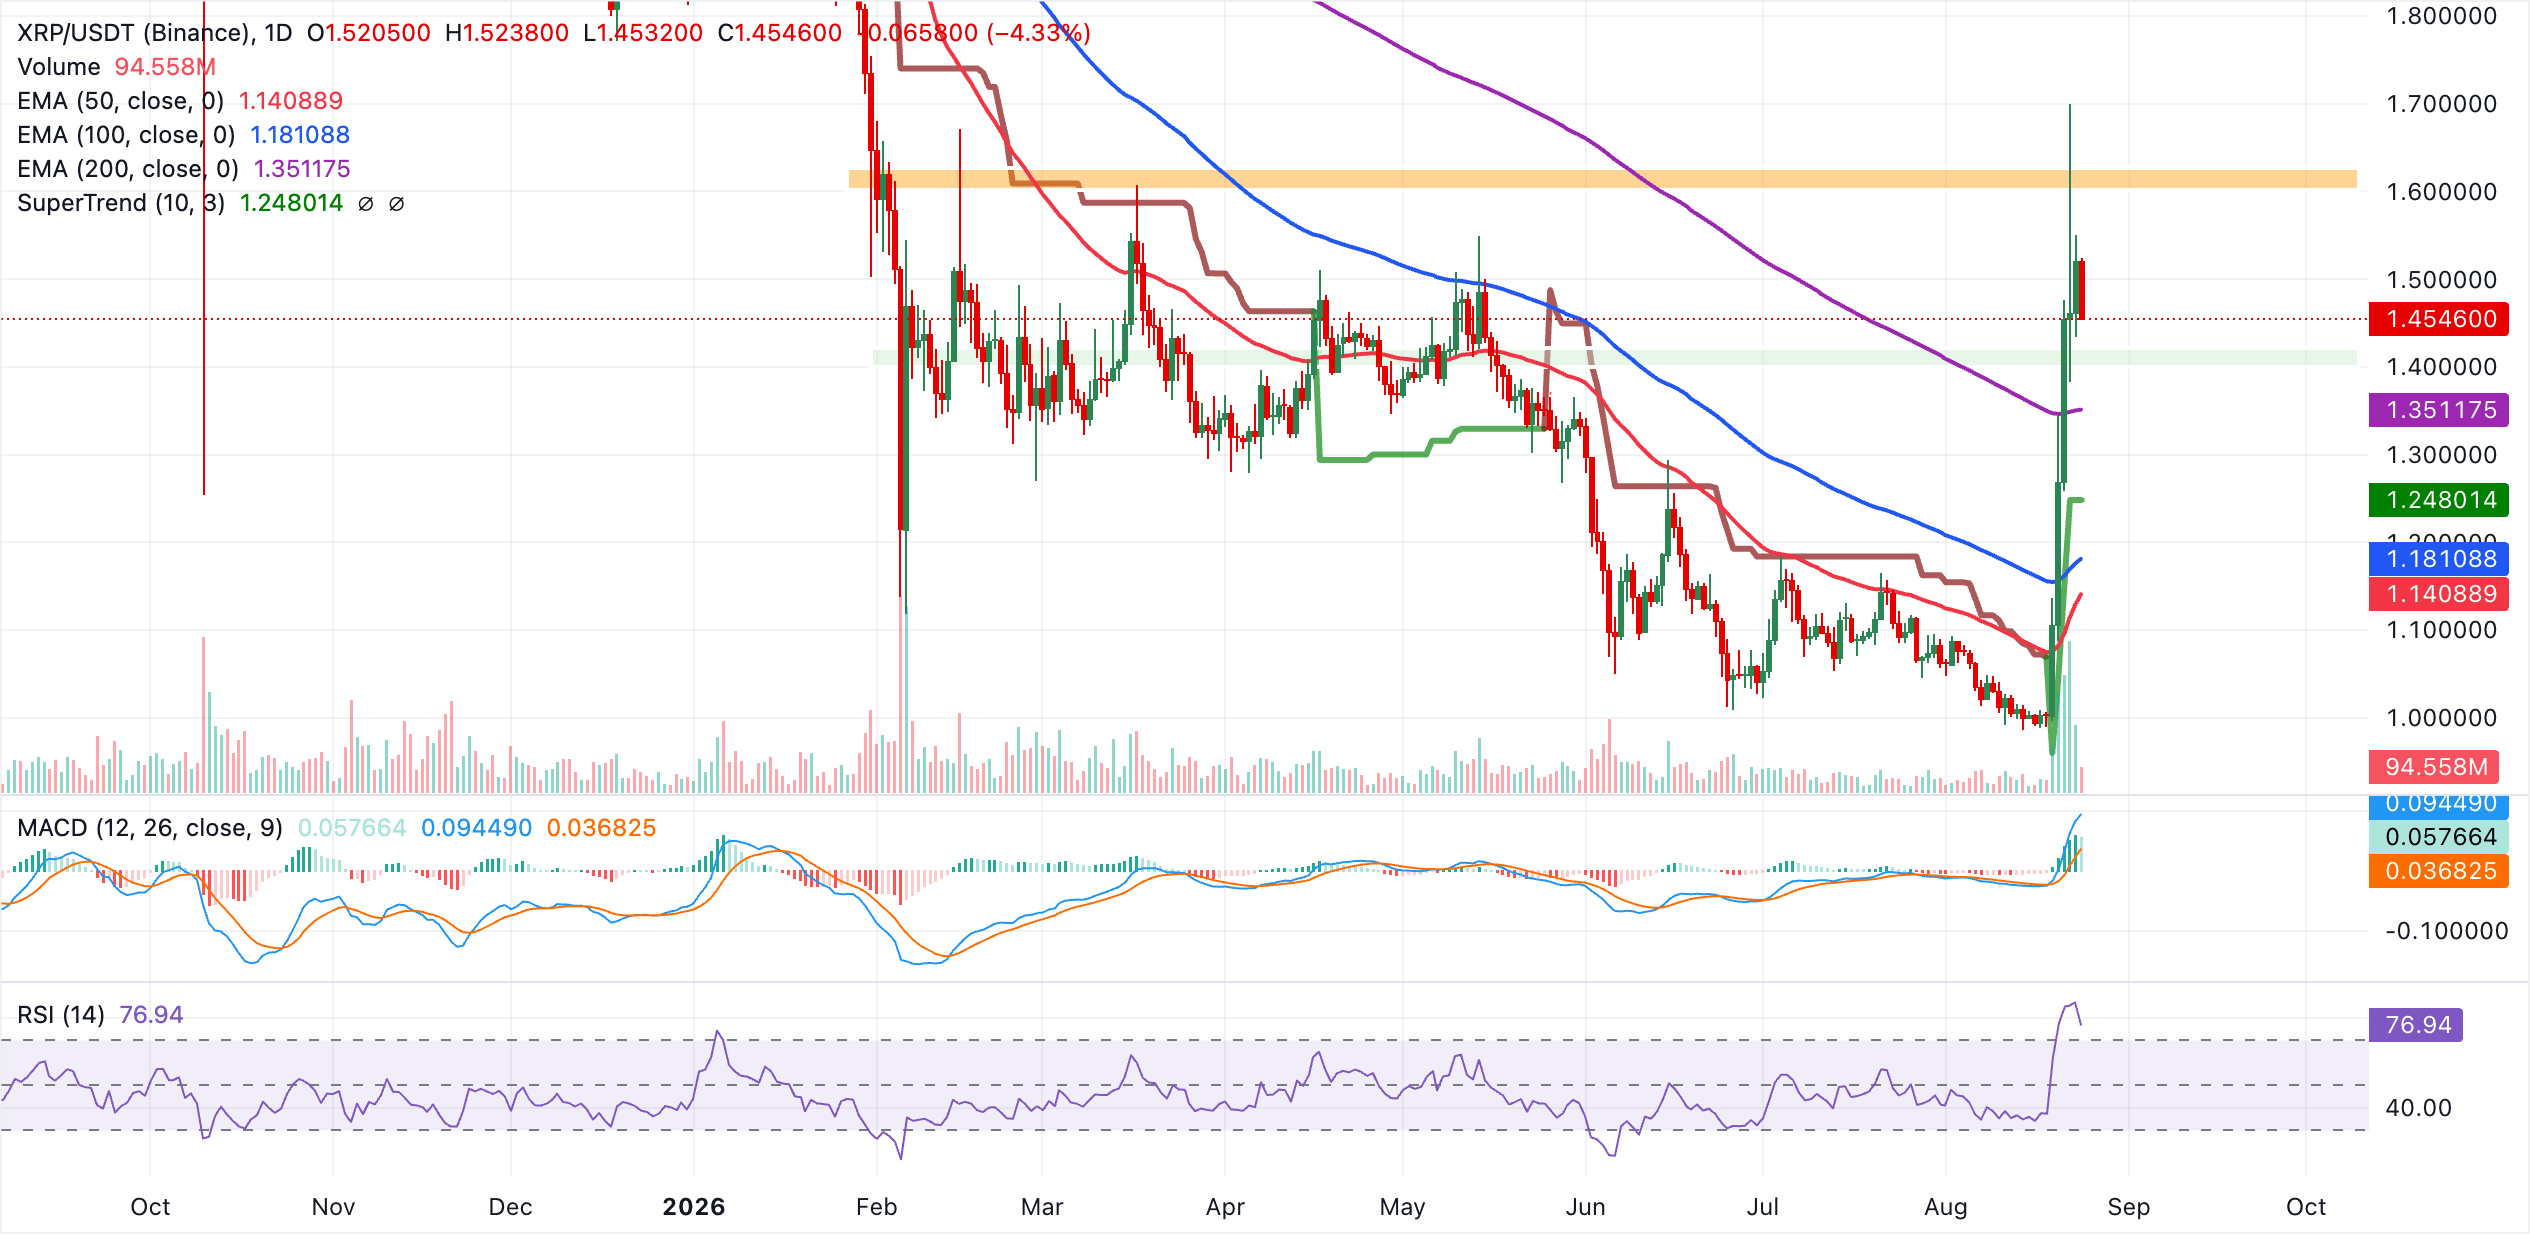
Если говорить о снижении, линия SuperTrend на $1.25 выступает первым значимым уровнем поддержки: там может появиться интерес к покупке на откатах, если цена отступит от текущих максимумов. Сверху после повторного возврата 200-дневной EMA на $1.35, далее 100-дневной EMA на $1.18 и 50-дневной EMA на $1.14 сейчас располагаются ниже рынка и подкрепляют более широкую конструктивную структуру. При этом перекупленный RSI предупреждает, что консолидация или коррекционный откат в район $1.25 были бы здоровыми перед любым новым продолжением ралли.
#BitcoinOpenInterestFallsToTwoMonthLow #BitcoinRises23.6%Weekly #AIHardwareStocksFallPreMarketAAOIDown11.66% #EtherETFsPost$697MWeeklyInflow