

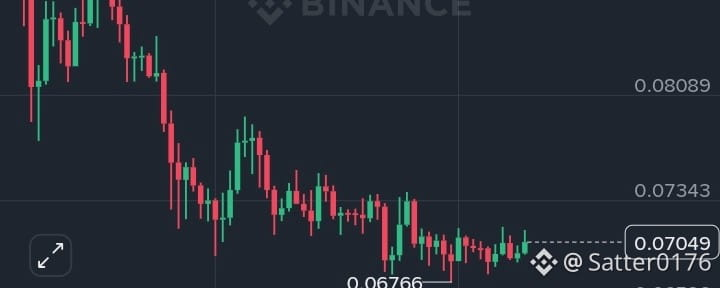

Dogecoin демонстрирует первые признаки восстановления после затяжного нисходящего тренда, но быкам по DOGE еще предстоит серьезное испытание. 🐕📈$DOGE
На графике 1D DOGE/USDT торгуется около $0.07049, прибавив примерно 1.48% в последней сессии.
📊 Технический анализ DOGE
Рыночная структура:
DOGE по-прежнему находится в более широкой медвежьей структуре, но цена начала двигаться боком после того, как нашла поддержку рядом с $0.06766.
Уровни поддержки:
🟢 $0.06766 — ключевая недавняя поддержка
🟢 $0.06596 — более глубокая зона поддержки
Уровни сопротивления:
🔴 $0.07343 — немедленное сопротивление
🔴 $0.08089 — следующая ключевая зона сопротивления
🔴 $0.08835 — более сильная цель по росту
RSI (14): 46.7
RSI ниже 50, то есть импульс все еще нейтрально-медвежий. Однако индикатор восстанавливается после более низких уровней, что может поддержать краткосрочный отскок.
OBV:
OBV остается относительно слабым, что указывает на то, что сильное накопление пока не появилось. DOGE нужно больше объема, чтобы подтвердить значимый пробой.
🐂 Бычий сценарий
Если DOGE пробивает и удерживается выше $0.07343 при сильном объеме, покупатели могут нацелиться на:
🎯 $0.08089
🎯 $0.08835
Устойчивое движение выше $0.08835 значительно улучшит дневную рыночную структуру.
🐻 Медвежий сценарий
Если DOGE не сможет вернуть $0.07343 и потеряет $0.06766, продавцы могут подтолкнуть цену к $0.06596 и потенциально ниже.
🎯 Идея сделки
Зона входа: $0.0680–$0.0705
Стоп-лосс: Ниже $0.0655
TP1: $0.0734
TP2: $0.0809
TP3: $0.0883
⚠️ Это не финансовый совет. DOGE крайне волатильна. Подтверждайте пробои объемом и всегда управляйте риском.
Ты бычий или медвежий по DOGE отсюда? 🐕🔥