

Trader M08
319 Публикации

Trader M08
Отправить жалобу
Заблокировать пользователя
Trading charts, losing sleep, gaining XP.
Открытая сделка

Владелец BNB
Случайный трейдер
8.8 г
101 подписок(и/а)
39 подписчиков(а)
70 понравилось
Посты
Портфель
Все
Цитирования
·
--
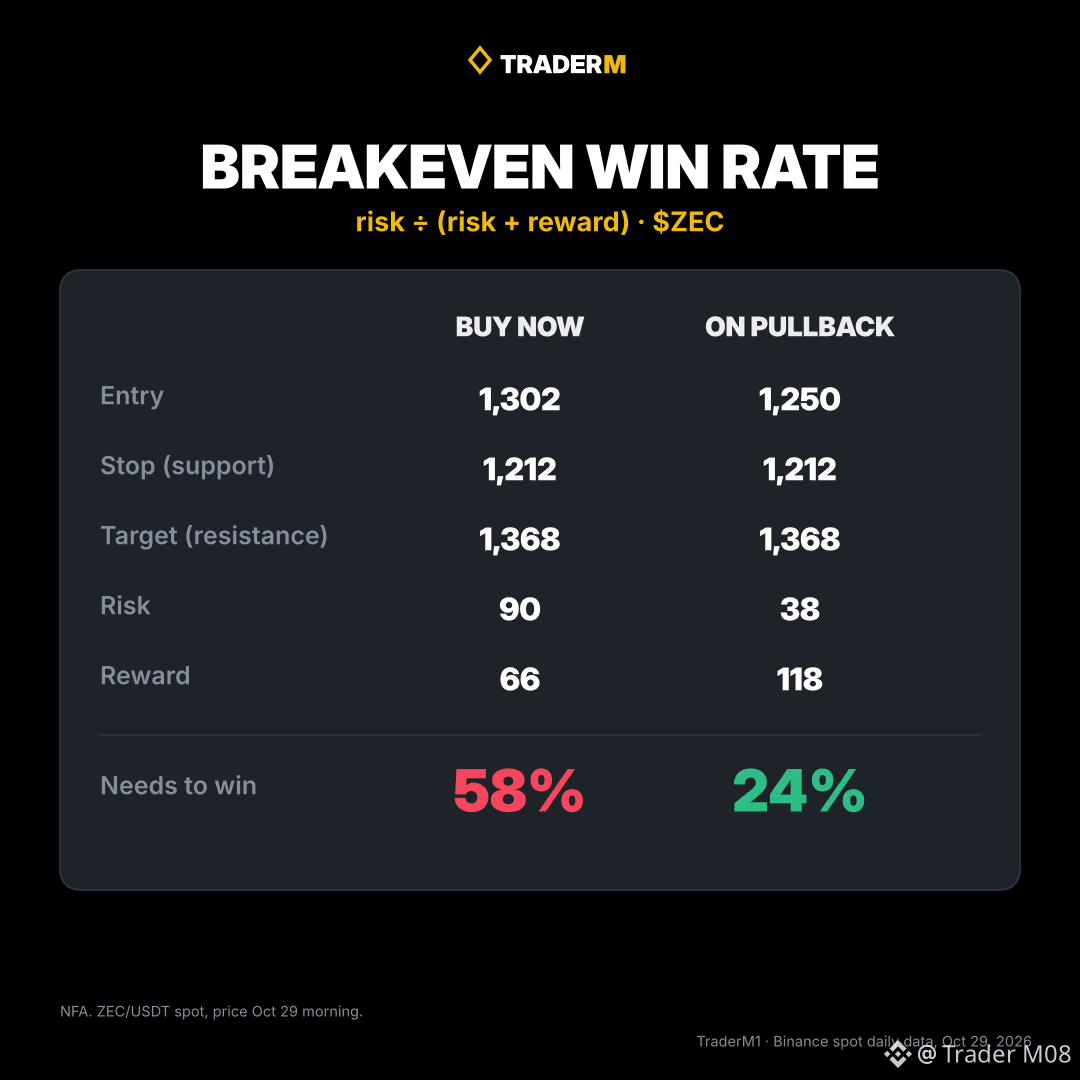
Before I buy, I check one number: the win rate a trade needs just to break even. On $ZEC this morning it was 58%. Too high for me.
Yesterday I flagged ZEC resistance at 1,349 to 1,368 and support at 1,212. It didn't break. The high was 1,330.95, and price was 1,302 this morning.
The math for a long from 1,302:
- Stop under support at 1,212: risk 90
- Target at resistance 1,368: reward 66
- Breakeven win rate = risk / (risk + reward) = 90 / 156 = 58%
I'd need to be right almost 6 times out of 10 just to stay flat.
Same levels, better entry. If ZEC pulls back to 1,250:
- Risk to 1,212: 38
- Reward to 1,368: 118
- Breakeven win rate: 24%
Same chart. Only the entry changed, and the trade went from bad to good. The other option is to wait for a daily close above 1,368 and plan from there.
NFA. Would you take ZEC at 1,302, or wait for 1,250?
182
·
--
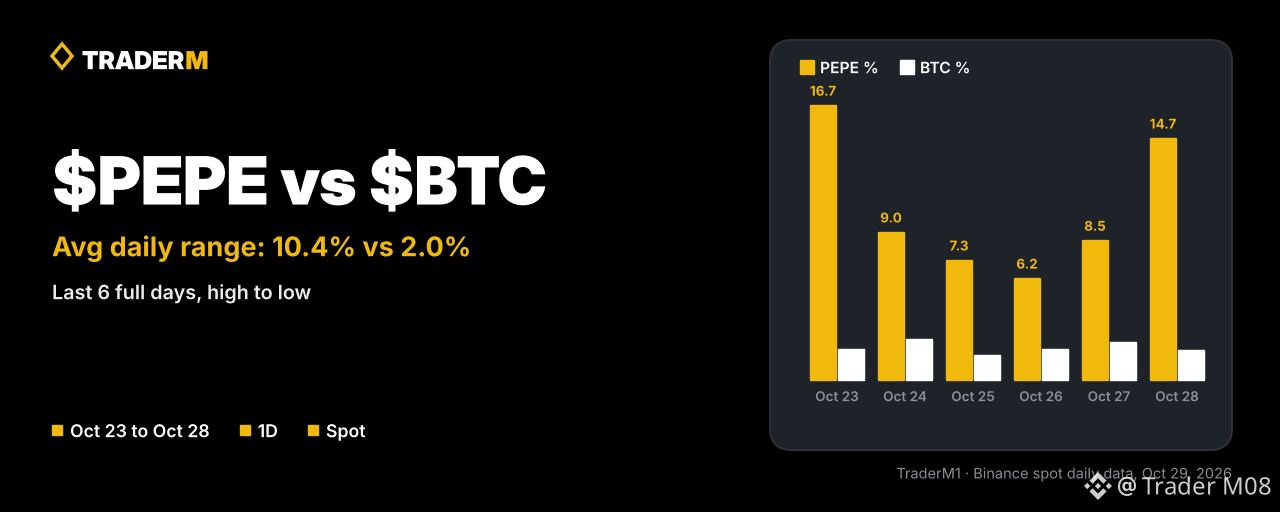
$PEPE moves about 5 times more than $BTC on a normal day. Your position size should know that.
Daily high-to-low range, last 6 full days:
- Oct 23: PEPE 16.7%, BTC 1.9%
- Oct 24: PEPE 9.0%, BTC 2.5%
- Oct 25: PEPE 7.3%, BTC 1.5%
- Oct 26: PEPE 6.2%, BTC 1.9%
- Oct 27: PEPE 8.5%, BTC 2.3%
- Oct 28: PEPE 14.7%, BTC 1.8%
Average: PEPE 10.4%, BTC 2.0%.
This morning PEPE was the 5th most traded USDT pair on Binance, with about 116M in 24h volume.
The calmest PEPE day (6.2%) was still more than double the widest BTC day (2.5%). Size a PEPE trade like a BTC trade, and a normal day can look like a crash on your account.
How much smaller do you size meme coins vs BTC: half, a fifth, or the same?
29
·
--
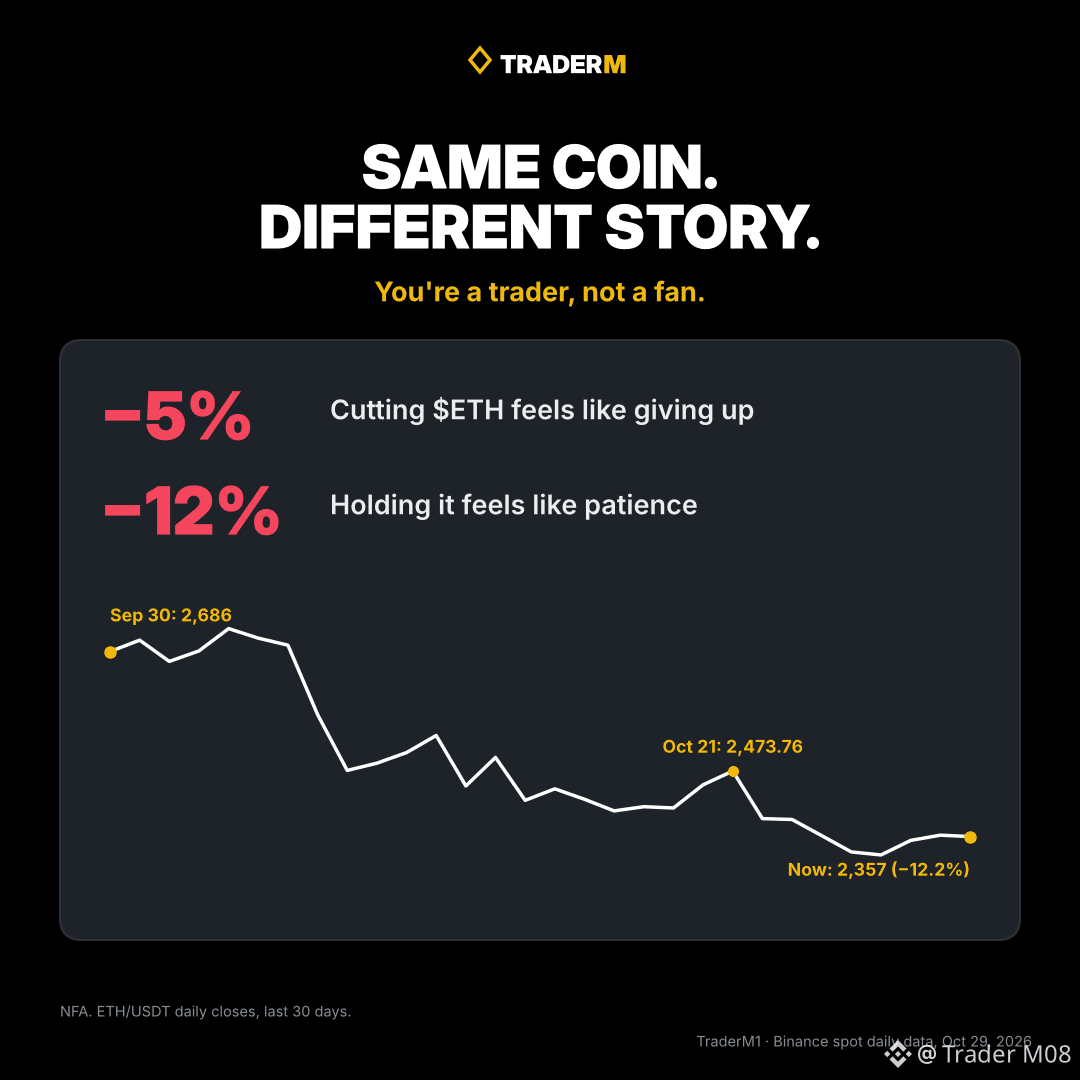
Cutting $ETH at -5% feels like giving up.
Holding it at -12% feels like patience.
Same coin, different story. You're a trader, not a fan.
The numbers: ETH closed at 2,686 on Sep 30. It trades near 2,357 now, down 12.2% in 30 days. From the Oct 21 close of 2,473.76 it is down 4.7%.
A -5% stop is a decision you make once. A -12% hold is a decision you avoid every day.
Where do you cut a losing ETH long: -5%, -10%, or never?
2
·
--
Open interest shows how much money is still sitting in futures. Price alone can't show you that.
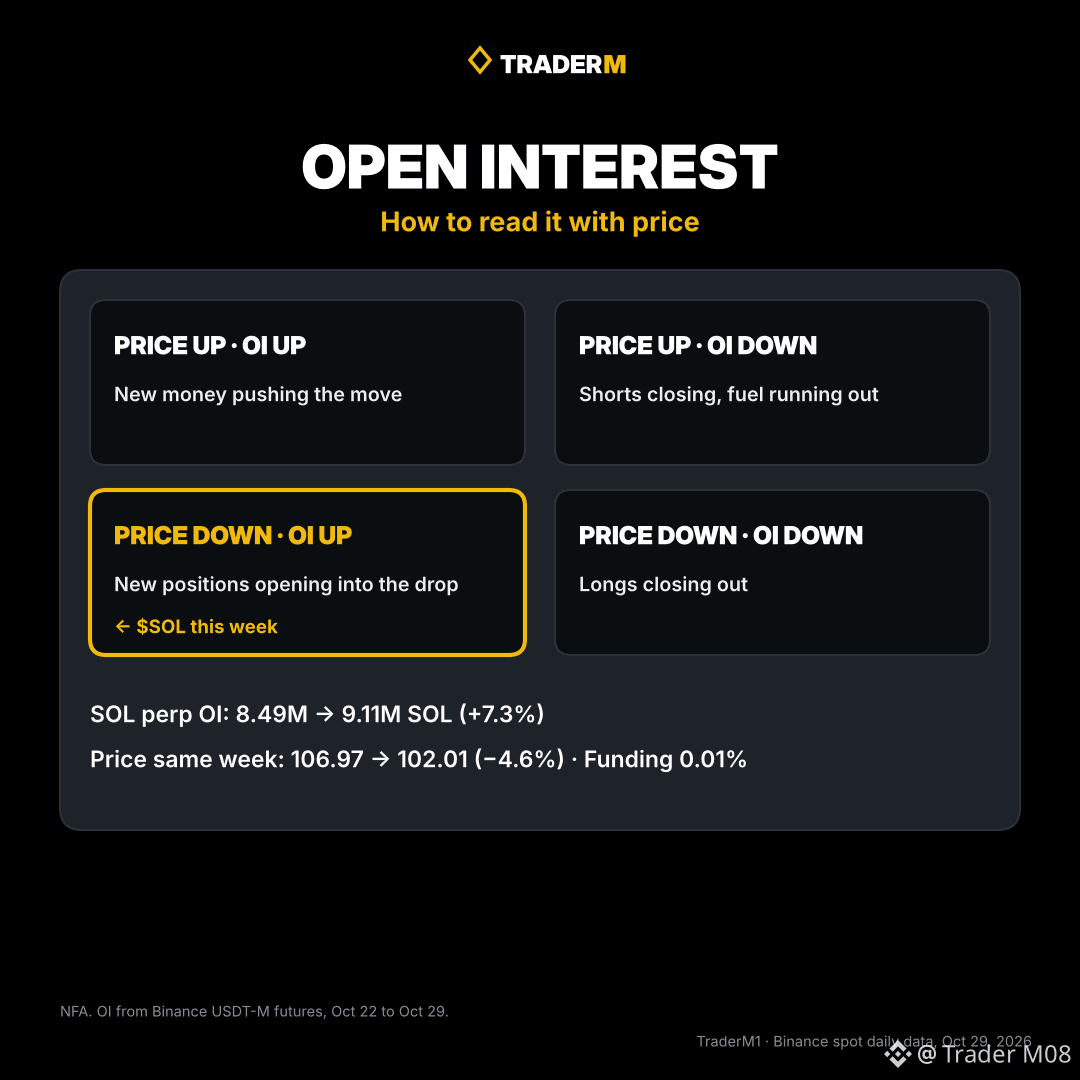
Open interest (OI) is the number of perp contracts still open. One long and one short make one contract. When traders open new positions, OI rises. When they close, it falls.
Read it together with price:
- Price up, OI up: new money is pushing the move.
- Price up, OI down: shorts are closing. The move can run out of fuel.
- Price down, OI up: new positions are opening into the drop.
- Price down, OI down: longs are closing out.
Real case, the $SOL USDT perp on Binance:
- Oct 22: OI 8.49M SOL
- Now: OI 9.11M SOL, worth about 932M USDT
- That is +7.3% in a week
- Price over the same week: 106.97 to 102.01, down 4.6%
So SOL sits in the "price down, OI up" box. More positions are open while price drifted lower. Funding is at 0.01%, the base rate, so this is not a crowd of longs paying up.
Why it matters: when positions pile up in a tight range, the break tends to be fast. Whoever is wrong has to close.
Do you check open interest before a trade, yes or no?
5
·
--
Рост
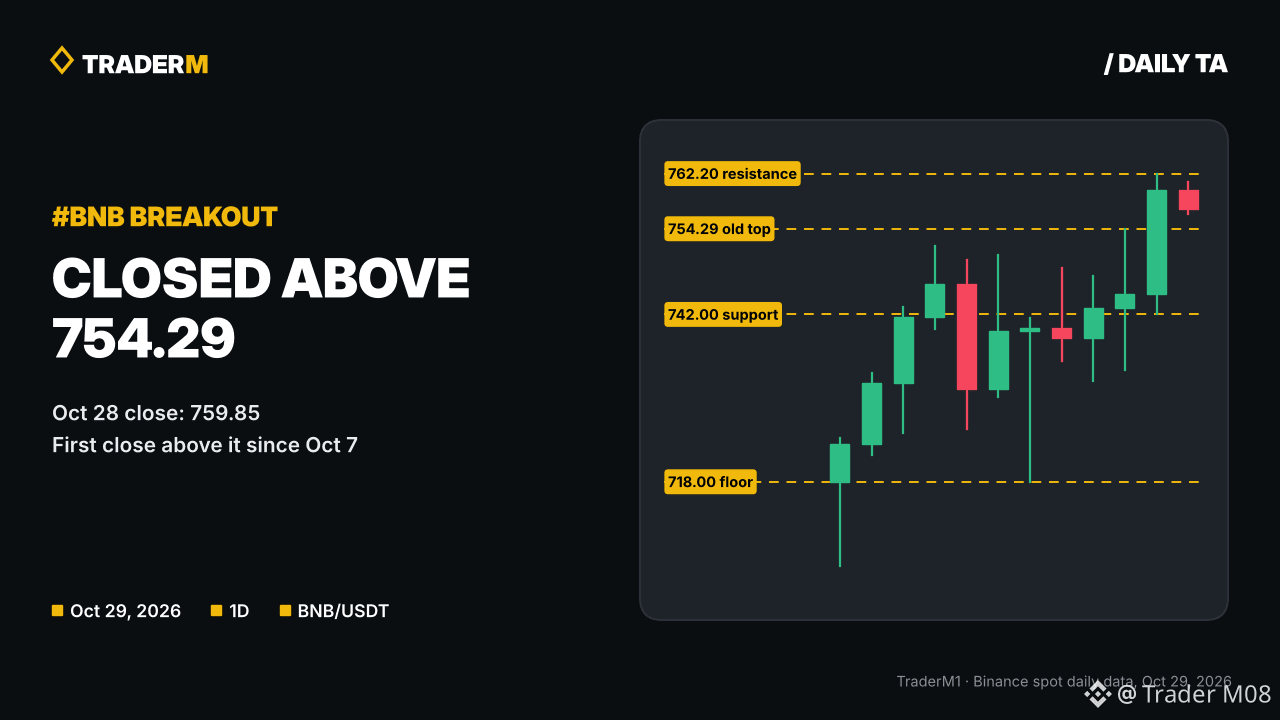
$BNB answered my question from yesterday. It closed Oct 28 at 759.85, above the 754.29 range top.
That was the fourth push at the 750 area in a week, and the first daily close above 754.29 since Oct 7.
Levels now:
- Resistance: 762.20, yesterday's high.
- Old top, now support: 754.29.
- Next support: 742.00, yesterday's low.
- Range floor: 718.00, the Oct 24 low.
On Fed night BNB dipped to 746.67 around 23:00 (UTC+7) and was back over 755 by 03:00. Buyers defended the breakout zone.
Over 30 days BNB is down 1.6%. $BTC is down 2.9% and $ETH 12.2% in the same window.
What would change my mind: a daily close back under 754. That would make yesterday a fake break.
NFA. Next stop for BNB: 770 or a retest of 754 first?
{spot}(BNBUSDT)
$BNB answered my question from yesterday. It closed Oct 28 at 759.85, above the 754.29 range top.
That was the fourth push at the 750 area in a week, and the first daily close above 754.29 since Oct 7.
Levels now:
- Resistance: 762.20, yesterday's high.
- Old top, now support: 754.29.
- Next support: 742.00, yesterday's low.
- Range floor: 718.00, the Oct 24 low.
On Fed night BNB dipped to 746.67 around 23:00 (UTC+7) and was back over 755 by 03:00. Buyers defended the breakout zone.
Over 30 days BNB is down 1.6%. $BTC is down 2.9% and $ETH 12.2% in the same window.
What would change my mind: a daily close back under 754. That would make yesterday a fake break.
NFA. Next stop for BNB: 770 or a retest of 754 first?
1
92
·
--
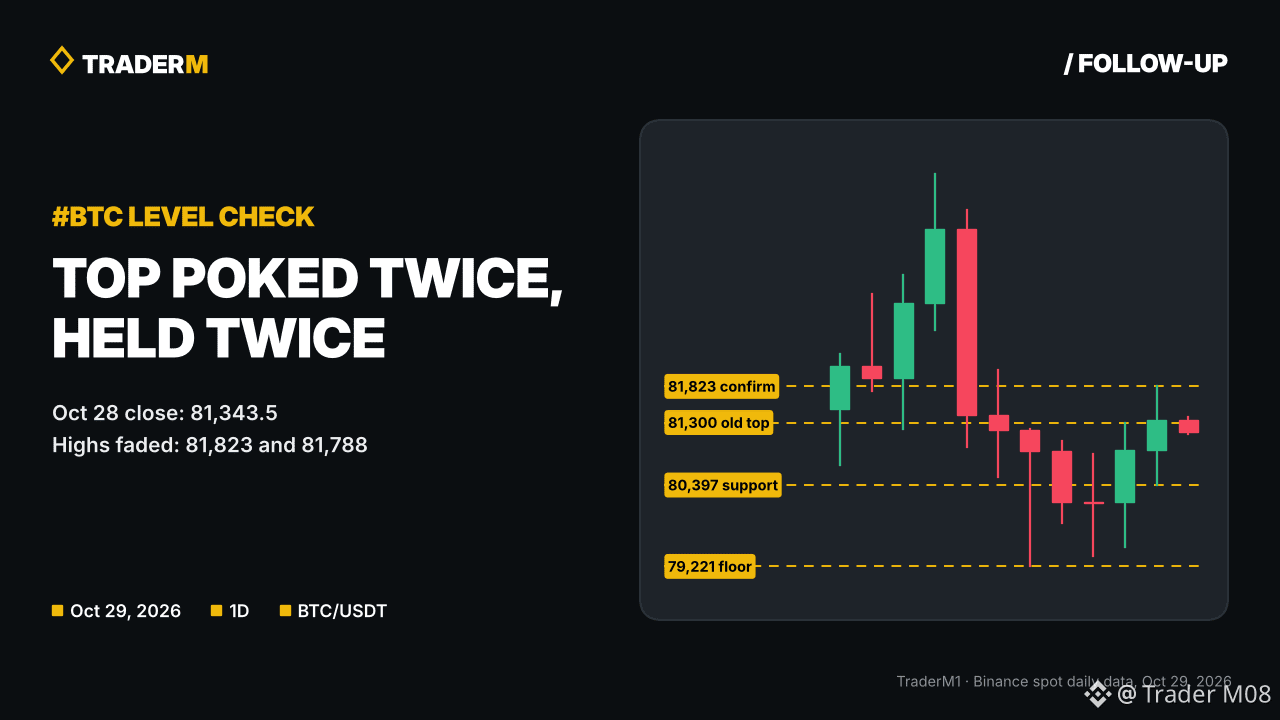
Yesterday I asked which $BTC edge breaks first, 81,300 or 79,221. Neither broke cleanly.
What happened:
- Oct 28 high: 81,823. Price fell back the same day.
- After the Fed at 01:00 (UTC+7), BTC pushed to 81,788 by 03:00, then faded again.
- Daily close: 81,343.5. That is only 44 above the old top.
- Low of the day: 80,397, well above 79,221.
So the top got poked twice and held twice. A close 44 points above a level is not a breakout to me. Price sits near 81,170, back inside.
Levels for today:
- Confirmation: a daily close above 81,823. Two failed pushes make that the real line.
- First support: 80,397, yesterday's low.
- Box floor: 79,221, the Oct 24 low.
Funding is near 0.005%, half the 0.01% base. No crowd on either side.
NFA. Do you count yesterday's 81,343 close as a breakout, yes or no?
{spot}(BTCUSDT)
Yesterday I asked which $BTC edge breaks first, 81,300 or 79,221. Neither broke cleanly.
What happened:
- Oct 28 high: 81,823. Price fell back the same day.
- After the Fed at 01:00 (UTC+7), BTC pushed to 81,788 by 03:00, then faded again.
- Daily close: 81,343.5. That is only 44 above the old top.
- Low of the day: 80,397, well above 79,221.
So the top got poked twice and held twice. A close 44 points above a level is not a breakout to me. Price sits near 81,170, back inside.
Levels for today:
- Confirmation: a daily close above 81,823. Two failed pushes make that the real line.
- First support: 80,397, yesterday's low.
- Box floor: 79,221, the Oct 24 low.
Funding is near 0.005%, half the 0.01% base. No crowd on either side.
NFA. Do you count yesterday's 81,343 close as a breakout, yes or no?
1
118
·
--
Рост
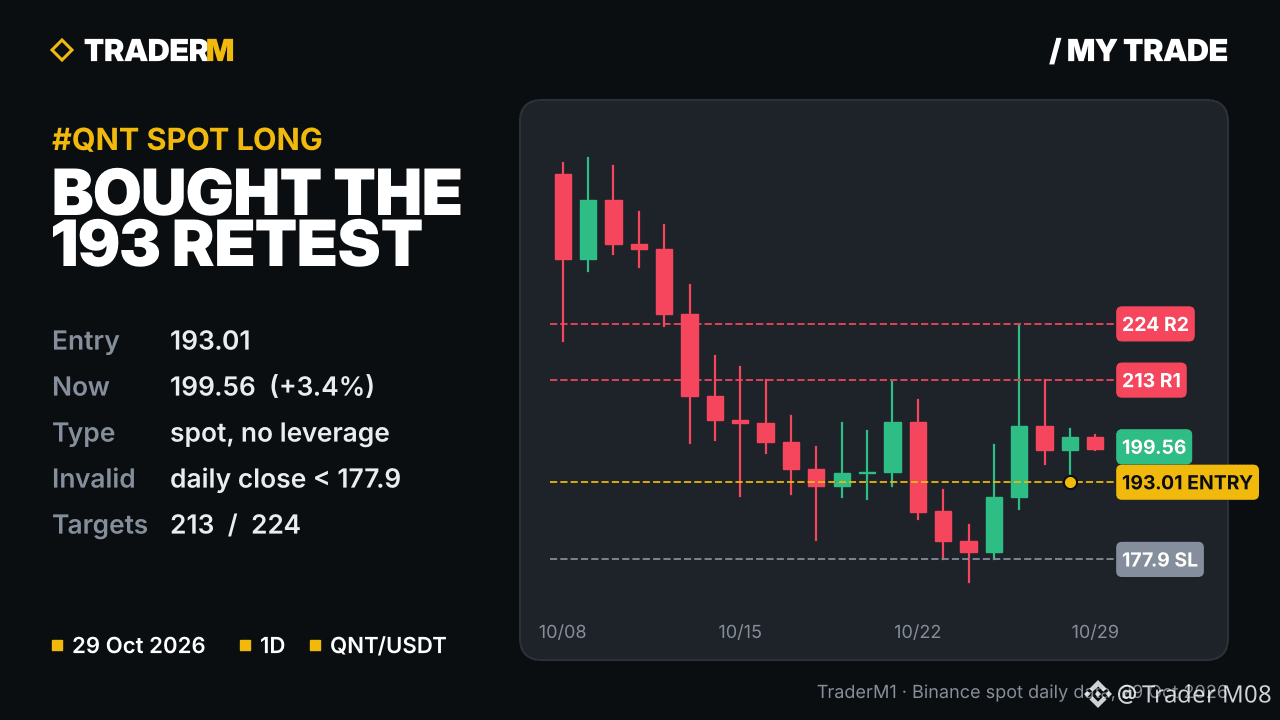
Bought $QNT spot at 193.01 on Oct 28. It trades at 199.56 now, +3.4%. Here is why I took it and where I'm wrong.
The backdrop:
- Late September QNT ran from about 70 to a 373 wick in four days.
- Since then it has bled. The Oct 24 low at 173.56 sits about 53% under that wick.
- Oct 26 printed a 223.96 wick on 36M USDT volume, nearly 3x the prior week's daily average.
Why 193:
- After the Oct 24 flush, daily lows went 177.92, 187.79, 196.53, 192.52. Buyers keep stepping in above 173.
- 193 matches the Oct 18-20 closing area (192-195) and the 7-day average close (193.7).
- My fill came at 193.01, close to yesterday's 192.52 low.
- Perp funding is +0.008%, so longs are not crowded.
The plan:
- Position: spot, no leverage.
- Invalidation: daily close below 177.9, the Oct 25 low. Below that, 173.56 is likely next.
- Target 1: 213, the Oct 27 high.
- Target 2: 224, the Oct 26 wick.
- Risk to 177.9 is about 15 per coin, reward to 224 about 31. Roughly 1:2.
What I'm watching: a daily close above 213 would be the first higher high since the drop. If price rejects there again, I take part off.
NFA.
Your call: does $QNT reclaim 213 this week, or retest 193 first?
469
·
--
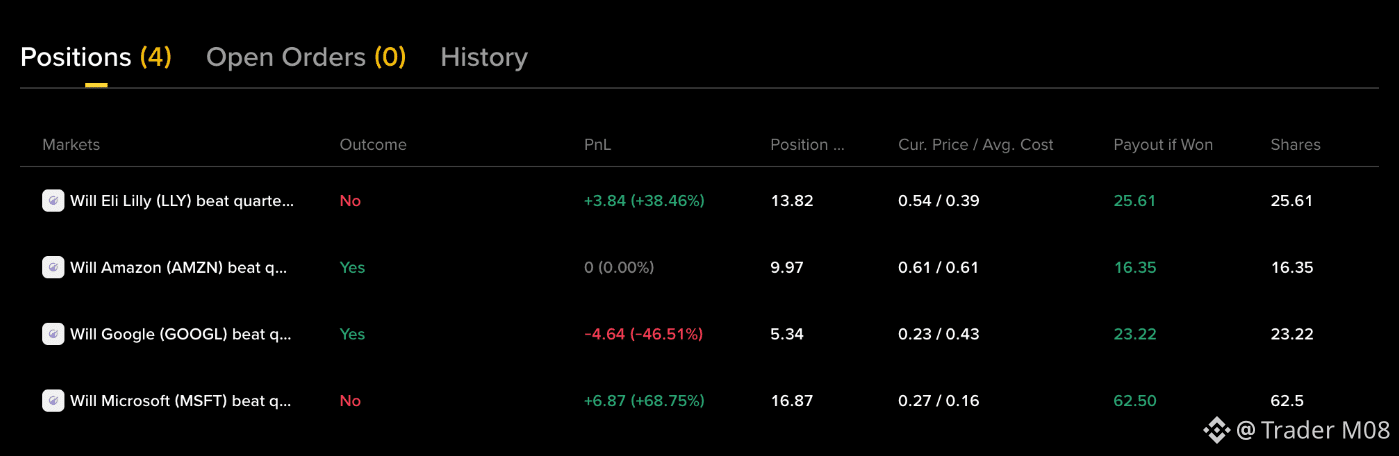
Amazon reports earnings tonight, and the Binance Pick market prices a beat at 63% Yes.
The bar is simple: GAAP EPS above $2.00 for the quarter. That is the Street consensus, so the market asks one question. Does Amazon beat its own estimate?
What the market shows right now:
- Yes trades around 0.63 to 0.67, No around 0.35
- 741K volume, 431K liquidity
- Resolves on the GAAP EPS in Amazon's official earnings release
My read: large caps usually set guidance they can beat, so I lean Yes. But GAAP EPS is not adjusted EPS. One-off items like gains or losses on investments can push GAAP far in either direction. That is the real risk here, not the core business.
I hold a small Yes from 0.64. NFA, size it like a coin flip with a small edge.
Would you buy Yes at 0.67, or only under 0.55?
#BinancePick
47
·
--
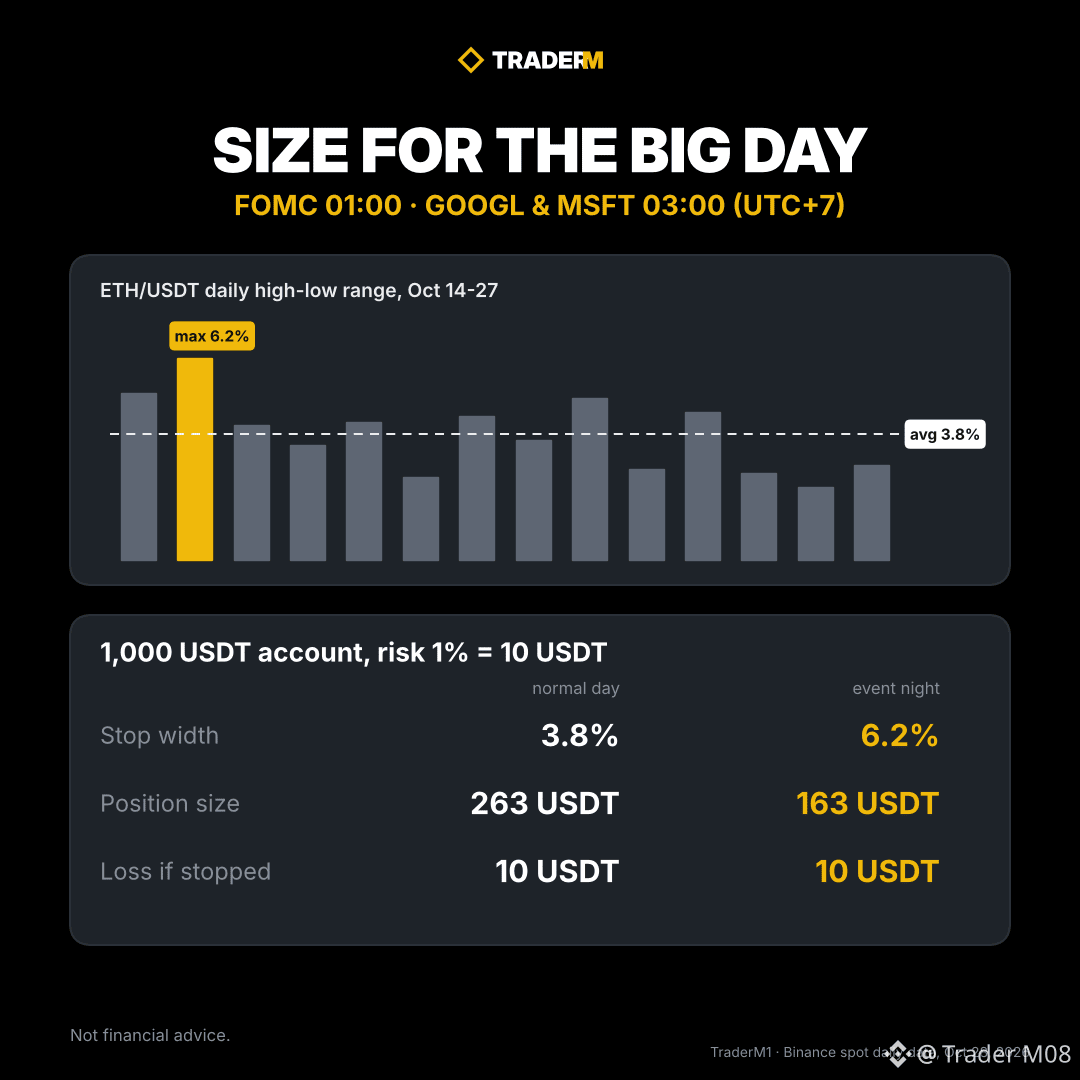
Tonight, size your trades for the big day, not the average day.
Two events land a few hours apart (UTC+7):
- 01:00: FOMC rate decision, press conference at 01:30
- Around 03:00: Microsoft and Alphabet earnings, after the US close
$ETH daily range over the last 14 days averaged 3.8%. The widest day was Oct 15 at 6.2%.
Same 1,000 USDT account, same 1% risk (10 USDT):
- Stop 3.8% away: position size 263 USDT
- Stop 6.2% away: position size 163 USDT
The loss if stopped is 10 USDT either way. You just hold less when the stop has to be wider. A normal-size position with a tight stop is the one that gets wicked out first.
Smaller size, wider stop, same risk.
Are you trading through the Fed tonight or sitting out?
#FOMCWatch
13
·
--
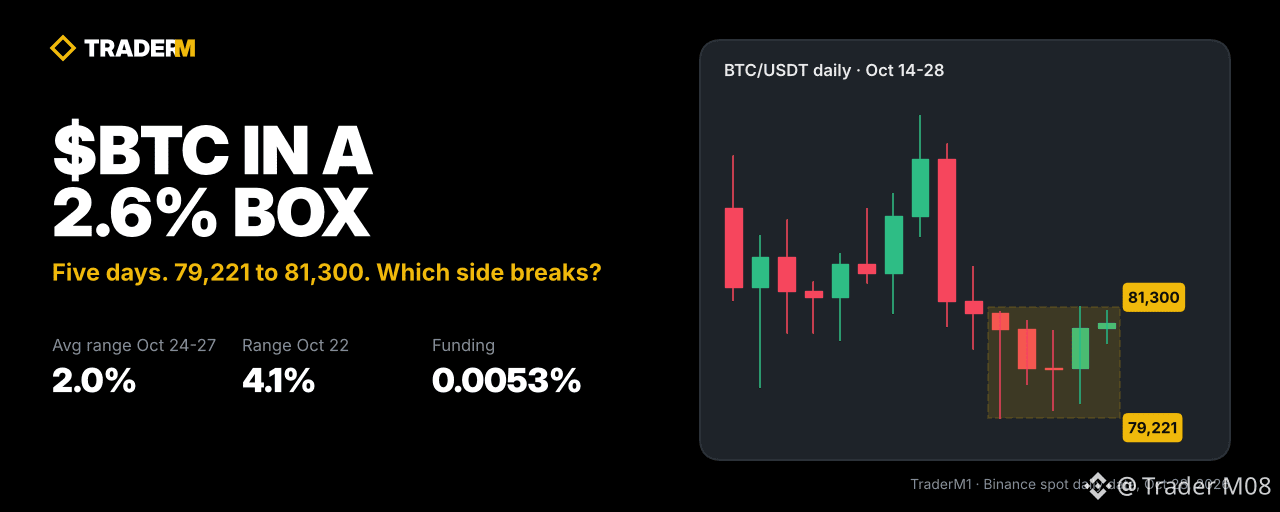
$BTC has spent five days in a 2.6% box. The edges are 79,221 and 81,300.
Daily ranges:
- Oct 22: 4.1%
- Oct 24: 2.5%
- Oct 25: 1.5%
- Oct 26: 1.8%
- Oct 27: 2.2%
BTC dipped under 80,000 on four of the five days, and every day closed back above it. The low of the box is Oct 24 at 79,221. The top, 81,300, is from yesterday.
Funding is 0.0053%, below the 0.01% base. Nobody is paying up to be long into the Fed.
The last quiet stretch, Oct 17 to 19, was followed by a 4.1% day on Oct 22. FOMC is at 01:00 tonight, press conference at 01:30 (UTC+7).
NFA. Which edge breaks first, 81,300 or 79,221?
#BitcoinSlipsBelow$80KAgain
{spot}(BTCUSDT)
$BTC has spent five days in a 2.6% box. The edges are 79,221 and 81,300.
Daily ranges:
- Oct 22: 4.1%
- Oct 24: 2.5%
- Oct 25: 1.5%
- Oct 26: 1.8%
- Oct 27: 2.2%
BTC dipped under 80,000 on four of the five days, and every day closed back above it. The low of the box is Oct 24 at 79,221. The top, 81,300, is from yesterday.
Funding is 0.0053%, below the 0.01% base. Nobody is paying up to be long into the Fed.
The last quiet stretch, Oct 17 to 19, was followed by a 4.1% day on Oct 22. FOMC is at 01:00 tonight, press conference at 01:30 (UTC+7).
NFA. Which edge breaks first, 81,300 or 79,221?
#BitcoinSlipsBelow$80KAgain
29
·
--
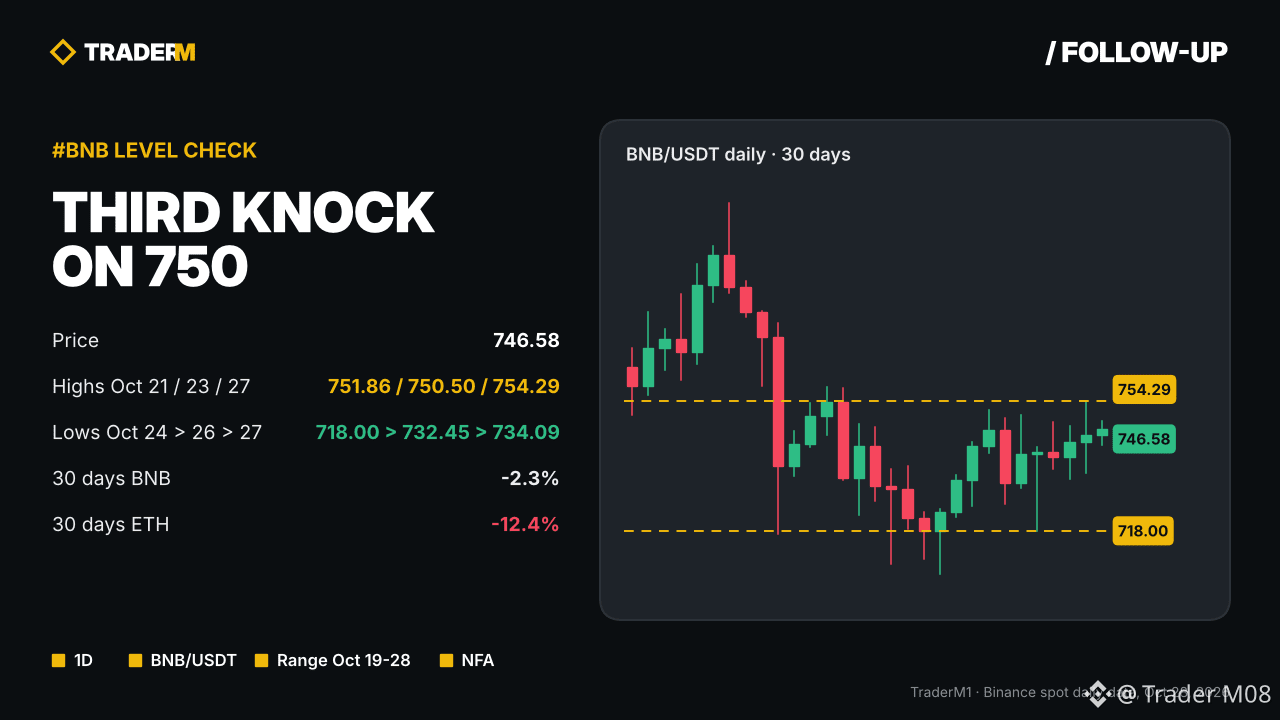
$BNB is knocking on 750 for the third time in a week. Each dip in between got bought higher.
Highs:
- Oct 21: 751.86
- Oct 23: 750.50
- Oct 27: 754.29
Lows:
- Oct 24: 718.00
- Oct 26: 732.45
- Oct 27: 734.09
Price now: 746.58. In an earlier post I said BNB was holding up better than most of the market. That's still true. Over 30 days BNB is down 2.3%, while $ETH is down 12.4%.
The read: a range from 718 to 754 with rising lows. A daily close above 754.29 breaks it. A drop back under 732 puts 718 back in play.
NFA. Does BNB close above 754 before Sunday, yes or no?
{spot}(BNBUSDT)
$BNB is knocking on 750 for the third time in a week. Each dip in between got bought higher.
Highs:
- Oct 21: 751.86
- Oct 23: 750.50
- Oct 27: 754.29
Lows:
- Oct 24: 718.00
- Oct 26: 732.45
- Oct 27: 734.09
Price now: 746.58. In an earlier post I said BNB was holding up better than most of the market. That's still true. Over 30 days BNB is down 2.3%, while $ETH is down 12.4%.
The read: a range from 718 to 754 with rising lows. A daily close above 754.29 breaks it. A drop back under 732 puts 718 back in play.
NFA. Does BNB close above 754 before Sunday, yes or no?
12
·
--
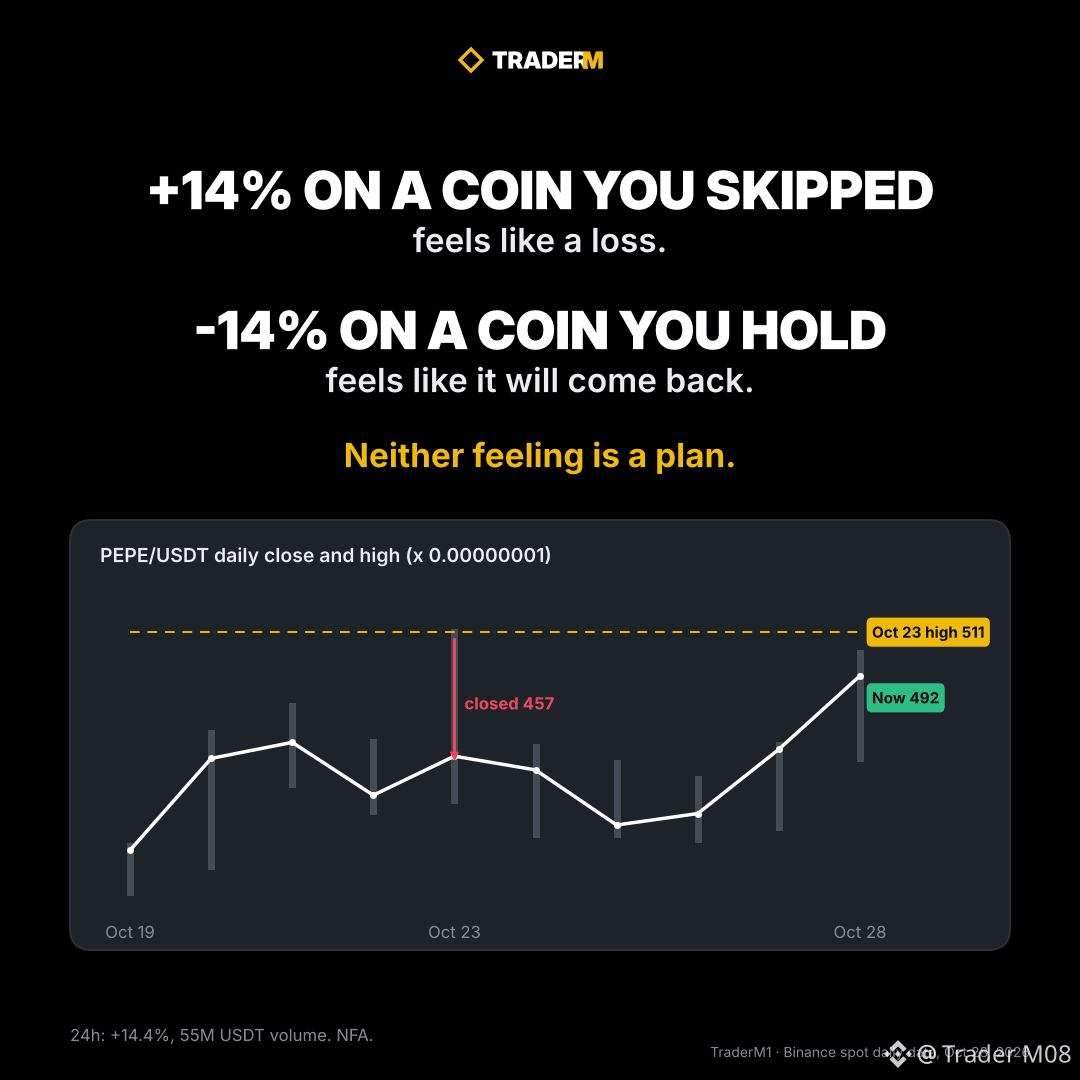
+14% on a coin you skipped feels like a loss.
-14% on a coin you hold feels like it will come back.
Neither feeling is a plan.
$PEPE is up 14.4% in 24h on 55M USDT volume, the biggest crypto gainer on Binance among pairs with 20M+ traded. Today's high of 0.00000502 sits just under the Oct 23 high of 0.00000511. That day closed at 0.00000457.
Chasing after +14% and holding a loser come from the same place: you let the price decide for you.
Which one costs you more: chasing pumps or holding losers?
35
·
--
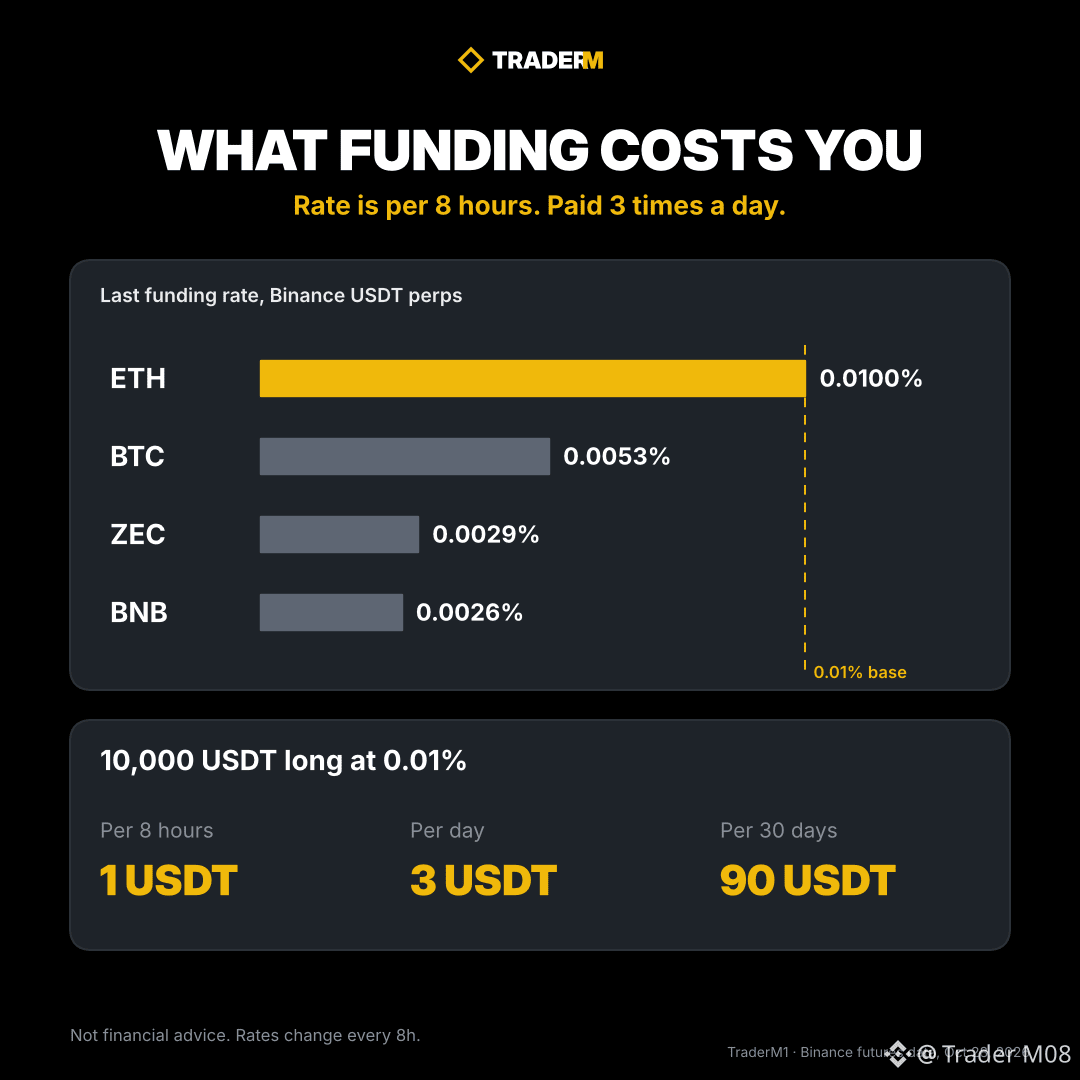
Funding rate looks tiny, but it is a real cost on every perp you hold.
How it works on most Binance USDT perps:
- Funding is paid every 8 hours, so 3 times a day.
- When the rate is positive, longs pay shorts. When it is negative, shorts pay longs.
- 0.01% per 8 hours is the base rate you see when the market is calm.
Last funding right now:
- $ETH 0.0100%, right at base
- BTC 0.0053%
- ZEC 0.0029%
- $BNB 0.0026%
What 0.01% costs: a 10,000 USDT long pays 1 USDT every 8 hours. That is 3 USDT a day and about 90 USDT over 30 days. On 1,000 USDT margin at 10x, that is 9% of your margin gone in a month while price does nothing.
So funding matters most on slow swing trades with leverage. Under 0.01%, like BTC and BNB now, holding a long costs less than usual.
Do you check funding before you hold a perp overnight, yes or no?
24
·
--
Рост
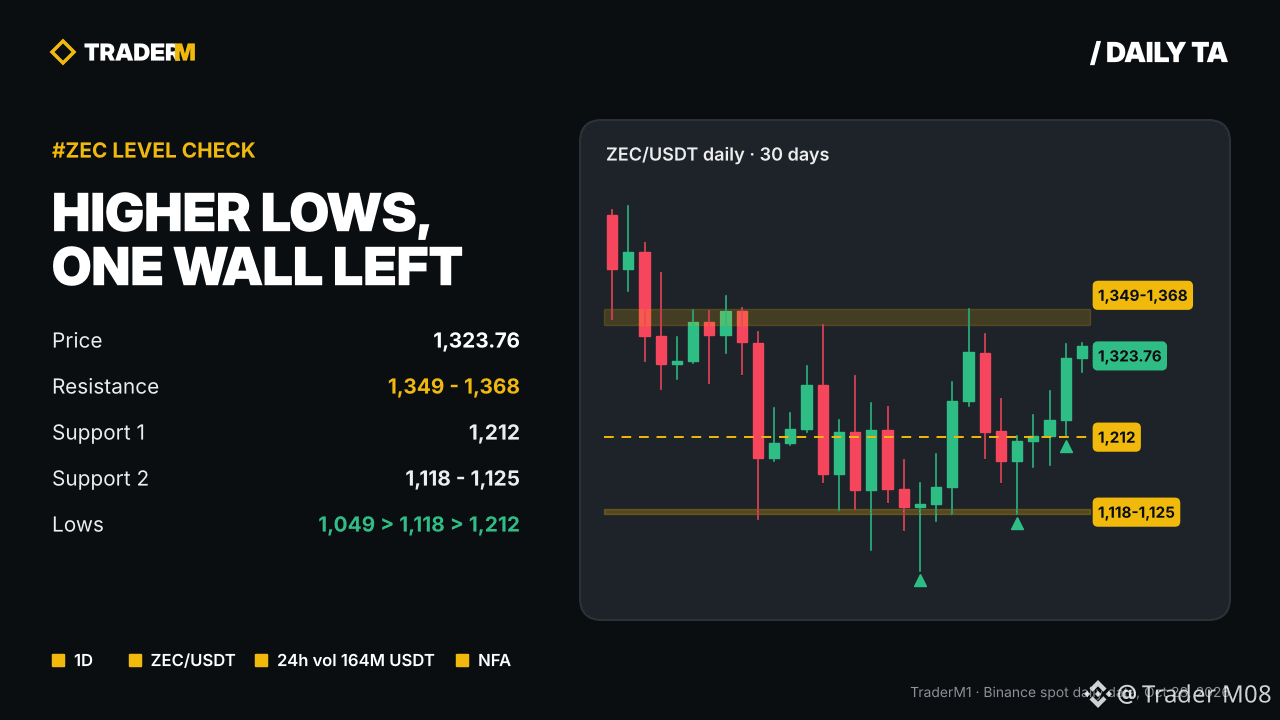
$ZEC is printing higher lows and is now one wall away from a breakout.
Daily lows since Oct 18: 1,049, then 1,118 on Oct 24, then 1,212 on Oct 27. Each dip gets bought higher.
Levels I'm watching:
- Resistance: 1,349 to 1,368. Rejected on Oct 12 and Oct 21.
- Price now: 1,323.76, up 8.4% in 24h.
- Support 1: 1,212, yesterday's low.
- Support 2: 1,118 to 1,125, tested four times since Oct 13.
ZEC is the third most traded USDT pair on Binance right now with 164M in 24h volume, behind only BTC and ETH. Funding sits at 0.0029%, below the 0.01% base, so longs are not crowded yet.
A daily close above 1,368 opens room. Another rejection there and 1,212 is the first test.
NFA. Does ZEC close above 1,368 this week, yes or no?
{spot}(ZECUSDT)
$ZEC is printing higher lows and is now one wall away from a breakout.
Daily lows since Oct 18: 1,049, then 1,118 on Oct 24, then 1,212 on Oct 27. Each dip gets bought higher.
Levels I'm watching:
- Resistance: 1,349 to 1,368. Rejected on Oct 12 and Oct 21.
- Price now: 1,323.76, up 8.4% in 24h.
- Support 1: 1,212, yesterday's low.
- Support 2: 1,118 to 1,125, tested four times since Oct 13.
ZEC is the third most traded USDT pair on Binance right now with 164M in 24h volume, behind only BTC and ETH. Funding sits at 0.0029%, below the 0.01% base, so longs are not crowded yet.
A daily close above 1,368 opens room. Another rejection there and 1,212 is the first test.
NFA. Does ZEC close above 1,368 this week, yes or no?
185
·
--
My Binance Pick calls for tonight: Yes on Google beating, No on Microsoft beating. Both go against the crowd.
Why Yes on $GOOGL beating:
- The stock is down 21.5% from its 408.61 high and 12.9% since Aug 4. The fear is already in the price.
- At about 16x trailing earnings, the bar is low. Consensus is about 3.02 EPS.
- Less than a quarter of Pick traders say it beats. That makes Yes the cheap side if search ads hold.
Why No on $MSFT beating:
- It sits 3.6% under its 551.15 high and is up 10.5% since Aug 4. The market already expects a strong print.
- Consensus is about 4.72 EPS on 90.6B revenue. With AI spending this heavy, higher costs can eat into the EPS number.
- About 3 in 4 Pick traders say it beats, so No pays more if I'm right.
Small size on both. It's a read on expectations, not a sure thing.
Which side are you on: Google beat, Microsoft beat, both or neither?
#BinancePick
124
·
--
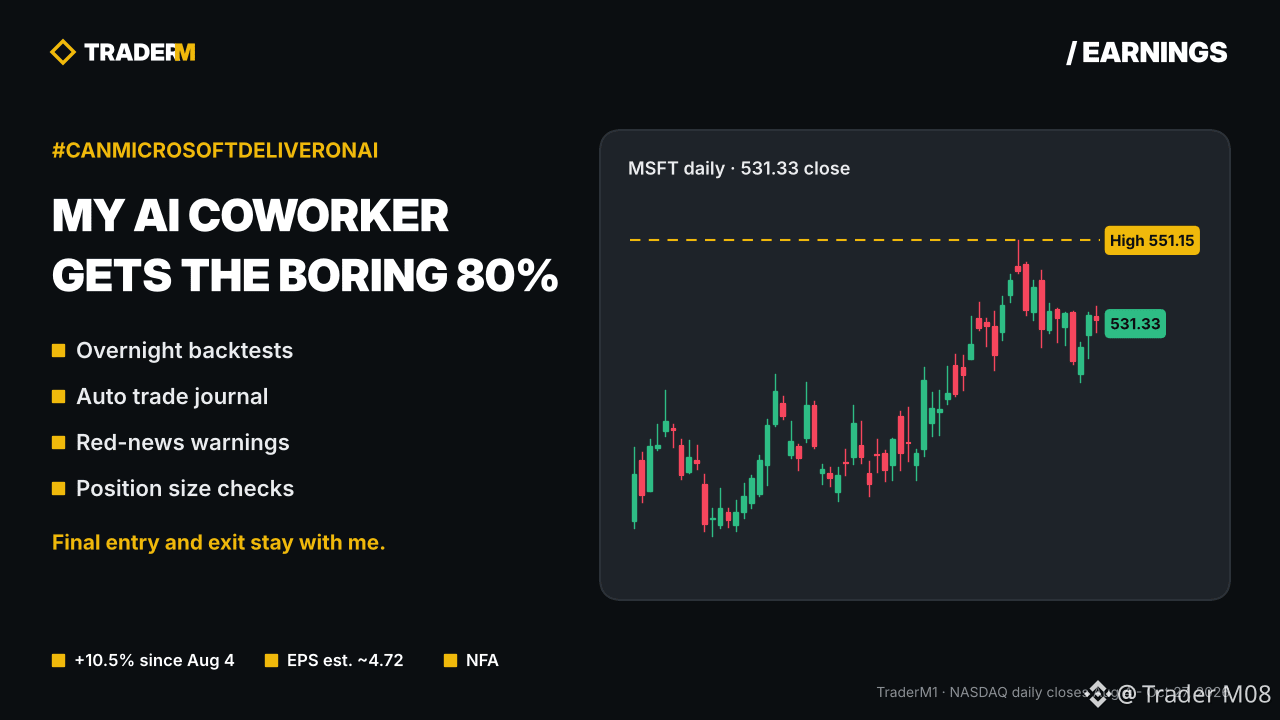
If I had an AI coworker like Copilot Code, I'd give it the boring 80% of my trading work. Not the decisions.
What I'd hand it:
- Backtest my setups on years of data overnight and flag where the edge breaks
- Log every trade with entry reason, screenshot and result, so my journal is never empty
- Watch the calendar and warn me 30 minutes before red-folder news
- Check my position size against my risk rule before I click buy
What I'd keep: the final entry and exit. A tool that executes without my rules just loses money faster.
On the stock: $MSFT closed at 531.33, about 3.6% under its 551.15 high and up 10.5% since Aug 4. The market expects about 4.72 EPS and 90.6B revenue this quarter. With price near the top, the bar is high. Azure growth and AI spending will decide the move.
Which would you hand to an AI coworker first: backtesting, journaling or risk checks?
$MSFT
#CanMicrosoftDeliverOnAI
71
·
--
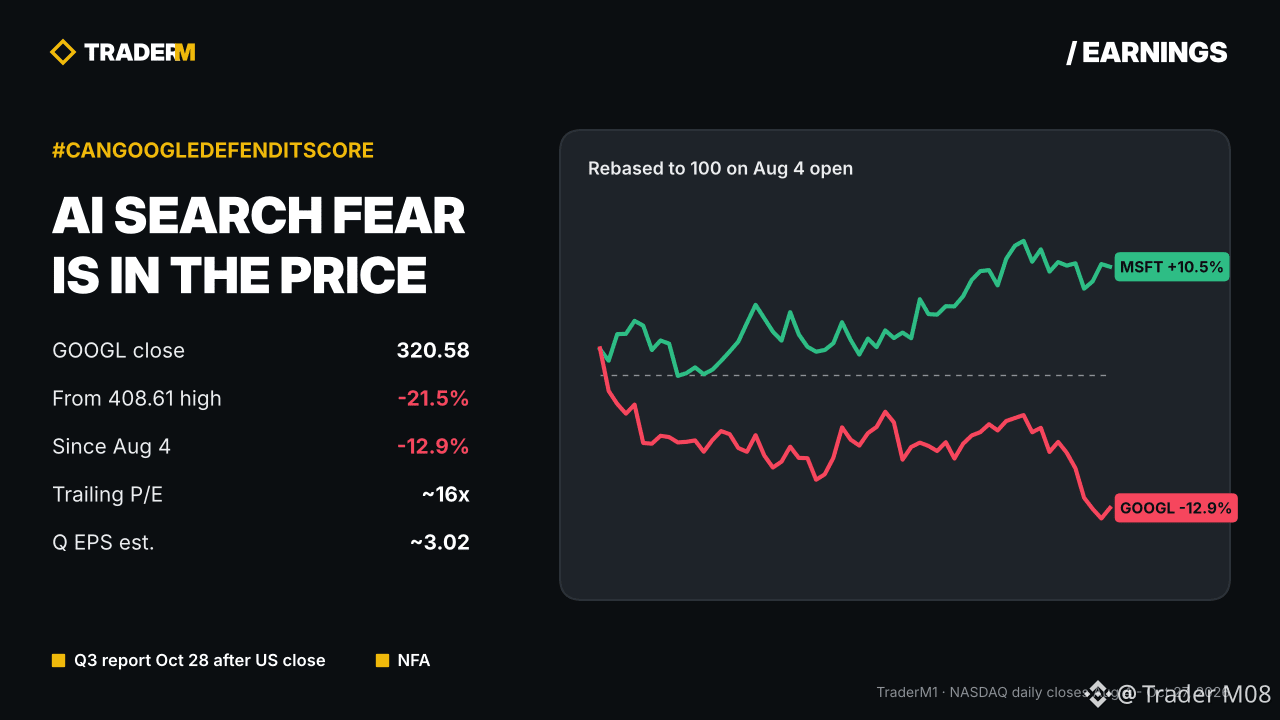
$GOOGL is down 21.5% from its 408.61 high going into earnings. A lot of the AI search fear is already in the price.
My take: AI answers change how people search, but they don't kill Google's ad business yet.
- Ads follow intent. Google owns both the search box and Gemini, so it can put ads inside AI answers too.
- The number to watch is not total revenue. It's search ad growth, and whether AI answers earn as much per query as the old results page.
- Consensus for the quarter is about 3.02 EPS on roughly 128B revenue.
- GOOGL trades near 16x trailing earnings, about half of MSFT at 30x.
Since Aug 4, GOOGL is down 12.9% while MSFT is up 10.5%. If search ads hold, that gap can close. If they slow, 300 is the level traders will watch next.
Quick one: for daily questions, do you use AI chat or Google search more now?
$GOOGL $MSFT
#CanGoogleDefindItsCore
295
·
--
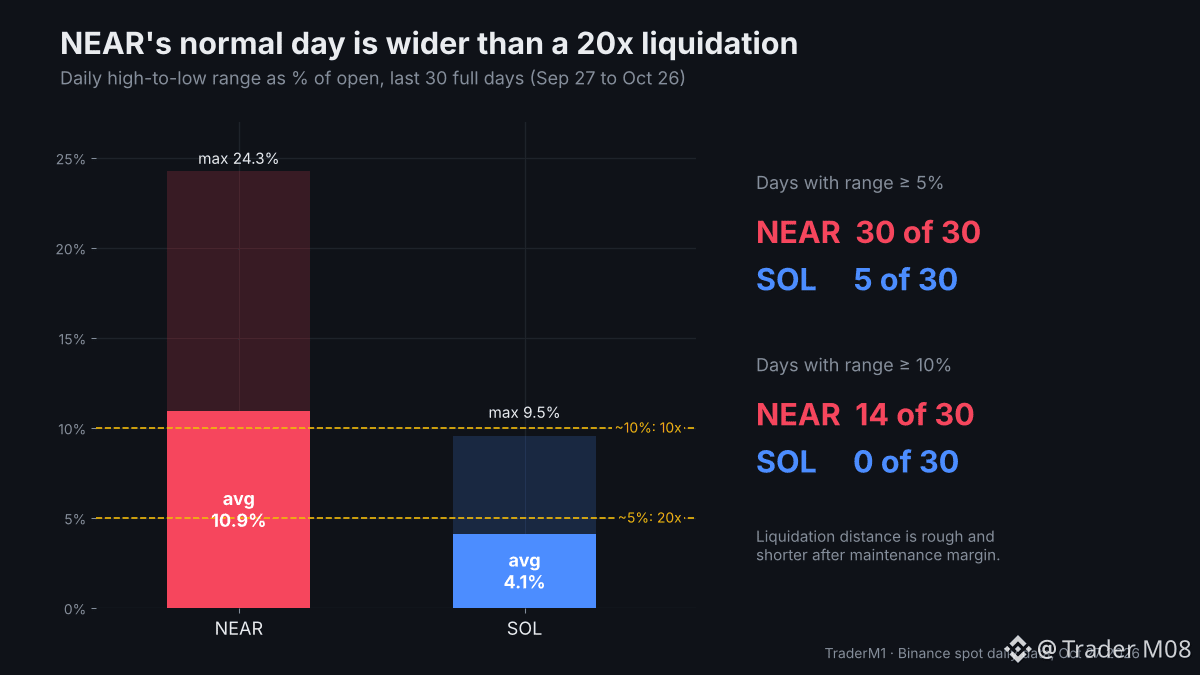
Every day for the last 30, $NEAR moved more than the 5% that wipes out a 20x position.
Rough rule: at 20x, a move of about 5% against you takes the margin. At 10x, about 10%. Maintenance margin makes the real distance a bit shorter.
Daily high-to-low range as a % of the open, last 30 full days on Binance spot:
- NEAR: average 10.9%. 30 of 30 days moved 5% or more, 14 days moved 10% or more. Biggest day: 24.3%.
- $SOL averaged 4.1%. 5 days moved 5% or more, none moved 10%. Biggest day: 9.5%.
A day's range isn't all against you, so not every one of those days would have liquidated a 20x. But a single wick is enough.
What I take from it:
1. Check the coin's normal daily range before picking leverage
2. Keep the liquidation price outside a normal day's range
3. On wide-range coins, cut the size, not the stop distance
What leverage would you use on a coin that moves 10.9% on an average day, if any?
100
·
--
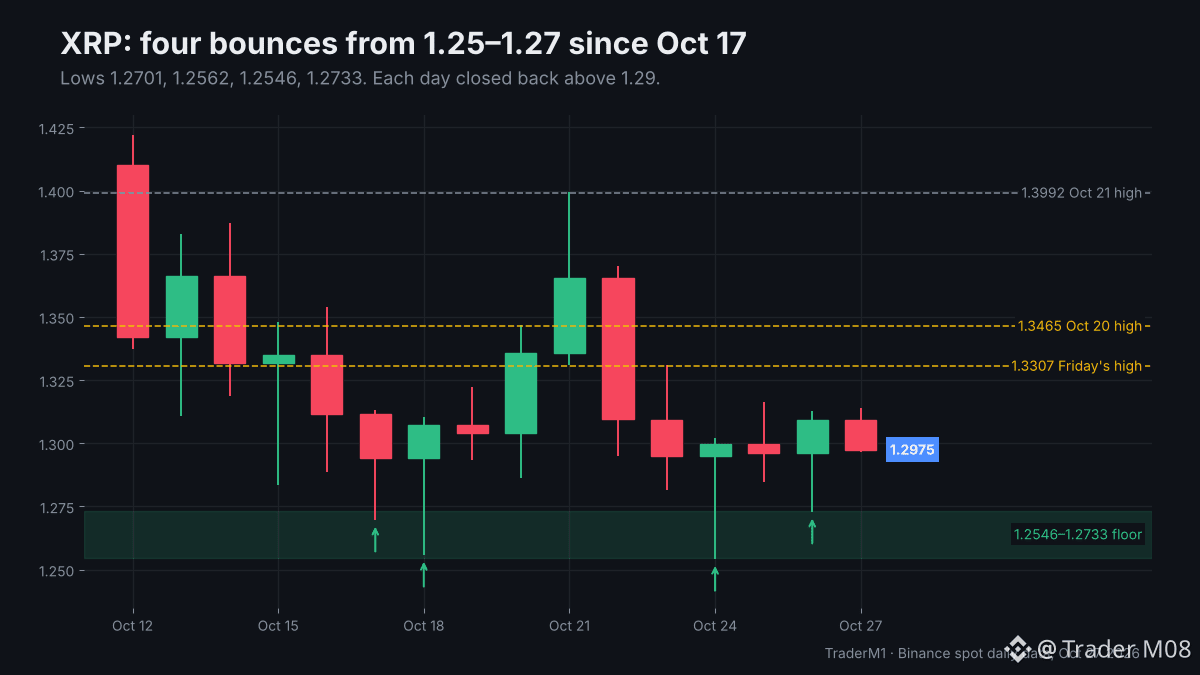
$XRP has bounced from the 1.25 to 1.27 zone four times since Oct 17.
Daily lows:
- Oct 17: 1.2701
- Oct 18: 1.2562
- Oct 24: 1.2546
- Oct 26: 1.2733
Each of those days closed back above 1.29. Yesterday XRP closed at 1.3092, up 1.0%, while BTC closed flat.
Above:
- 1.3307: Friday's high
- 1.3465: Oct 20 high
- 1.3992: Oct 21 high, the top of the last bounce
Below: a daily close under 1.2546 is a new 30-day low. XRP is down 14.5% since Sep 28, and funding sits at the 0.0100% default, so perps aren't leaning hard either way.
NFA. Do you buy a fifth test of 1.25, or wait for a daily close over 1.3307?
{spot}(XRPUSDT)
$XRP has bounced from the 1.25 to 1.27 zone four times since Oct 17.
Daily lows:
- Oct 17: 1.2701
- Oct 18: 1.2562
- Oct 24: 1.2546
- Oct 26: 1.2733
Each of those days closed back above 1.29. Yesterday XRP closed at 1.3092, up 1.0%, while BTC closed flat.
Above:
- 1.3307: Friday's high
- 1.3465: Oct 20 high
- 1.3992: Oct 21 high, the top of the last bounce
Below: a daily close under 1.2546 is a new 30-day low. XRP is down 14.5% since Sep 28, and funding sits at the 0.0100% default, so perps aren't leaning hard either way.
NFA. Do you buy a fifth test of 1.25, or wait for a daily close over 1.3307?
15
·
--
Moving your stop doesn't remove the loss. It makes it bigger.
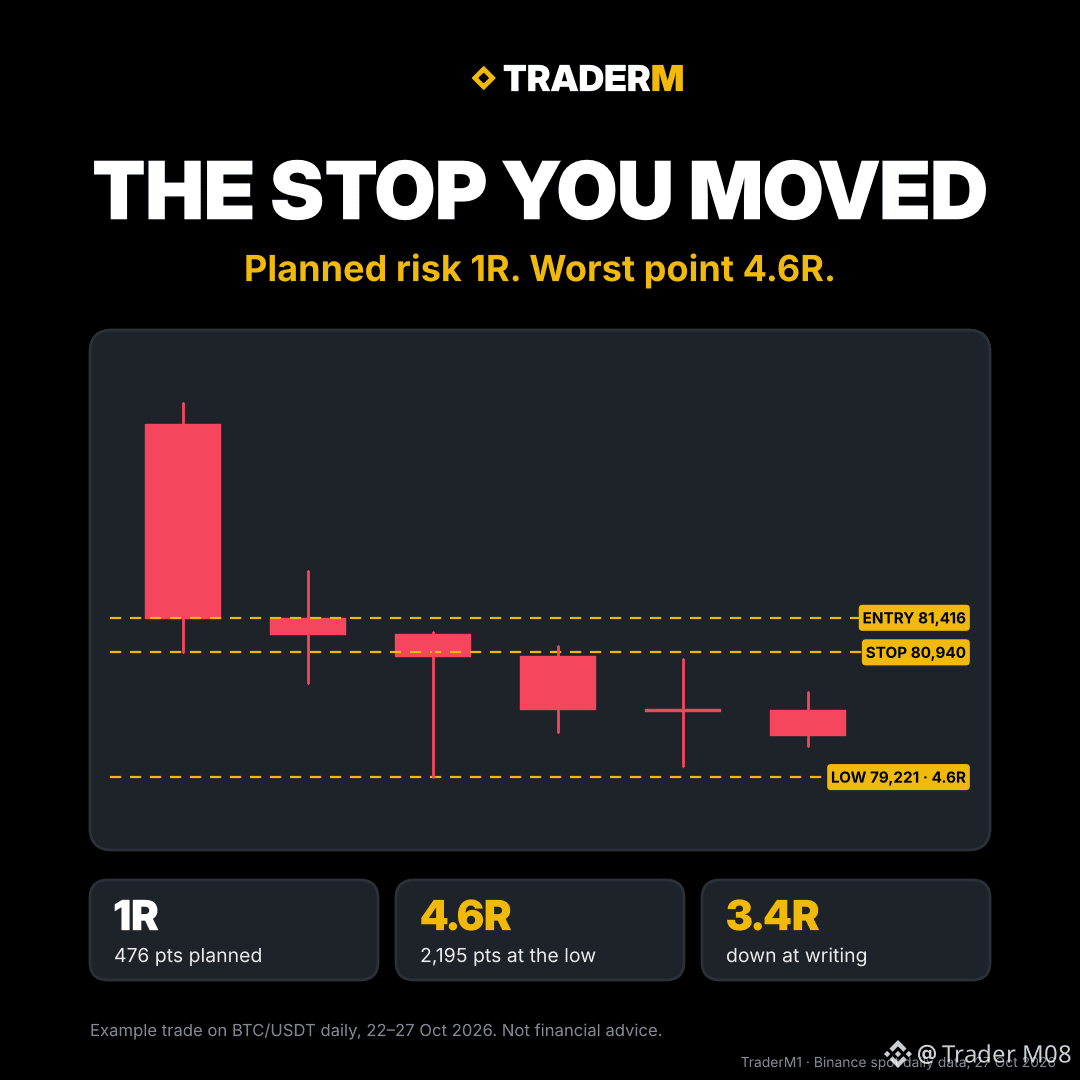
An example $BTC trade from this week's daily chart:
- Long at the Oct 22 close: 81,416
- Stop under that day's low: 80,940
- Planned risk: 476 points. Call it 1R.
On Oct 23 price dipped to 80,513 and the stop got hit. Most of us know the next thought: "Just a wick, give it room." So the stop moves lower.
What came next:
- Oct 24 low: 79,221. That's 2,195 points under entry, about 4.6R
- At writing BTC sits near 79,800, still about 3.4R underwater
- Six daily candles in a row are red, counting today's
The original stop would have cost 1R and left a clear head for the next setup. The moved stop turned one small, planned loss into a hope trade.
Why we do it: a hit stop feels like being wrong, and a loss hurts more than an equal gain feels good. Moving the stop delays that feeling. It doesn't cancel it.
One rule that helps: set the stop before entry, write it down, and only ever move it in the direction of the trade.
NFA.
When you moved a stop, did it save the trade, or end like this one?
$BTC
30
Войдите, чтобы посмотреть больше материала
Присоединяйтесь к пользователям криптовалют по всему миру на Binance Square
⚡️ Получайте новейшую и полезную информацию о криптоактивах.
💬 Нам доверяет крупнейшая в мире криптобиржа.
👍 Получите достоверные аналитические данные от верифицированных создателей контента.
Эл. почта/номер телефона
В тренде
FedWatch
Просмотров: 16.3M
39,380 обсуждают
🚨 🇺🇸 PETER SCHIFF JUST THREW A BIG WARNING AT THE FED!
Peter Schiff is calling Kevin Warsh’s tough talk on inflation a “bluff,” and his prediction could have major implications for the markets.
Schiff believes the Fed could eventually return to money printing through quantitative easing (QE) and even cut interest rates next year, despite inflation continuing to rise.
Think about that for a moment.
🔥 Inflation could remain a problem. 🔥 The Fed could still move toward easier monetary policy. 🔥 More liquidity could flow into financial markets.
If this scenario plays out, it could create a very different market environment for stocks, gold, Bitcoin, and the wider crypto market.
But there’s a catch: if inflation stays high, the Fed could face a difficult choice between fighting rising prices and supporting the economy.
Will Warsh stick to a tough inflation policy, or will the Fed eventually change direction?
The next move could matter a lot for investors.
#FedWatch #EarningsSeason #USMidtermElections #BrazilCryptoExchangesMustApplyForLicensesByFriday #StanDruckenmillerBecomesInvestorInTradeXYZ
Jackson Liam
·Лайков: 4
·Просмотров: 8.3k
EarningsSeason
Просмотров: 6.4M
32,082 обсуждают
USMidtermElections
Просмотров: 39,967
613 обсуждают