

Top1Futures
3.9k Публикации

Top1Futures
Отправить жалобу
Заблокировать пользователя
Professional trader • Market Insights • Risk-managed trades • Retail access
Трейдер с регулярными сделками
3.8 г
131 подписок(и/а)
2.6K+ подписчиков(а)
10.6K+ понравилось
Посты
Все
Цитирования
Видео
Активно
·
--
Рост
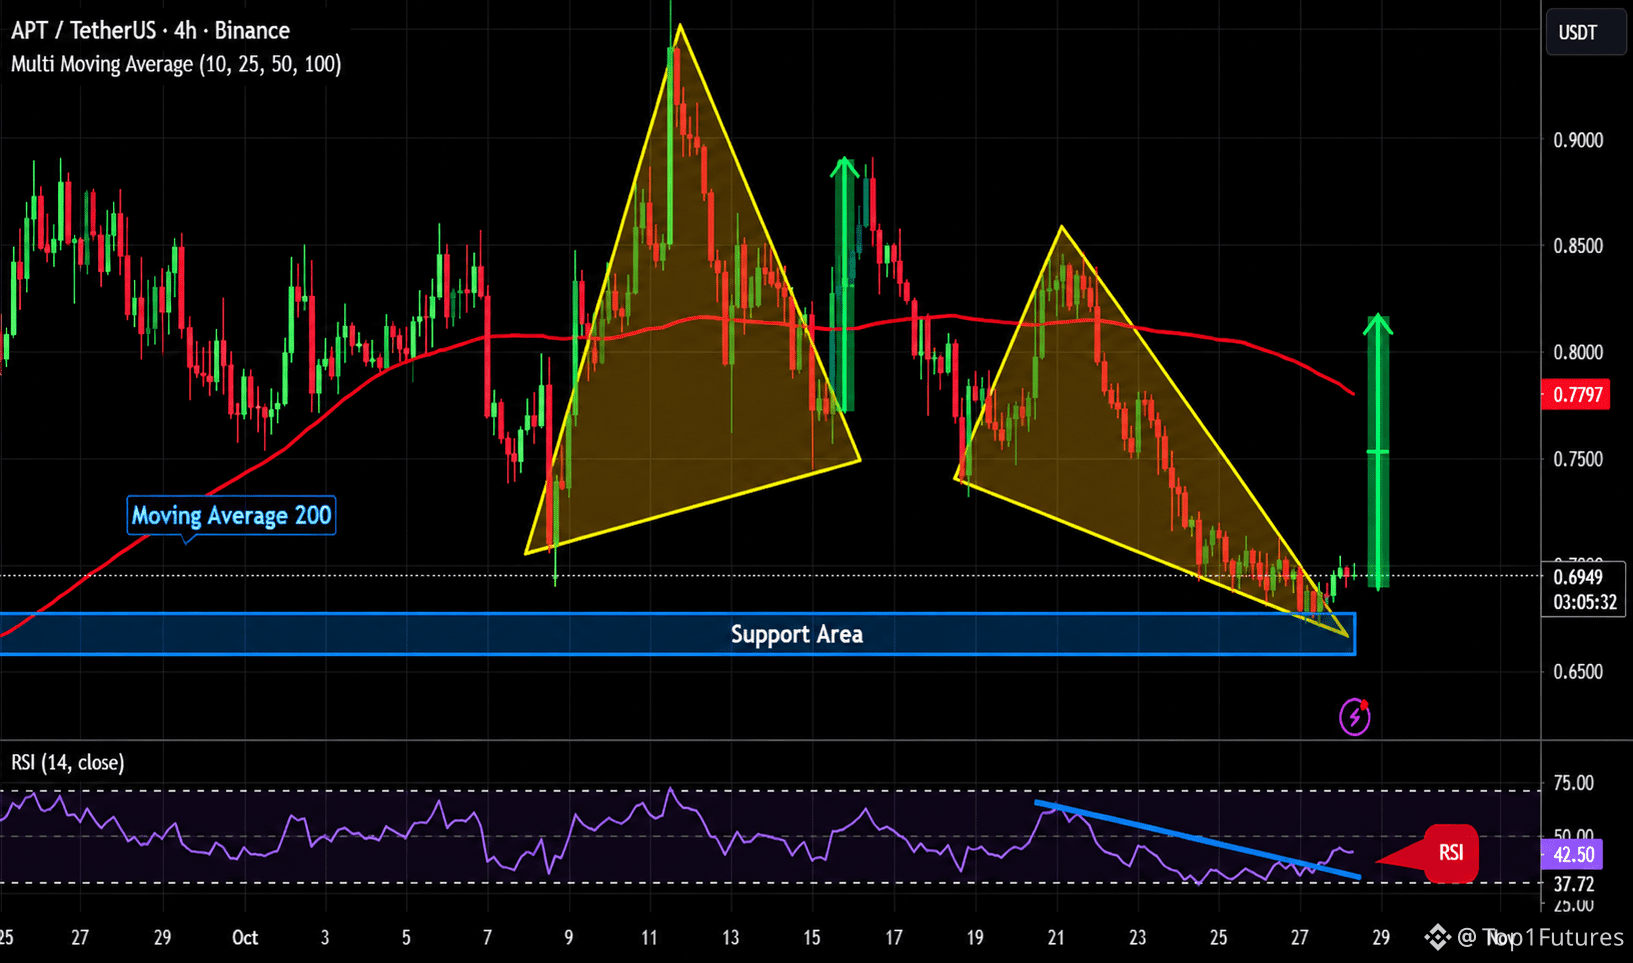
$APT is showing some interesting strength even while the market stays shaky.📈
It's Price bounced from the $0.6600 support zone, and the second triangle breakout is giving bulls another chance to push higher. 🚀 RSI is also moving up after breaking its descending trendline, which could support further recovery.
🎯 Target: $0.8150
If buyers keep the momentum, APT may climb toward this level. But losing support could bring more downside, so watch the confirmation carefully..... 📊
5
·
--
Рост
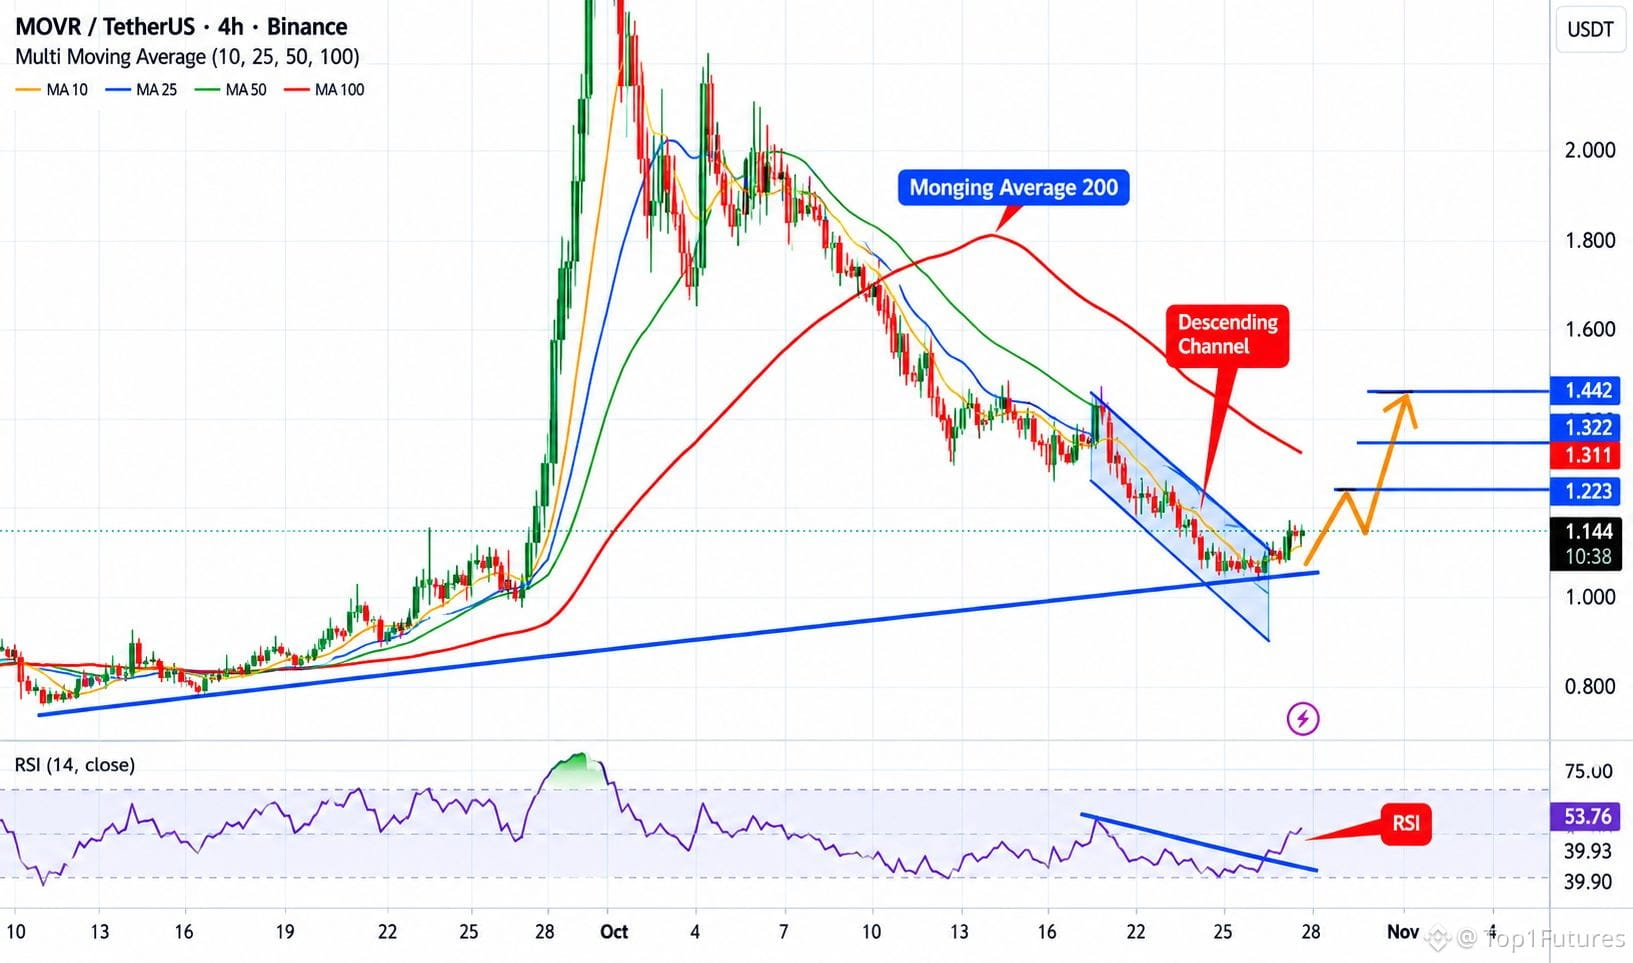
$MOVR 📈 IS SHOWING SIGNS OF A BULLISH REVERSAL!🎯
After a nearly 3x rally in October, MOVR has pulled back to a major ascending trendline that previously supported its explosive move. Now, the chart is showing some interesting signals. 👀
📊 What I'm Watching:
🔹 MOVR has broken above its descending channel on the 4H timeframe, suggesting that selling pressure may be weakening.
🔹 The RSI has also broken above its descending trendline and climbed toward 54, supporting the possibility of a momentum shift.
🔹 Price is currently hovering around $1.14, with the major ascending trendline acting as key support.
🎯 Upside Targets:
• $1.223 — First resistance
• $1.322 — Next target
• $1.442 — Major upside target
📈 My Take: If MOVR holds its trendline support and builds momentum above $1.22, we could see a recovery toward $1.32 and potentially $1.44.
⚠️ Invalidation: Multiple 4H candle closes below the ascending trendline would weaken this bullish setup and increase downside risk.
The breakout is promising, but confirmation matters more than hype. Watch the support, monitor momentum, and let price action make the decision.
#MOVR
1
53
·
--
Падение
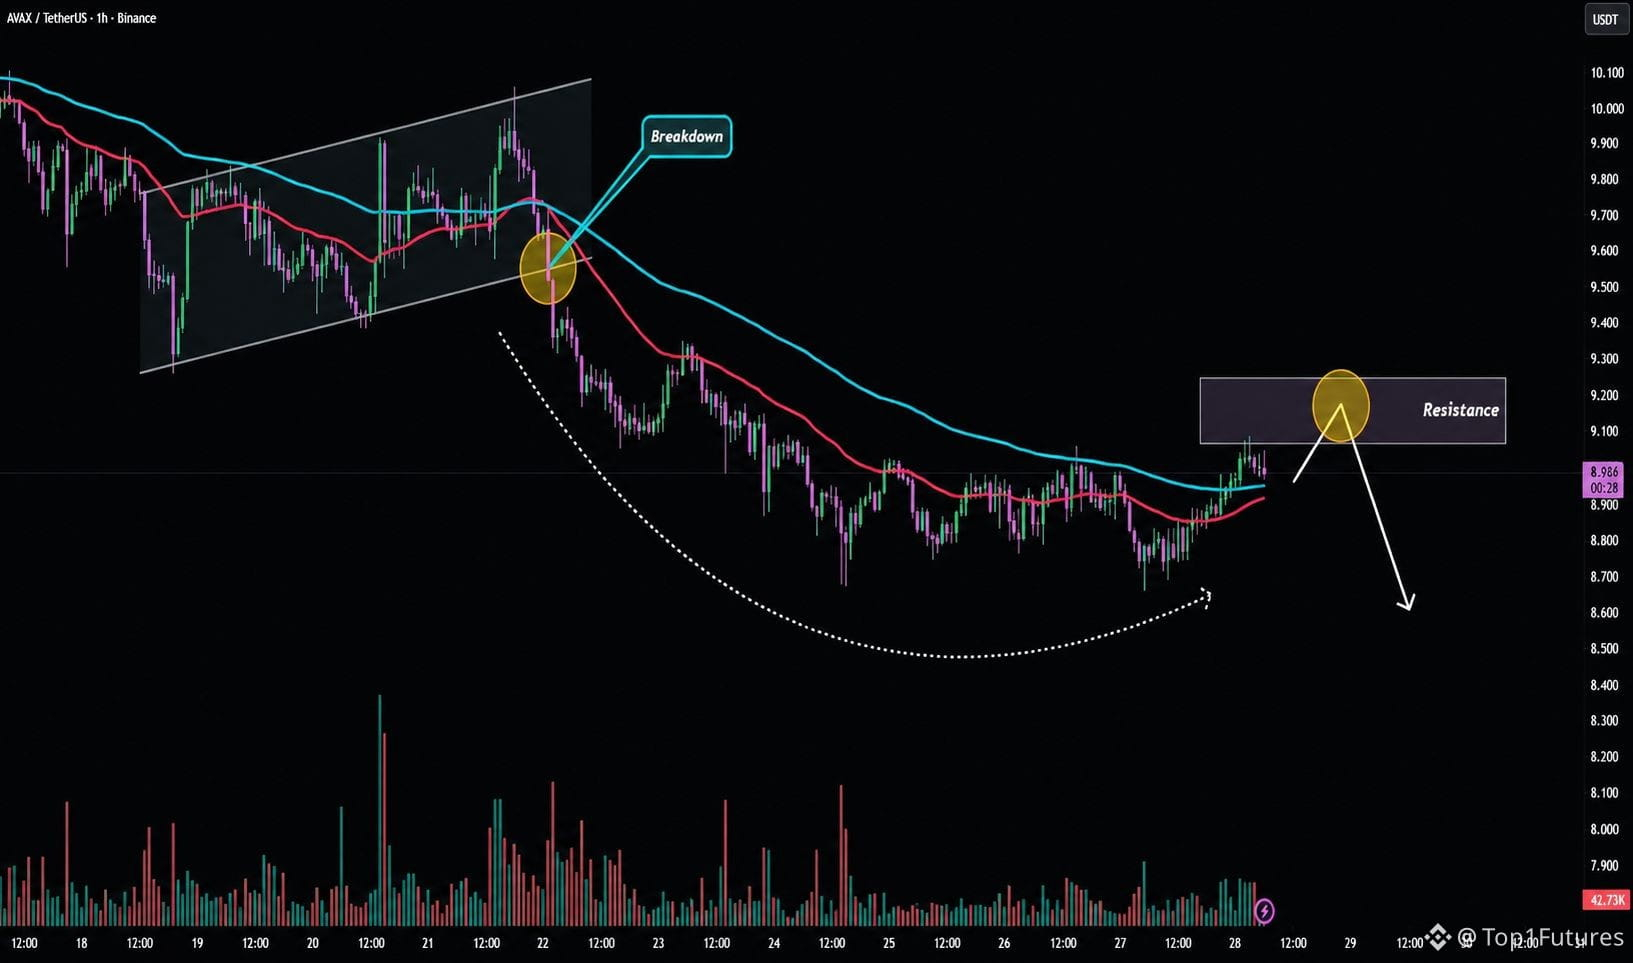
$AVAX 🔻 is trying to bounce back from recent lows, but I’m not convinced the bulls are back in control just yet.
On the 1H chart, price is moving towards the $9.10–$9.25 resistance zone. If buyers gets rejected here, we could see another drop towards $8.75, with $8.55–$8.60 as the next possible downside target 📉
The bigger picture still looks weak after that channel breakdown, and the slower EMA is also acting as resistance.
🌍 Meanwhile, a stronger dollar and rising US bond yields could put more pressure on altcoins in the coming sessions, especially if the Fed sounds hawkish.
⚠️ But if AVAX breaks above $9.25–$9.30 and holds there, this bearish idea may fail.
Let's see how price reacts at resistance! 🎯
1
38
·
--
$HYPE at $81 — Will Bulls Defend This Level or Lose Control?
Kraken’s parent company, Payward, plans to use Hyperliquid’s infrastructure for regulated perpetual futures markets in the US, pending regulatory approval. Could this become a bigger catalyst for HYPE? 🚀
Technically, $79–$84 is the key demand zone. The 100-day MA sits near $80, while $81 marks crucial structural support.
📉 A daily close below $80 could open further downside. Bulls need to reclaim the H4 moving averages to revive recovery hopes.
$HYPE
{future}(HYPEUSDT)
$HYPE at $81 — Will Bulls Defend This Level or Lose Control?
Kraken’s parent company, Payward, plans to use Hyperliquid’s infrastructure for regulated perpetual futures markets in the US, pending regulatory approval. Could this become a bigger catalyst for HYPE? 🚀
Technically, $79–$84 is the key demand zone. The 100-day MA sits near $80, while $81 marks crucial structural support.
📉 A daily close below $80 could open further downside. Bulls need to reclaim the H4 moving averages to revive recovery hopes.
$HYPE
1
52
·
--
Рост
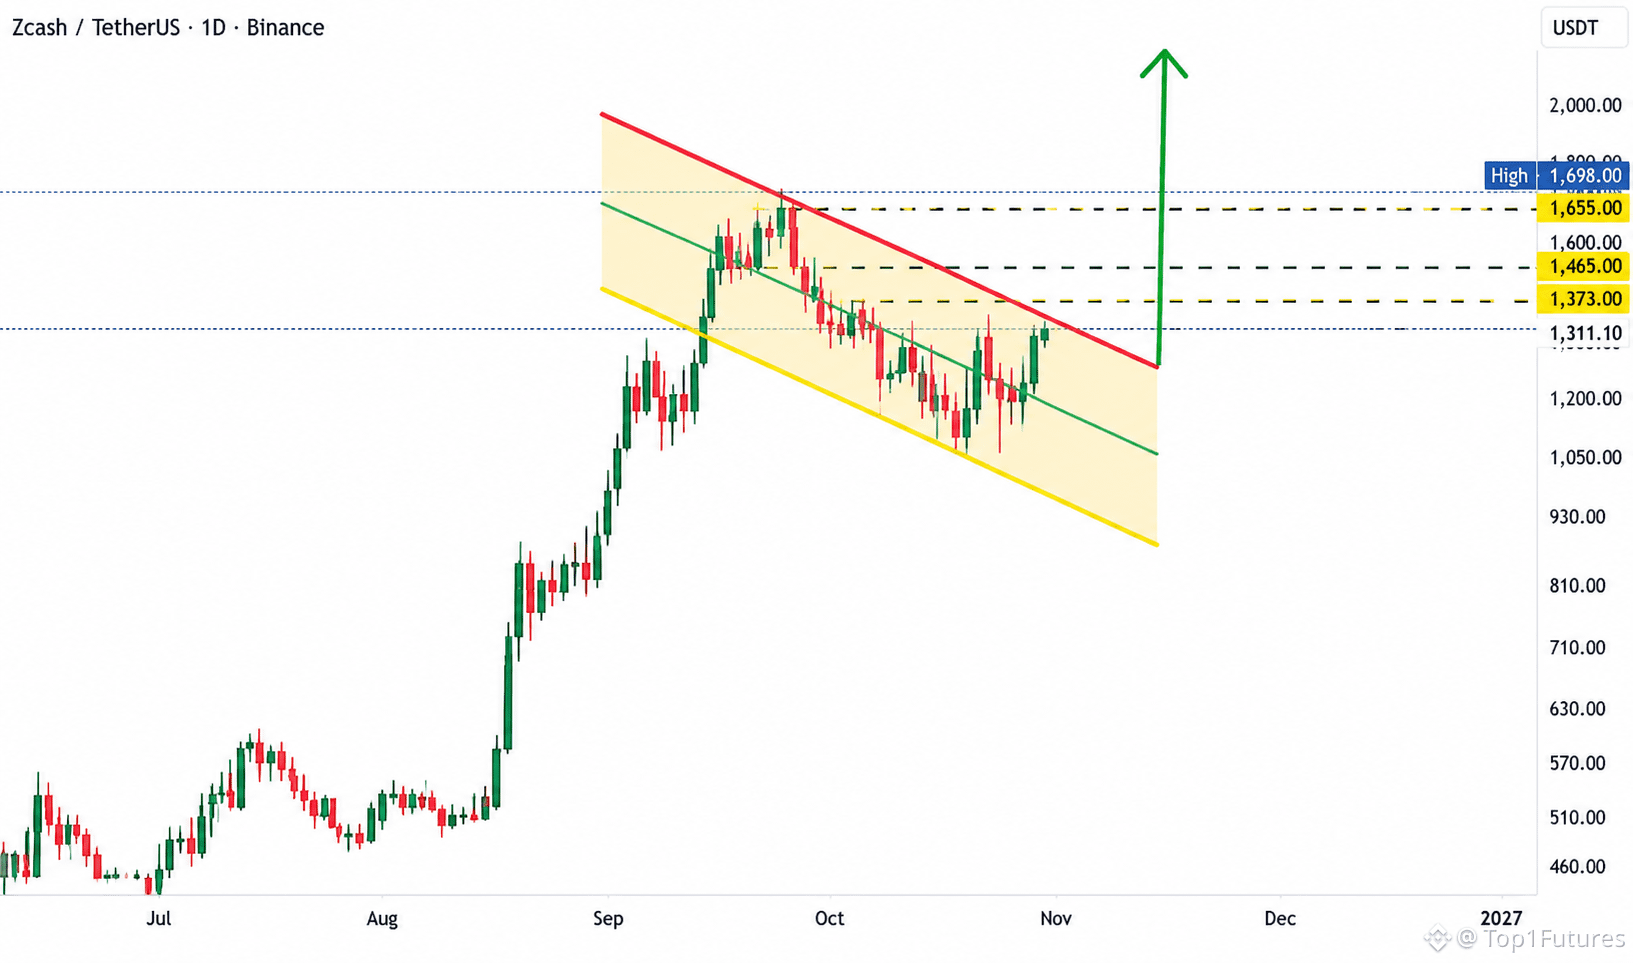
$ZEC is looking another strong rally 🚀🚀📈
it's price is moving inside a downward channel. This could be a bull flag, and a breakout might trigger another upward move. 🚀
I'm watching $1,373 and $1,465 first, while $1,655–$1,698 is the major resistance zone. If buyers break above this area with strong momentum, ZEC could move toward $2,000 or even higher.
📈 But wait for breakout confirmation before making any move!
$ZEC
{future}(ZECUSDT)
$ZEC is looking another strong rally 🚀🚀📈
it's price is moving inside a downward channel. This could be a bull flag, and a breakout might trigger another upward move. 🚀
I'm watching $1,373 and $1,465 first, while $1,655–$1,698 is the major resistance zone. If buyers break above this area with strong momentum, ZEC could move toward $2,000 or even higher.
📈 But wait for breakout confirmation before making any move!
$ZEC
1
158
·
--
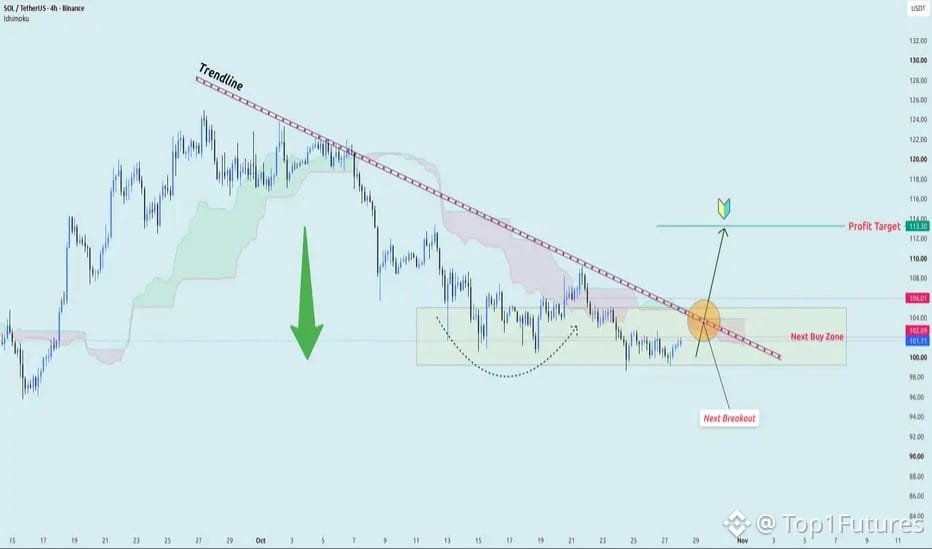
$SOL is trying to find some strength on the 4H chart, but buyers still have one big challenge ahead‼️
Price is moving near a descending trendline, and the Ichimoku cloud is also acting like a barrier. Right now, I’m keeping an eye on the 102.09–106.01 zone. 🔍
If SOL breaks above this area and holds it properly, we might see buyers gaining control again. 🚀 The next possible target is around 113.30, if bullish momentum continues to build.
But don't rush into a long trade yet! ⚠️ A rejection from the trendline can send price back toward the support base.
If SOL loses that support, the recovery idea may fail.
Let’s wait for a confirmed breakout. 👊 Will SOL finally escape this downtrend, or sellers strike again?
1
318
·
--
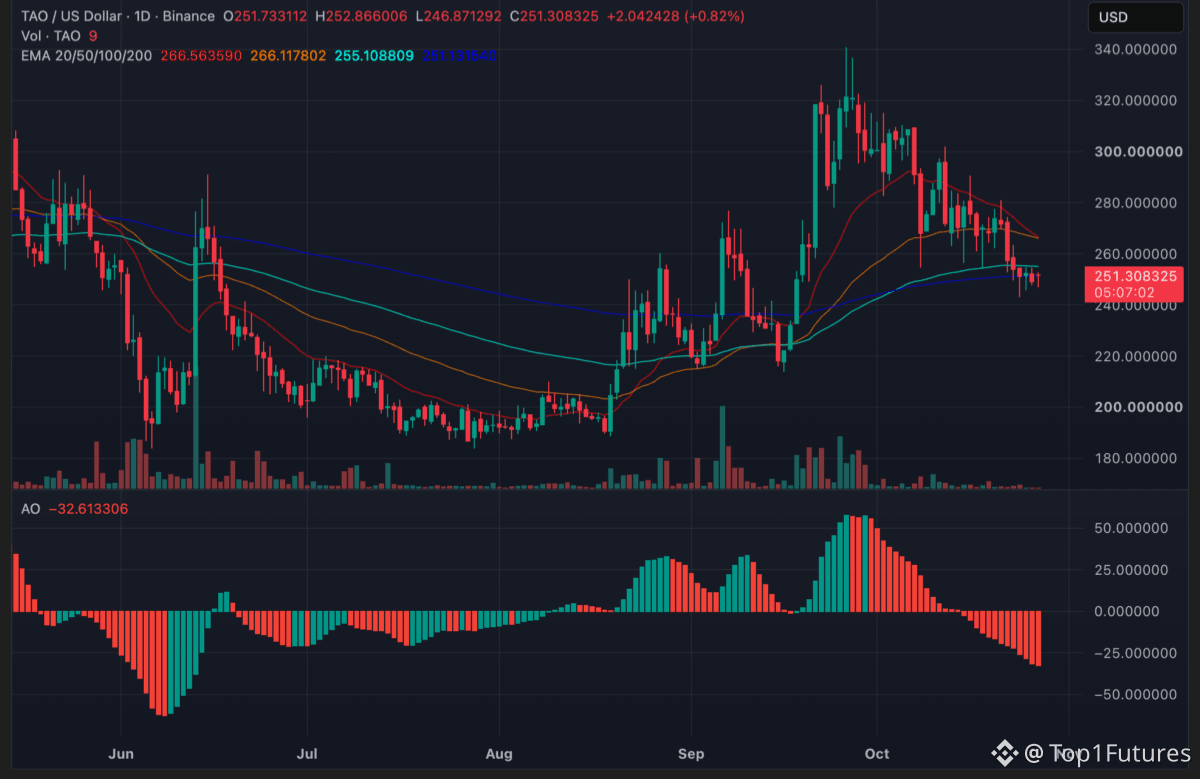
$TAO /USDT — Is a recovery coming, or more downside ahead ❔
TAO is trying to stay stable around $250 after losing a big part of its September rally. 🚨 The token previously climbed above $320, but October selling pressure pushed it much lower.
Right now, the $245–$247 zone is important. If buyers defend this support, TAO could bounce toward $255–$260. A breakout above this area may open the door for a move toward $266–$270. 📈
But don't get too bullish yet! If sellers break below $245, the price could slide toward $240 or even $230. 📉
Grayscale's ETF filing could bring more attention to TAO in the future, but nothing is guaranteed.
👀 Watch the support and breakout confirmation before taking any trade!
1
214
·
--
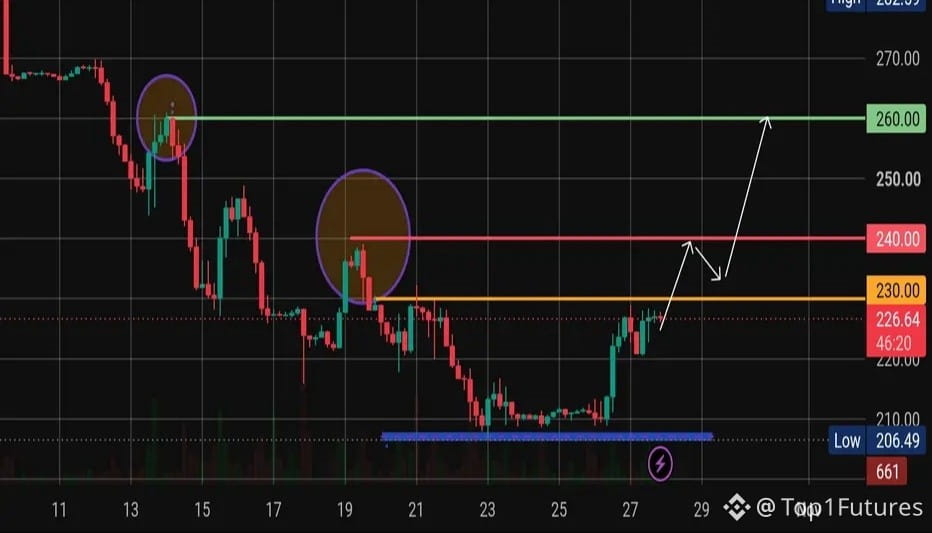
$ARM is looking interesting again❗👀
After a long period of selling, buyers are finally showing some strength near the $206 support area, pushing price back toward $226 on the 4H chart.
Now the big question is, can bulls take control from here? 🤔
🟠 $230: The first hurdle. A breakout and successful retest could bring fresh buying pressure.
🔴 $240: If momentum continues, price may move toward this next resistance.
🟢 $260: A bigger target if buyers keep pushing and the bullish momentum gets stronger.
With AI demand still attracting attention to semiconductor stocks, ARM could have more room to recover. 🚀 But don't rush in yet!
If price gets rejected near $230, another pullback is possible. And losing the $206 support could weaken this bullish setup completely.
For now, I'm watching how price reacts around $230 before expecting the next move. 📊
DYOR
#arm
1
90
·
--
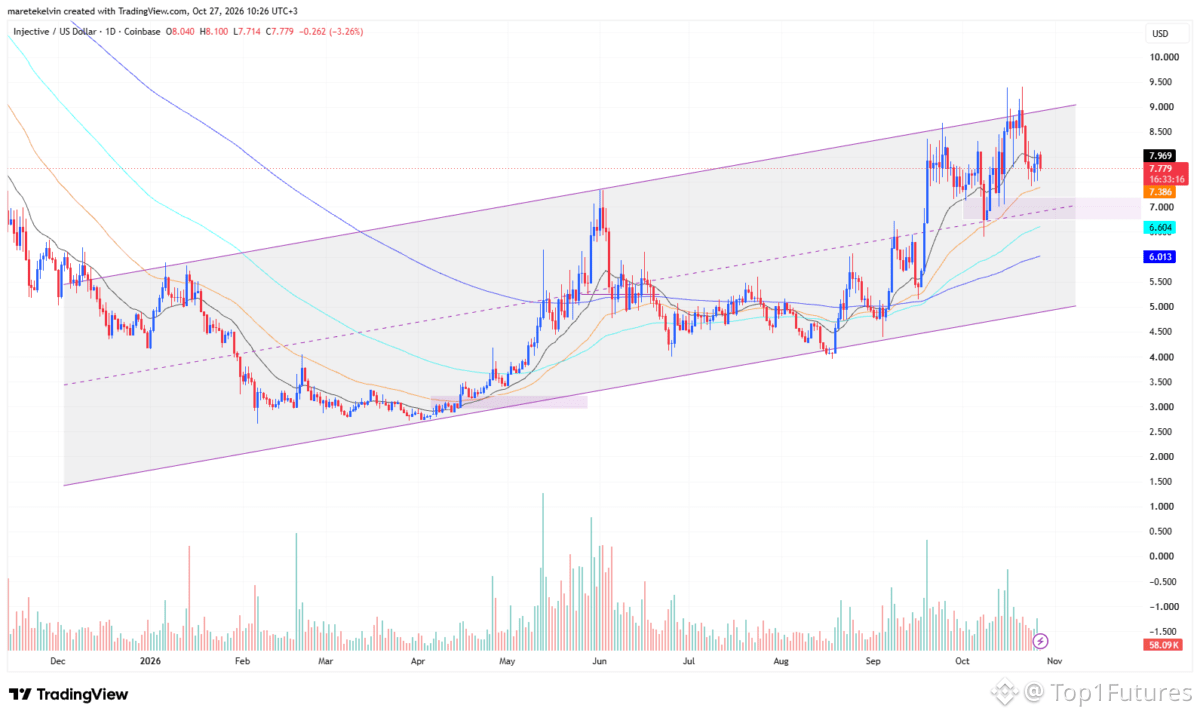
$INJ ⚠️ is still struggling to make a strong comeback‼️📉
Buyers tried to push the price higher, but sellers came back with another rejection, putting more pressure on INJ.
Currently, INJ is trading below its 20-day EMA around $7.779. This level is becoming a tough barrier for bulls, and if the price fails to break above it, we could see another downward move in the coming sessions.
For now, the $7 zone is an important level to watch. 👀 If selling continues with the same pressure, INJ may revisit this demand area, where buyers could try to stop the fall and start a recovery.
But there is still some hope for bulls. If INJ manages to reclaim the 20-day EMA and hold above it, the market sentiment may slowly improve, possibly opening the door for a fresh upward move. 🚀
Another thing to notice is Open Interest, which has fallen sharply toward $79 million. This shows traders are reducing their positions or leverage. Meanwhile, supply in profit is staying around $75 million, showing little recent change.
So, INJ remains under pressure for now. ⚠️ Watch the $7 support and EMA breakout carefully before making any trading decision.
1
412
·
--
$CAP 🔻DOWN 19% — IS A BOUNCE COMING NEXT❔👀
CAP has taken a serious hit, dropping around 19% in the last 24 hours. But wait, traders! The market data is showing some interesting signals that could open the door for a potential recovery. 🔥
📊 Here’s What Smart Traders Are Watching:
💰 Spot Outflows Hit $682K
CAP recorded around $682K in negative spot netflow. This means more capital flowed out of exchanges than entered, which could indicate reduced immediate selling pressure. However, outflows alone don't confirm accumulation or guarantee a price reversal.
🐂 Long Positions Still Dominate
CAP's funding rate stands at 0.0182%, suggesting long positions are paying shorts. Despite the sharp decline, bullish positioning remains in the market.
⚡ $1.03M in Liquidations
Around $1.03M worth of positions were liquidated, including approximately $603K in shorts and $430K in longs. This shows that both sides are facing pressure as volatility increases.
🎯 My Trader's Outlook:
CAP could attempt a relief bounce if buyers step in and selling pressure begins to fade. However, after a 19% drop, another downside move is still possible.
I'm watching for price stabilization, stronger buying volume, and a clear break above nearby resistance before considering a bullish continuation.
🔥 The Next Move Could Be Crucial! Will CAP recover from this sharp correction, or will bears push it even lower?
Drop your CAP price target in the comments! 👇
DYOR⚡
#CAP #Altcoins
1
192
·
--
$AKT 🧾Well, something interesting is happening with Akash Network ‼️👀
The project is planning to move its token from Cosmos to Solana, and the proposal is getting huge support from voters. Around 98% are voting in favor, but the final decision is still pending until November 2.
The main reason behind this move could be Solana's lower fees, stronger liquidity and growing DePIN ecosystem. If everything goes as planned, AKT may get more attention from traders and investors in the coming weeks. 👀
But what about the price? 📊
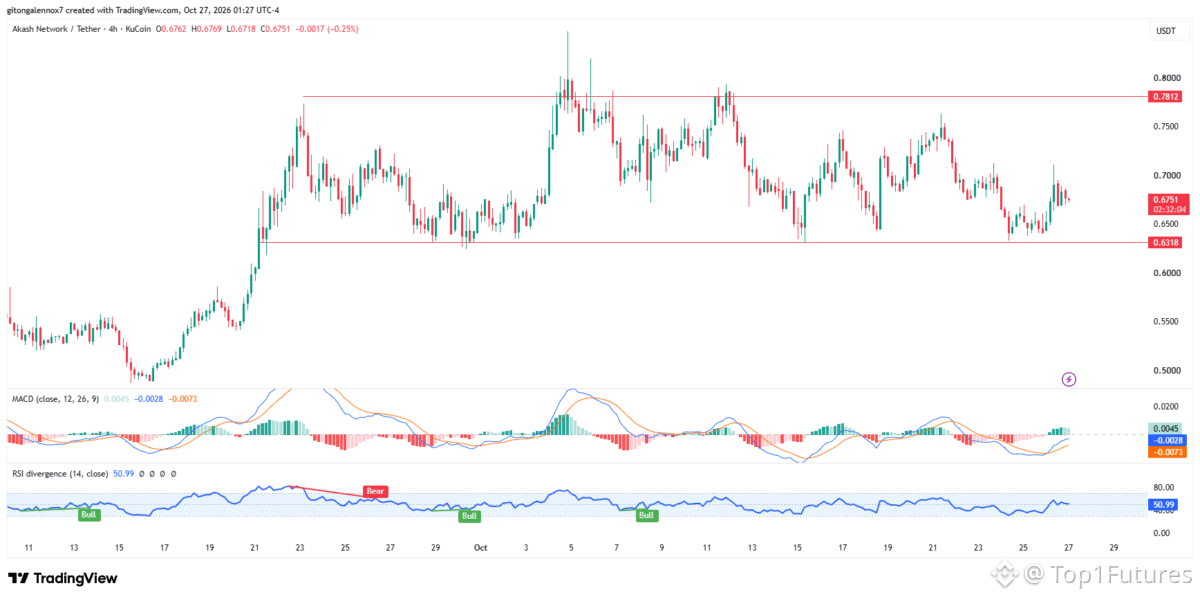
Currently, AKT is moving sideways between $0.63 and $0.78. The MACD is showing some positive signals, while RSI also hints at possible bullish momentum.
If buyers manage to push above $0.78, we could see another upward move. However, losing $0.63 may bring fresh selling pressure.
🔥 The coming days will be important for AKT. Will Solana give this token a new boost, or will the price continue consolidating? Let's watch closely!
#AKT
1
24
·
--
$MORPHO ✅ is pumping while $BTC and $ETH are bleeding… Is something bigger coming ‼️👀
Hey guys, MORPHO is showing some good strength after Bitso introduced its new Bóvedas feature, powered by Morpho. This lets users access on-chain yield opportunities through USDC and MXNB vaults. 🔥
The token jumped around 8.6%, with trading volume also increasing. Looks interesting, right? But don't rush into buying just because of this news!
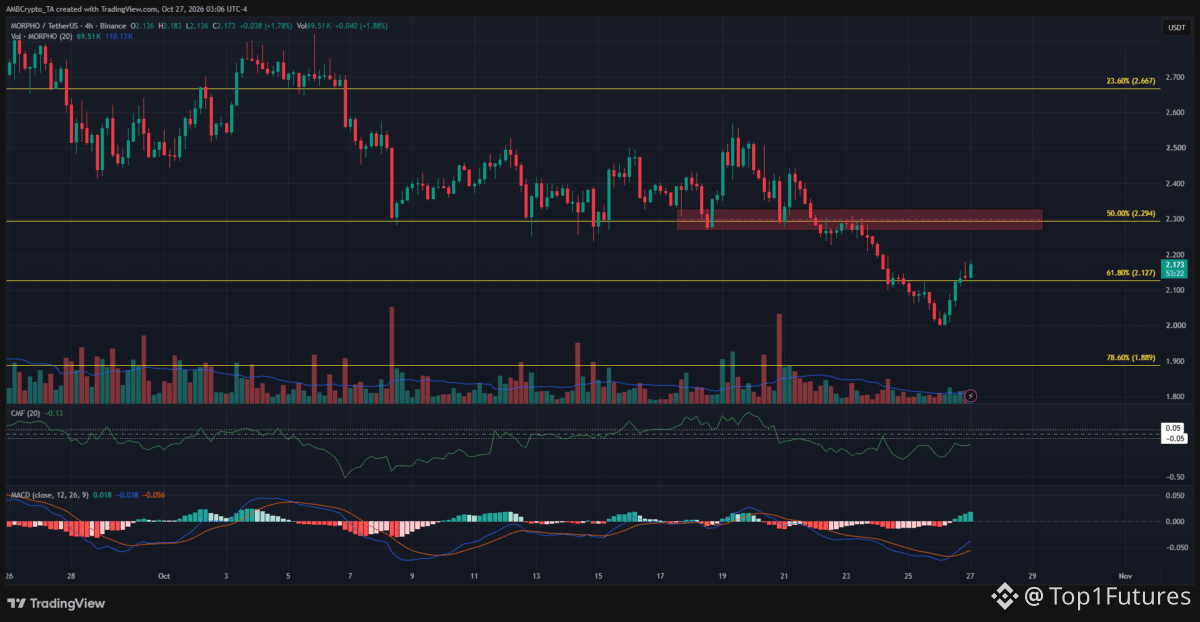
Price recently bounced near the $2 support area, but sellers are still creating trouble around $2.30. This level is very important for the next move.
If MORPHO breaks above $2.30 and holds there, buyers could regain control and push price toward higher resistance levels. 🚀 But if rejection happens again, we might see another drop toward $2.00 or even the $1.89 zone.
For a potential entry, I'm watching the $1.88–$2.12 area carefully. A breakdown below $1.80 could weaken the bullish setup.
Will MORPHO break $2.30 or trap late buyers? Keep watching volume and confirmation! 📊
#morpho
1
67
·
--
$SOL Has 9 BILLION transactions🧾, so why is the price crashing❓🔻
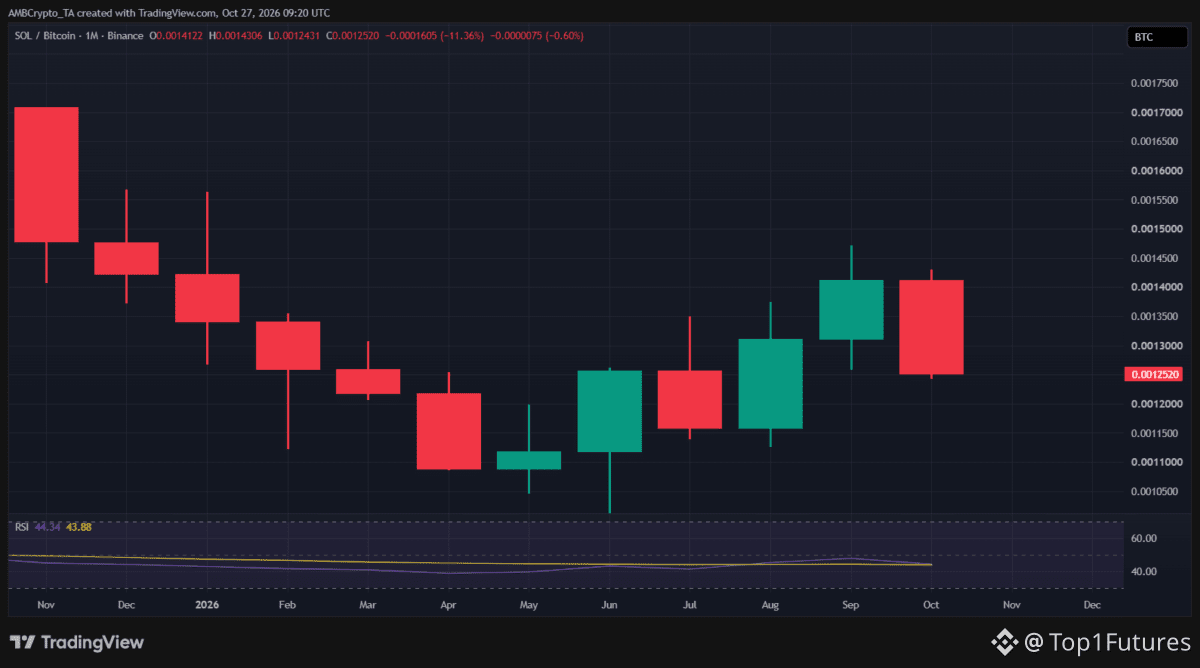
Solana is showing a strange situation right now! Despite massive network activity, SOL has dropped over 15% this month and slipped below $100. 📉
Here’s the problem: TVL fell from $6.42B to $5.76B, while stablecoin liquidity is also declining. This means fewer funds are flowing into Solana’s DeFi ecosystem, putting extra pressure on the price.
🔥 My take? If market sentiment improves and fresh liquidity returns, SOL could stage a strong recovery. But if outflows continue, further downside is possible before buyers step in.
Don't judge SOL by transactions alone. Watch liquidity, volume and BTC's direction before making a move.
Can SOL reclaim $100, or are we heading lower? 🚀
1
55
·
--
$XMR is getting stronger, but can XMR finally break $650 ‼️👀
See, $XMR is showing some interesting signs right now! 🔥 Its network hashrate has climbed to a six-month high of 7.17 GH/s, which shows that mining activity is getting stronger. But this alone doesn't mean the price will keep going up.
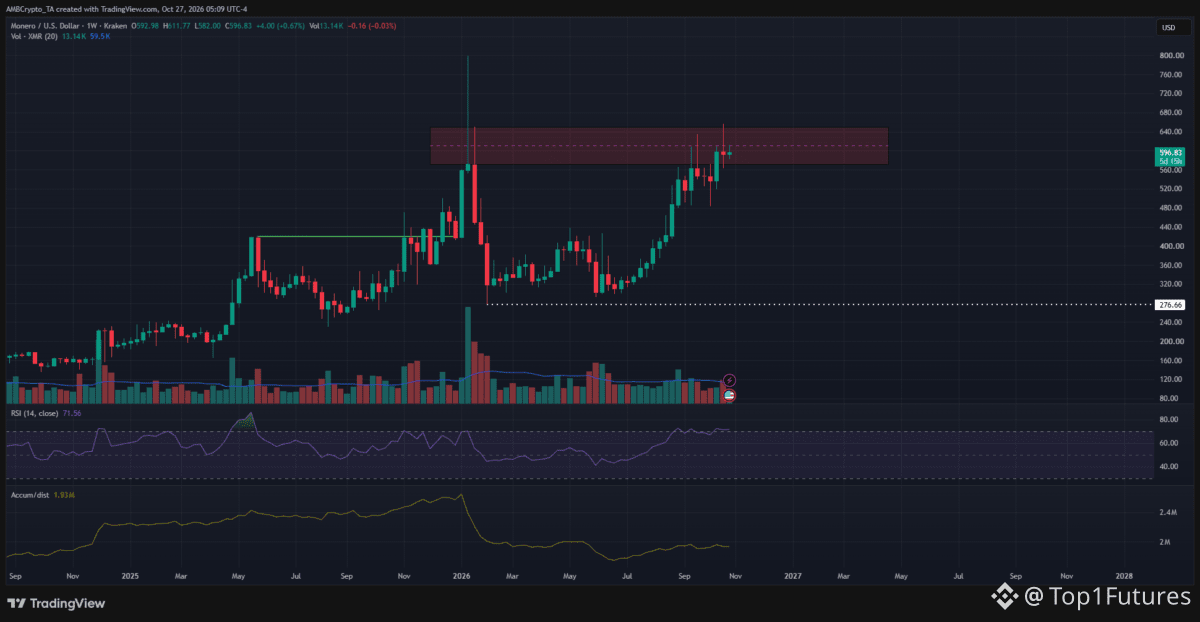
Price recently bounced back from around $564 and is now testing the $600 area again. Still, sellers are putting up a fight near the $600–$650 resistance zone. 📊
On the weekly chart, momentum looks bullish, but trading volume is not very impressive. So, a strong breakout might need more buyers to step in.
If bulls manage to push XMR above $640 and secure a weekly close over $650, we could see another move toward higher levels. 🚀 But if price gets rejected again, a drop toward $560 or even $520 is possible.
For now, I wouldn't rush into a long position. ⚠️ Let the price confirm its next move first.
Will XMR break $650 or face another rejection? What's your prediction? 👇
DYOR #xmr
1
108
·
--
Рост
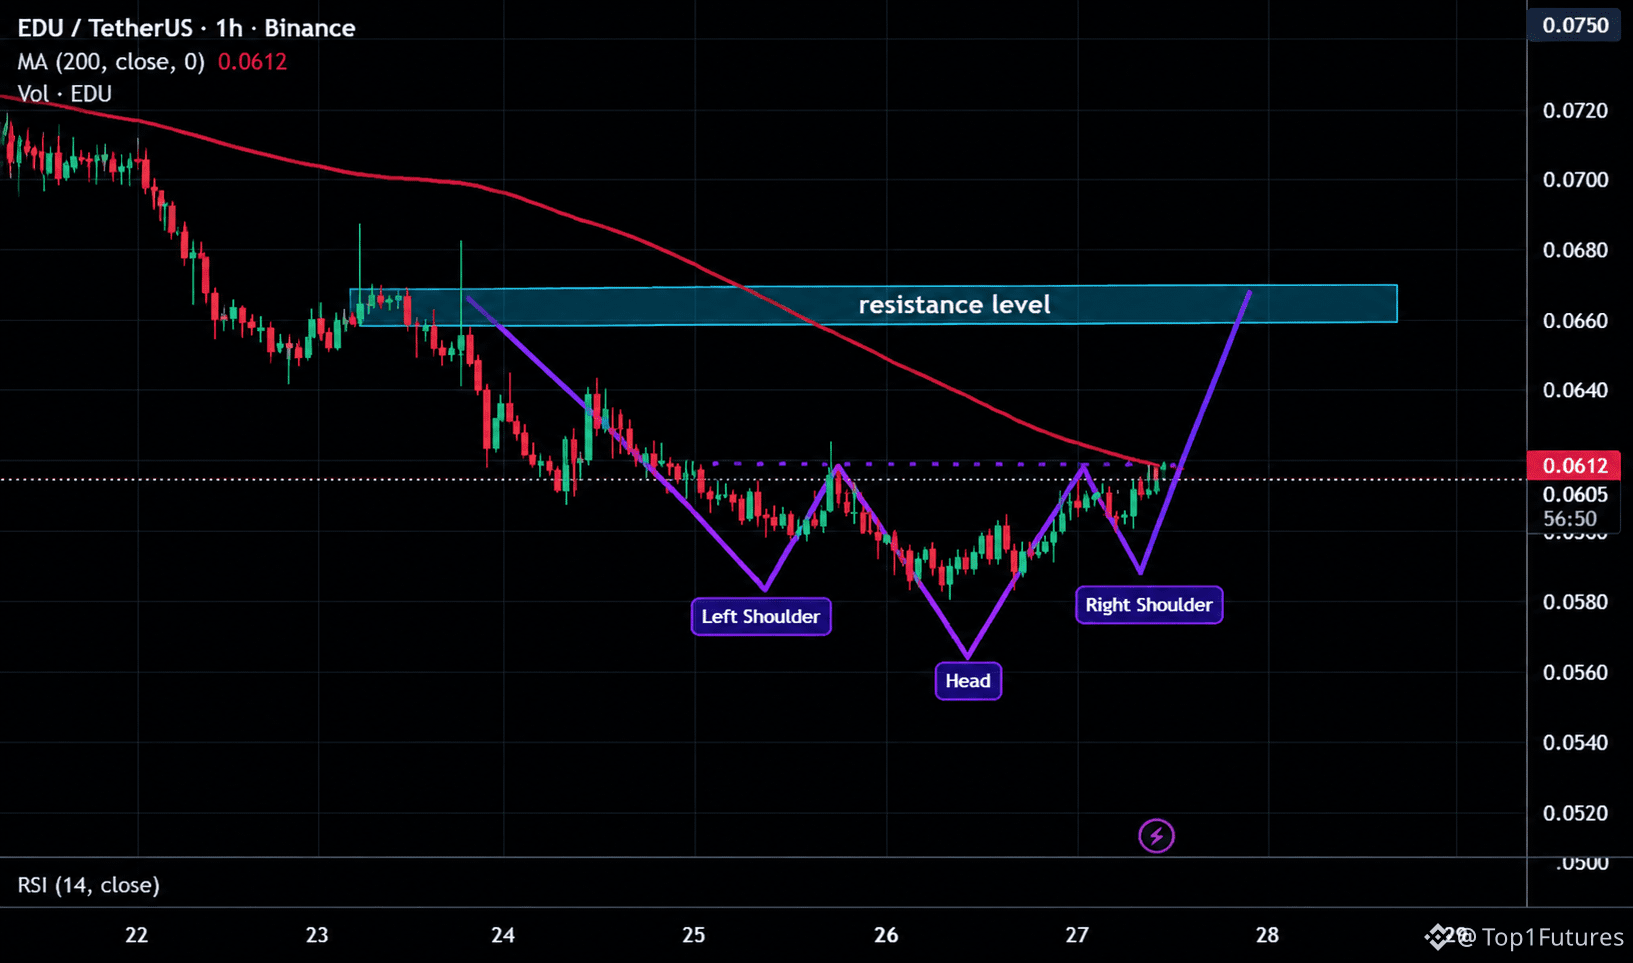
$EDU 📈 Is a bullish breakout coming next⚡🚀
#EDU is showing an interesting setup on the 1H chart! Price seems to be forming an inverse head-and-shoulders pattern, with the right shoulder almost completed. 👀
If buyers push above the 200 MA and break the neckline near $0.0612, we could see a move toward $0.0660 resistance. 📈 Bitcoin's next move may also help this setup.
But don't rush in yet! A confirmed breakout is needed before expecting a stronger rally. 🔥
DYOR
1
115
·
--
Рост
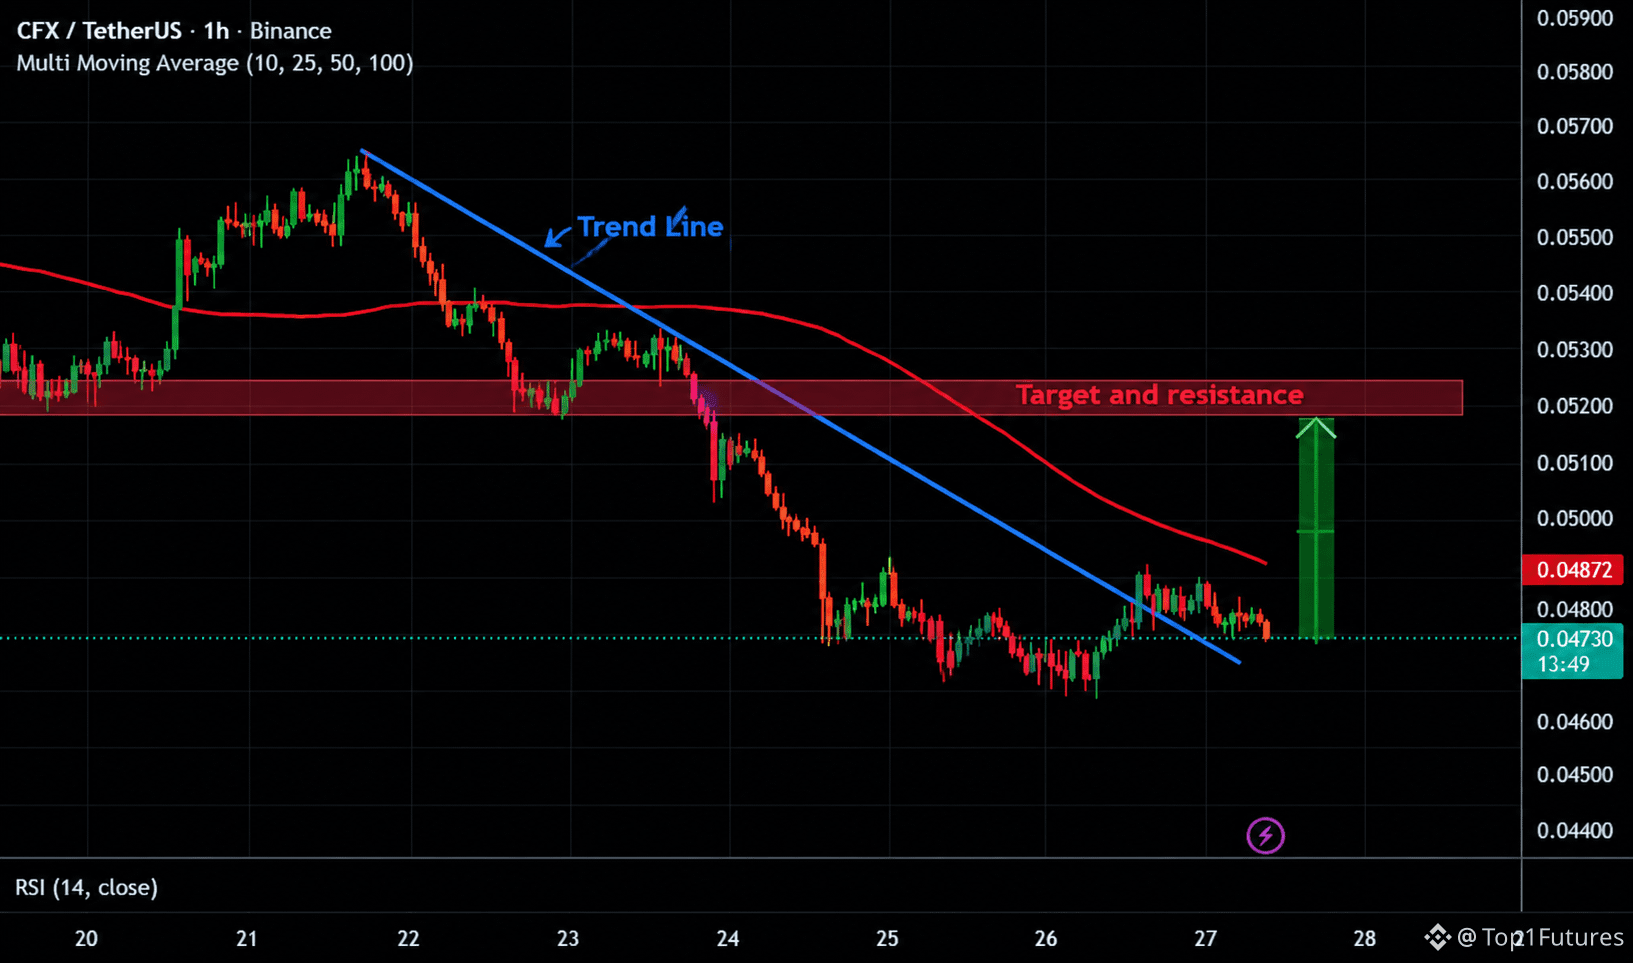
$CFX /USDT — Can bulls push price higher from here❔🚀🚀
CFX is showing some interesting movement on the 1H chart! 📊 After staying under a falling trendline for quite some time, price has finally broken above it and now coming back to test this area.
If buyers manage to hold this level, we could see another upward move towards $0.0500, and then the main resistance near $0.0520 🎯
But don't rush into a trade yet! ⚠️ Price is still below the moving average, so sellers can create more pressure.
If CFX drops below the trendline and stays there for over one candle, this bullish setup may fail. Let's see what happens next! 🔥
DYOR
#cfx
1
215
·
--
Падение
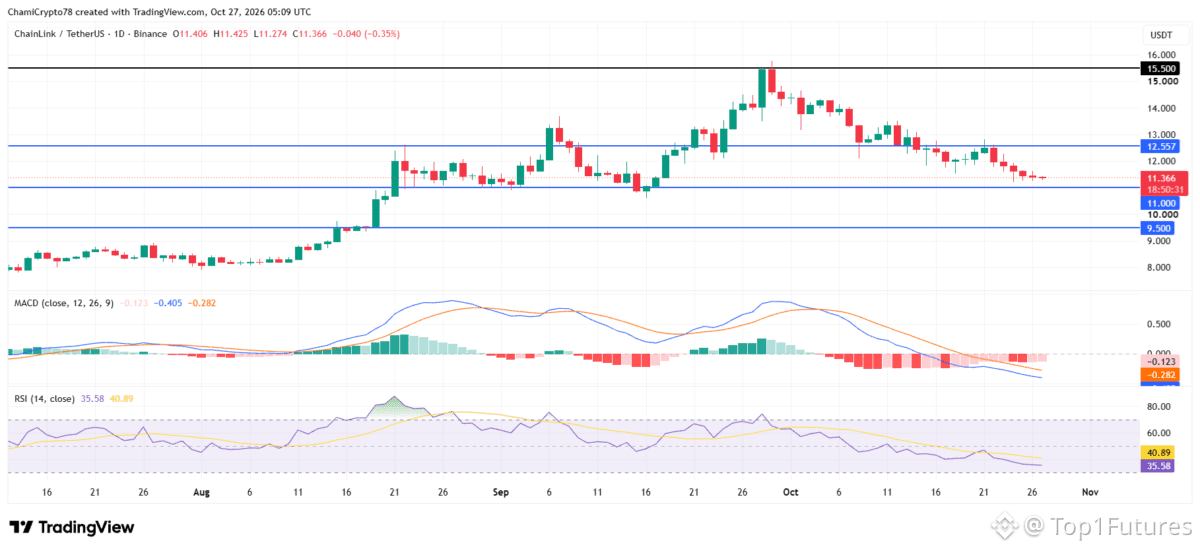
$LINK Nears $11 as bearish indicators deepen🔻📉
On the daily timeframe chart,Chainlink daily highlighted an extended retreat from its late-September peak around the $15.50 region, with sellers maintaining control. The token traded around $11.366 at press time, leaving the $11 support level within reach.
A continued price correction could expose the $9.50 level, where the structure identified another significant support area.
The RSI indicator fell to 35.58, below its moving average, highlighting weak buying strength, even though LINK was yet to enter the traditional oversold zone.
Further validating bearish conditions, the MACD line reached −0.405, below its signal line at −0.282. Nevertheless, defending $11 could encourage buyers to challenge $12.557, the nearest significant resistance.
1
83
·
--
Падение
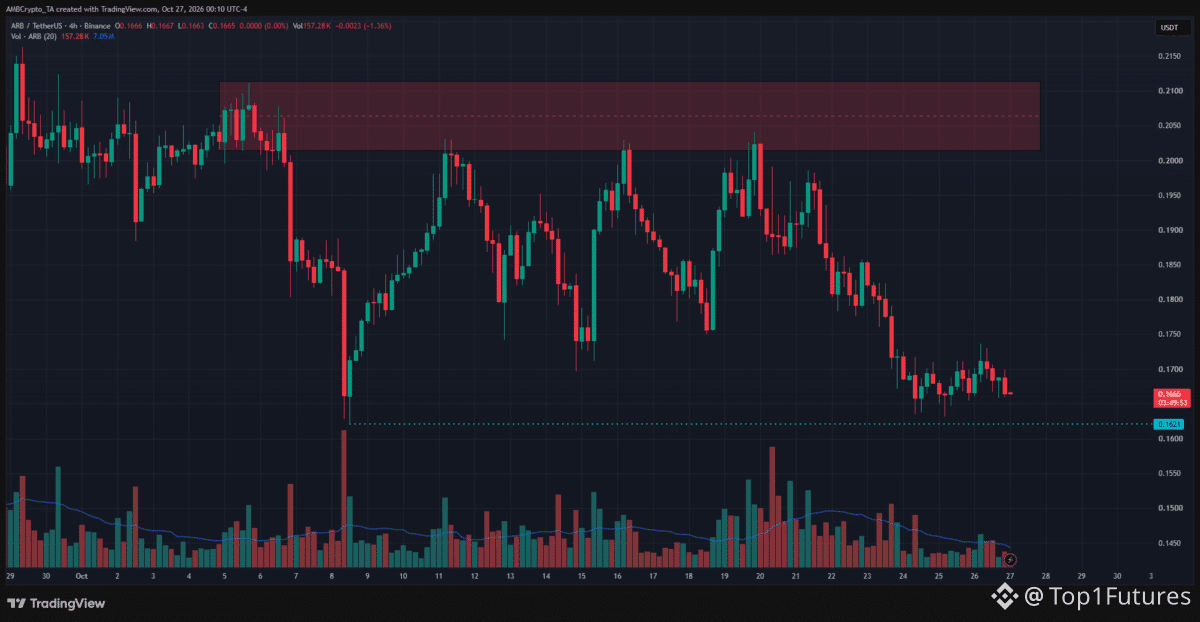
$ARB 🔻 is down nearly 17% in a week, but could this correction create a fresh buying opportunity?
#Arbitrum has pulled back sharply after its September rally from $0.131 to $0.255. For now, sellers are dominating the short-term action, but the bigger picture could still offer bulls some hope if key support survives.
The level I'm watching closely is $0.162. This zone could be crucial for ARB's next move. 📉
If buyers defend this support and push the price back above $0.17, we could see a recovery toward $0.174 first. If bullish momentum builds, the next targets could be $0.205, $0.212 and even $0.218.
But don't rush into a trade just yet!
Capital outflows and selling pressure are still creating problems for buyers. If ARB loses $0.162 without a strong rebound, the correction could extend further, and bulls may have to wait longer for a proper recovery.
Watch how price reacts around $0.162. A reclaim of $0.17 could provide an early bullish signal, while a clean breakdown below support would keep the downside risk alive.
The next move depends on buyers showing real strength. Will ARB bounce back or slide lower? 👀
1
401
·
--
Падение
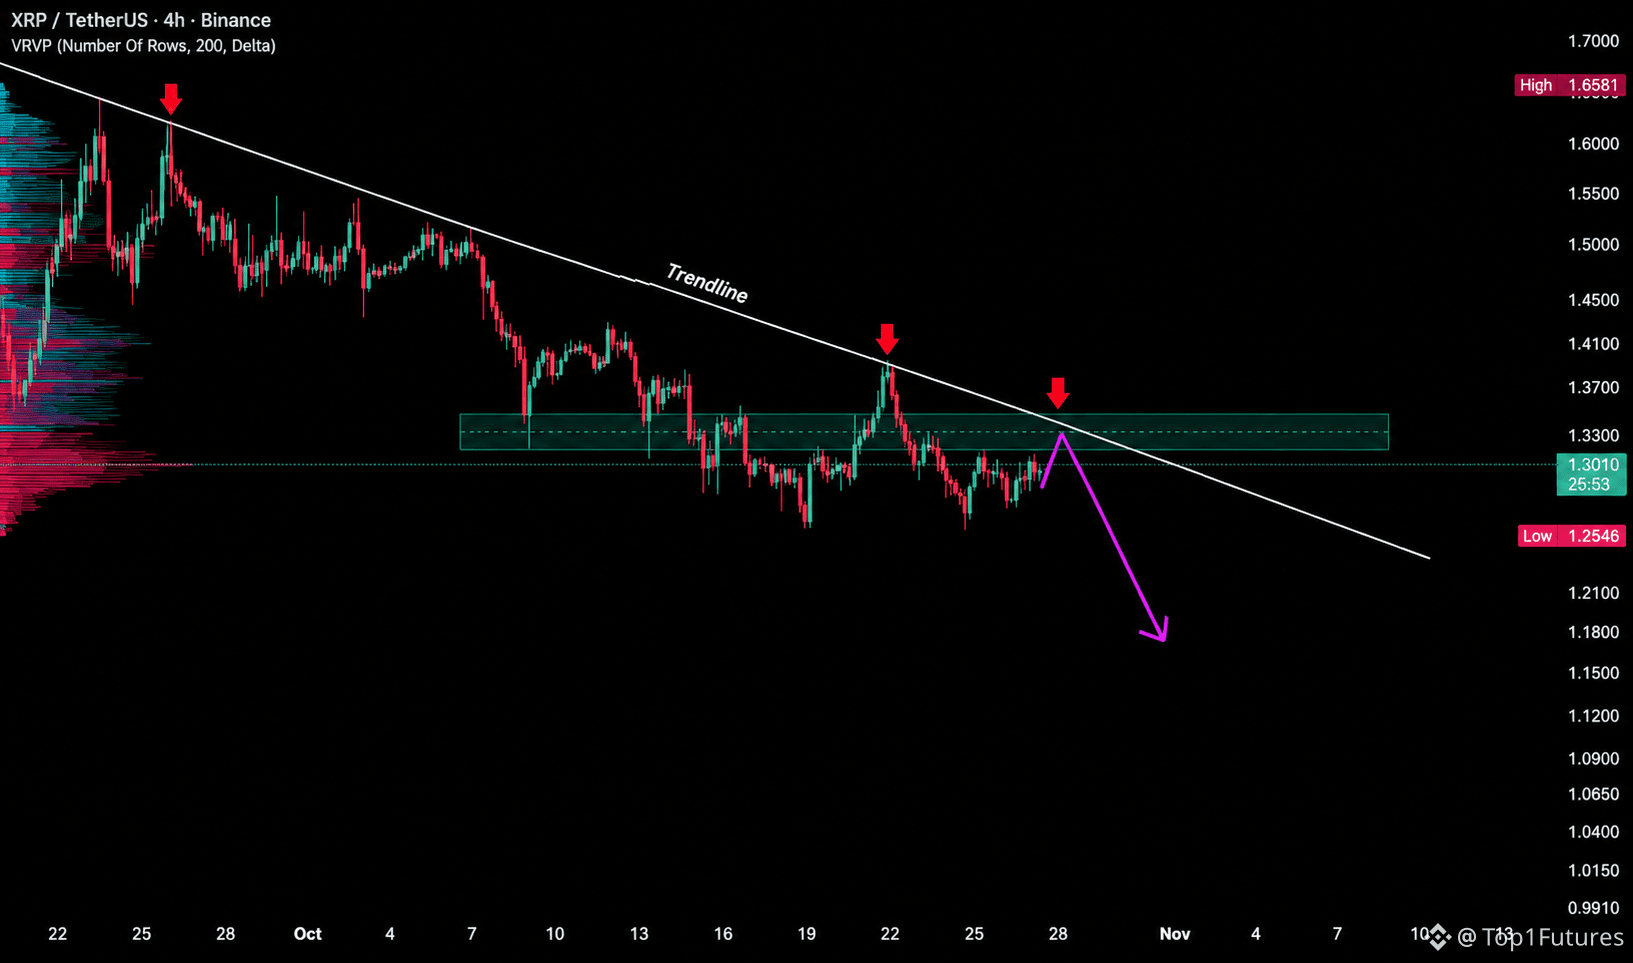
$XRP Still struggling to move up, and sellers are not giving bulls much space to recover ‼️👀
On the 4H chart, XRP is trading near $1.30, while the descending trendline continues putting pressure on every recovery attempt. Since getting rejected around $1.65, the price has been making weaker moves upward, and the overall trend still looks bearish. 📉
Now, keep an eye on the $1.32–$1.35 zone. This area could become a difficult challenge for buyers because trendline resistance and horizontal resistance are meeting there.
If XRP climbs into this zone but fails to break above it, sellers may take control again. In that case, price could move back toward $1.25. If that support breaks with strong selling pressure, we might see another drop toward $1.18–$1.16. ⚠️
Personally, I wouldn't rush to sell around $1.30. Waiting for a bounce and watching how price reacts near resistance could offer a better opportunity.
But what if buyers finally break above $1.35 and hold it? 🤔 That could weaken the bearish setup and open the door for a stronger recovery.
🎯 Watch the reaction, not just the price. Patience matters here!
1
102
·
--
Рост
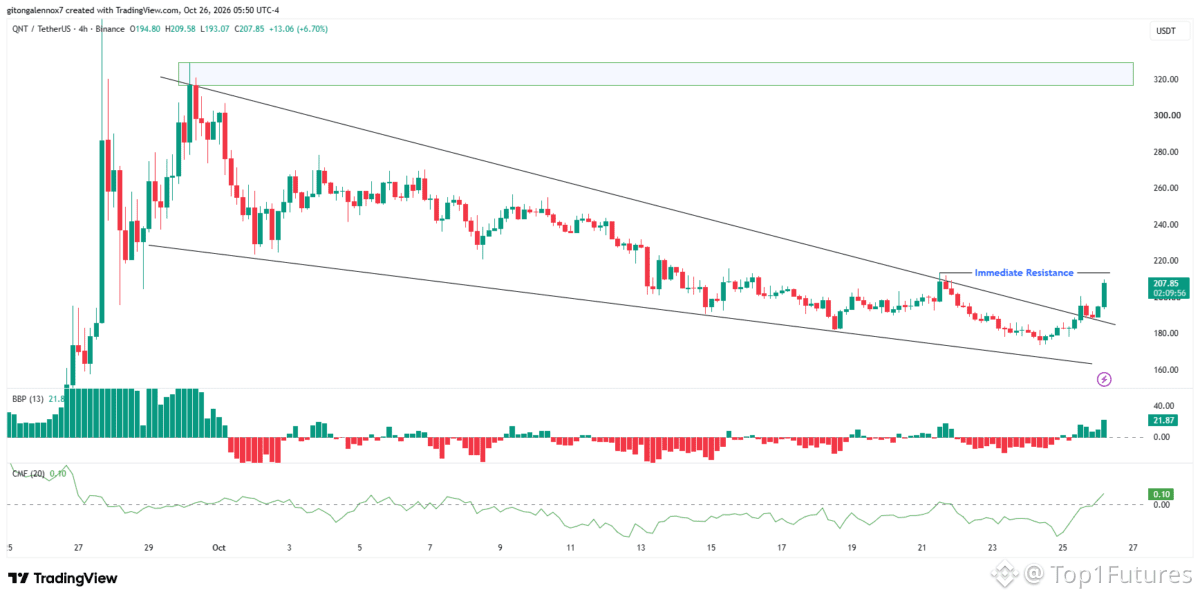
$QNT 🔥 JUST EXPLODED 16%! IS $250 THE NEXT STOP FOR QUANT📈‼️
Can #QNT hold above $200, or are we about to see another pullback?
Quant is making serious noise in the crypto market! A 16%+ rally in just 24 hours has pushed it into the spotlight, and renewed interest in real-world assets (RWA) could be adding fuel to this move.
🔥 WHAT’S DRIVING THE HYPE?
Quant is gaining attention following developments around tokenized bank deposits and blockchain-based financial infrastructure. The network is also expanding its technology with its Layer 2.5 initiative.
Trading volume reportedly surged above $112M, while daily transfers climbed over 22% to 5,640. That’s a notable increase in market activity, although it doesn’t guarantee the rally will continue.
The technical picture is improving too! QNT has broken above a falling wedge, successfully retested $188, and its momentum indicators are turning positive.
If QNT holds above $200 and breaks through $220 with strong volume, bulls could push toward $250 next. A sustained breakout may open the door to higher targets.
But if $200 fails, don't blindly chase the pump. A deeper retracement could follow.
#Quant
#Altcoins
1
319
Войдите, чтобы посмотреть больше материала
Присоединяйтесь к пользователям криптовалют по всему миру на Binance Square
⚡️ Получайте новейшую и полезную информацию о криптоактивах.
💬 Нам доверяет крупнейшая в мире криптобиржа.
👍 Получите достоверные аналитические данные от верифицированных создателей контента.
Эл. почта/номер телефона
В тренде
CanMicrosoftDeliverOnAI
Просмотров: 241,201
1,958 обсуждают
Earnings Season Session 3: Will Google & Microsoft Beat Earnings Expectations?
Binance Square Official
·Лайков: 112
·Просмотров: 43.1k
CanGoogleDefindItsCore
Просмотров: 139,156
1,431 обсуждают
EarningsSeason
Просмотров: 5.8M
27,942 обсуждают