
World Of Crypto
344 Публикации

World Of Crypto
Отправить жалобу
Заблокировать пользователя
Открытая сделка
Трейдер с регулярными сделками
2.3 г
5 подписок(и/а)
16 подписчиков(а)
100 понравилось
Посты
Портфель
Все
Цитирования
$IDOL is showing strong bullish momentum, trading around $0.0208–$0.0215, with approximately 17–20% gains over the last 24 hours. Trading activity remains elevated, while the 4H RSI is around 56, indicating positive momentum without an extremely overbought reading. Immediate resistance is near $0.0223, while support is around $0.0200–$0.0207. A sustained move above resistance could strengthen bullish momentum, whereas rejection may lead to a short-term correction. Overall, the market structure remains bullish, but volatility is high.
{future}(IDOLUSDT)
#BinanceReopensWithdrawalsForMoreAssets
$IDOL is showing strong bullish momentum, trading around $0.0208–$0.0215, with approximately 17–20% gains over the last 24 hours. Trading activity remains elevated, while the 4H RSI is around 56, indicating positive momentum without an extremely overbought reading. Immediate resistance is near $0.0223, while support is around $0.0200–$0.0207. A sustained move above resistance could strengthen bullish momentum, whereas rejection may lead to a short-term correction. Overall, the market structure remains bullish, but volatility is high.
#BinanceReopensWithdrawalsForMoreAssets
#BinanceReopensWithdrawalsForMoreAssets
421
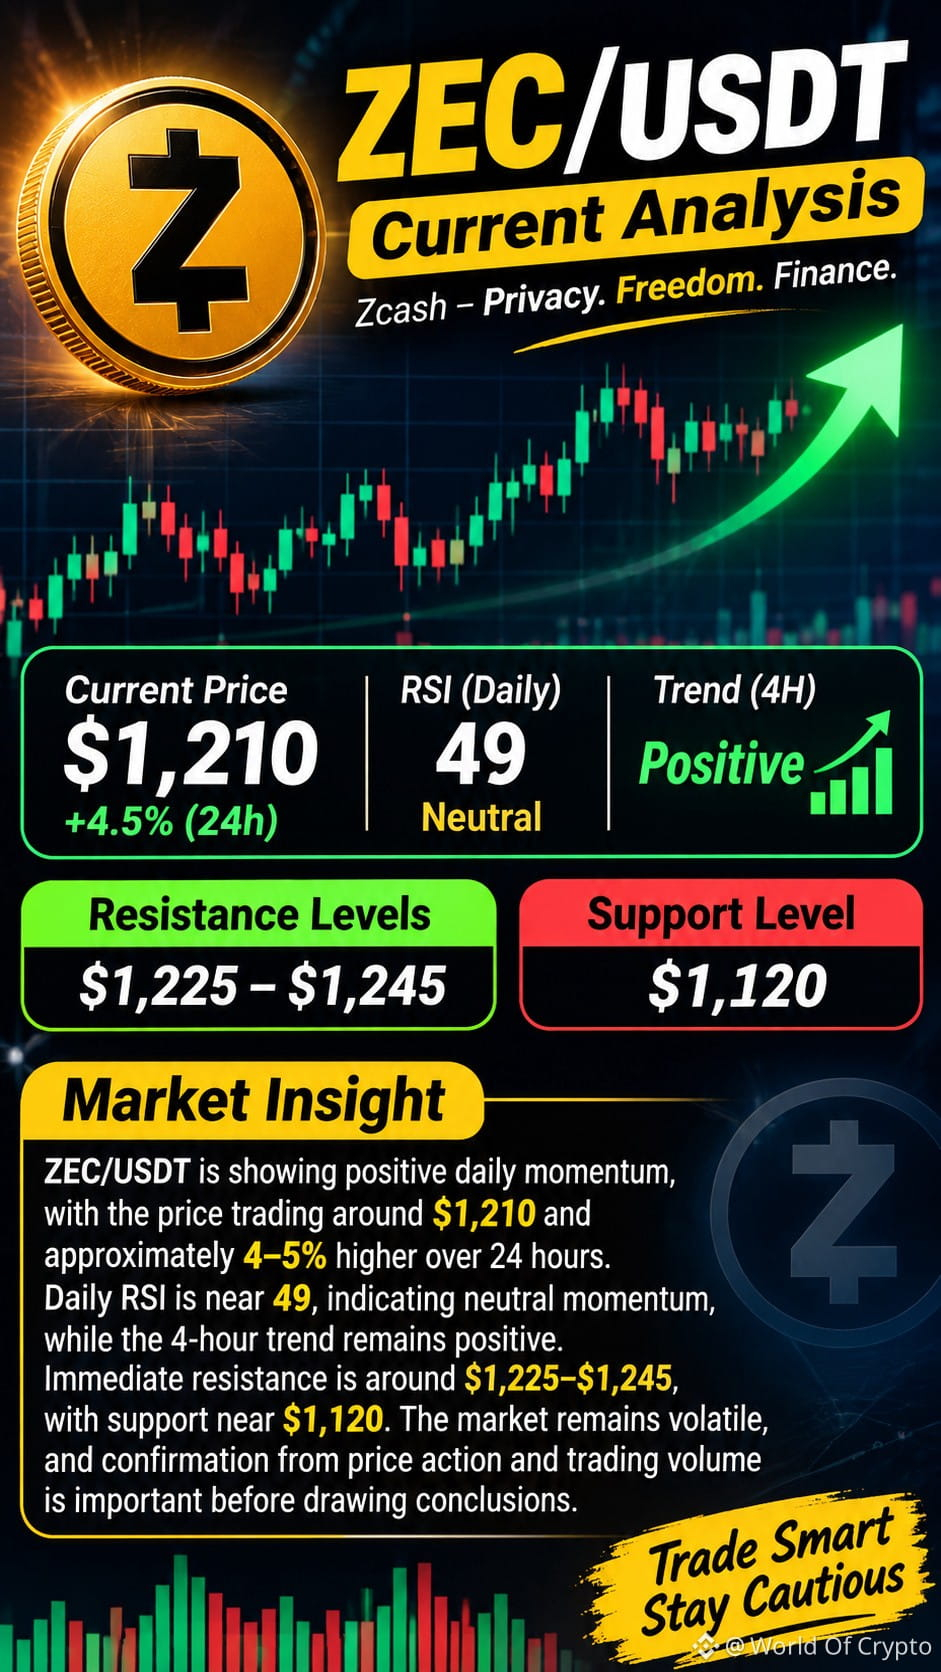
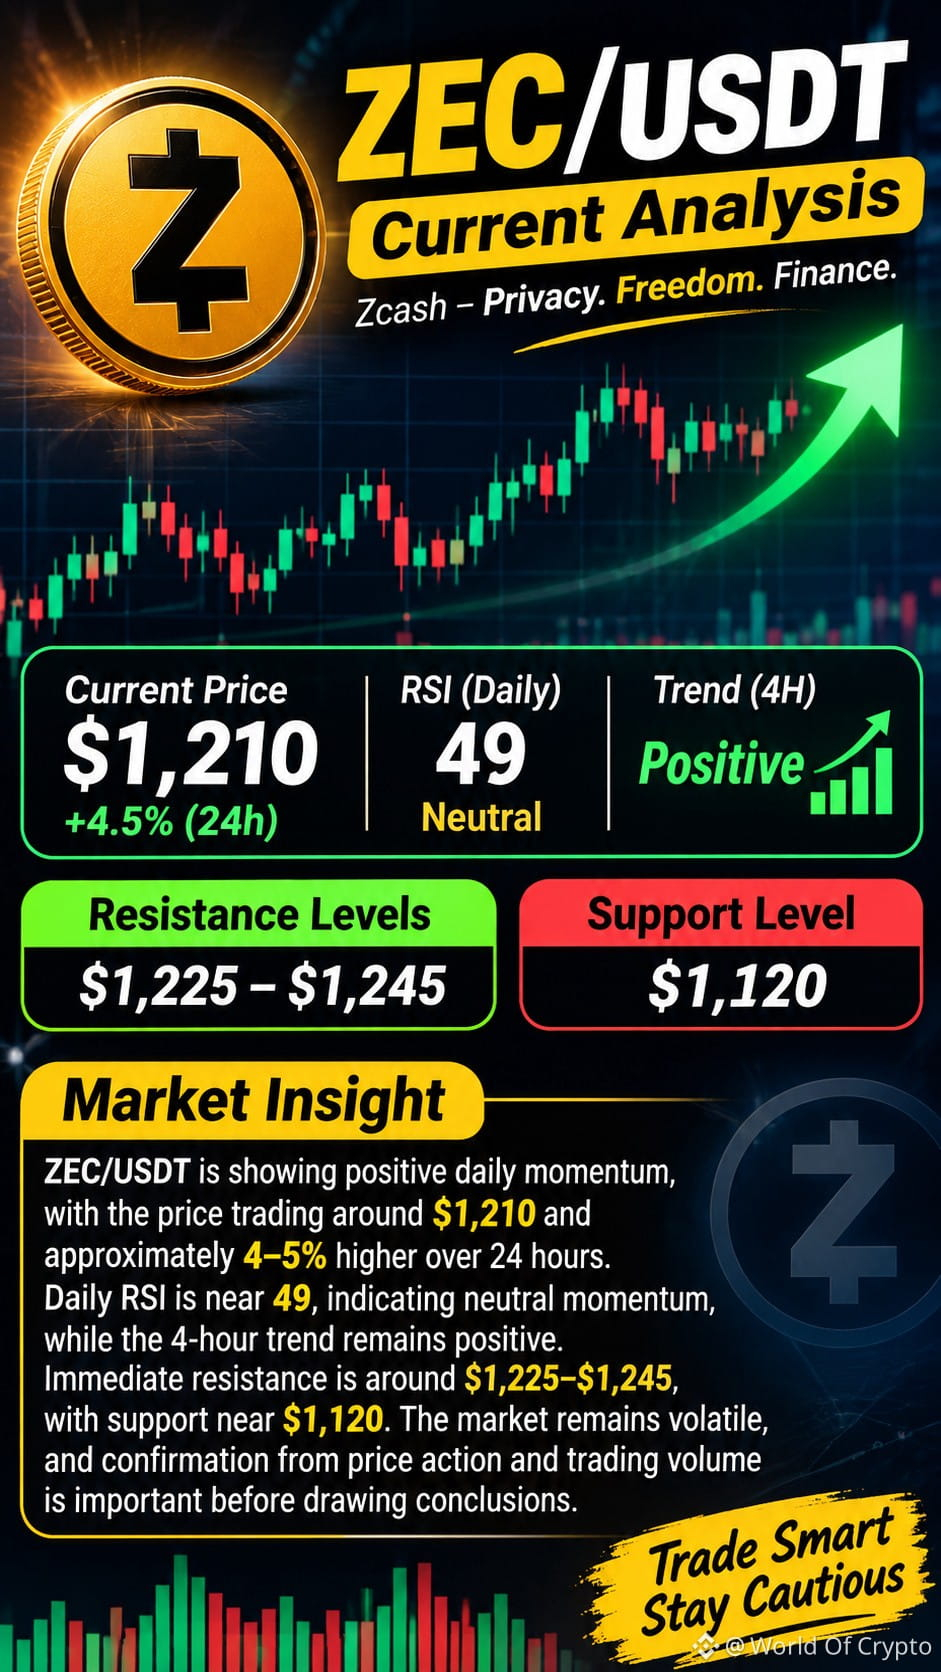
$ZEC /USDT is showing positive daily momentum, with the price trading around $1,210 and approximately 4–5% higher over 24 hours. Daily RSI is near 49, indicating neutral momentum, while the 4-hour trend remains positive. Immediate resistance is around $1,225–$1,245, with support near $1,120. The market remains volatile, and confirmation from price action and trading volume is important before drawing conclusions.
{spot}(ZECUSDT)
#USOctoberNFP-AreRateCutsStillPossible
$ZEC /USDT is showing positive daily momentum, with the price trading around $1,210 and approximately 4–5% higher over 24 hours. Daily RSI is near 49, indicating neutral momentum, while the 4-hour trend remains positive. Immediate resistance is around $1,225–$1,245, with support near $1,120. The market remains volatile, and confirmation from price action and trading volume is important before drawing conclusions.
#USOctoberNFP-AreRateCutsStillPossible
#USOctoberNFP-AreRateCutsStillPossible
193
SOLANA ($SOL ) — Is a Recovery Coming, or Is More Pressure Ahead?
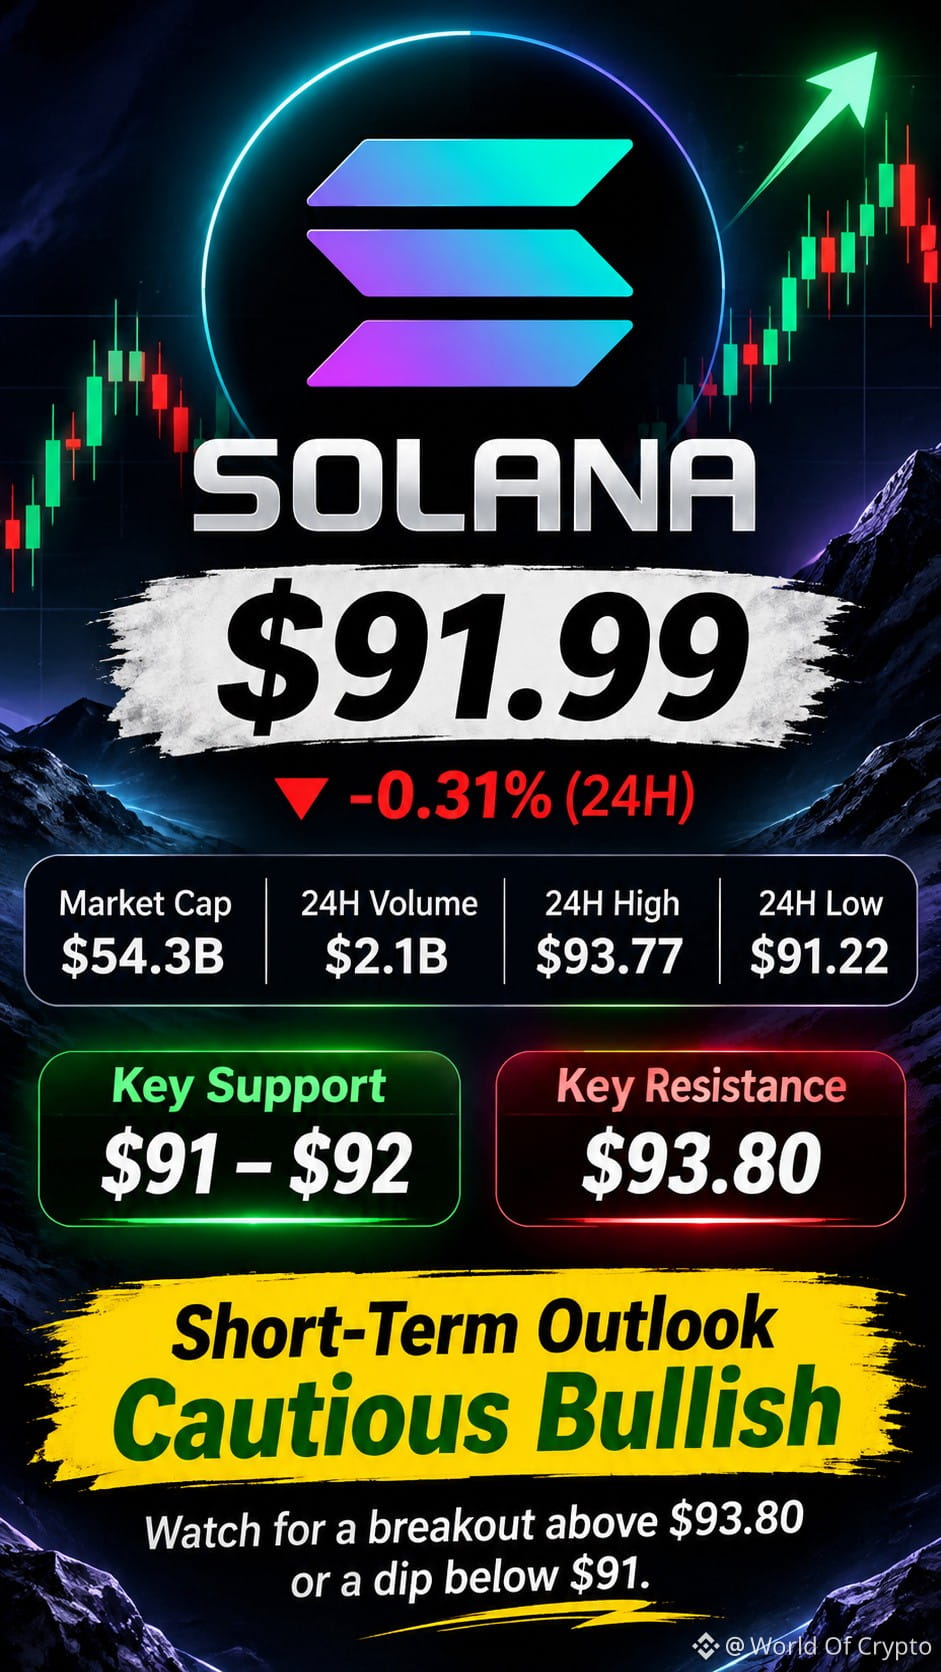
Solana is currently trading around $91.99, showing a slight 24-hour decline of 0.31%. After a difficult weekly performance, SOL is approaching an important price area where market participants are watching for signs of stabilization. The $91–$92 zone is an important near-term area to monitor, while $93.80 is the immediate resistance to watch. A strong move above this resistance with increasing volume could improve short-term momentum, whereas a breakdown below the recent low could indicate continued weakness. For now, the market needs confirmation before a bullish reversal can be established.
What do you think? Can SOL reclaim $100, or will sellers remain in control?
{spot}(SOLUSDT)
#Solana
SOLANA ($SOL ) — Is a Recovery Coming, or Is More Pressure Ahead?
Solana is currently trading around $91.99, showing a slight 24-hour decline of 0.31%. After a difficult weekly performance, SOL is approaching an important price area where market participants are watching for signs of stabilization. The $91–$92 zone is an important near-term area to monitor, while $93.80 is the immediate resistance to watch. A strong move above this resistance with increasing volume could improve short-term momentum, whereas a breakdown below the recent low could indicate continued weakness. For now, the market needs confirmation before a bullish reversal can be established.
What do you think? Can SOL reclaim $100, or will sellers remain in control?
#Solana
Solana is currently trading around $91.99, showing a slight 24-hour decline of 0.31%. After a difficult weekly performance, SOL is approaching an important price area where market participants are watching for signs of stabilization. The $91–$92 zone is an important near-term area to monitor, while $93.80 is the immediate resistance to watch. A strong move above this resistance with increasing volume could improve short-term momentum, whereas a breakdown below the recent low could indicate continued weakness. For now, the market needs confirmation before a bullish reversal can be established.
What do you think? Can SOL reclaim $100, or will sellers remain in control?
#Solana
126
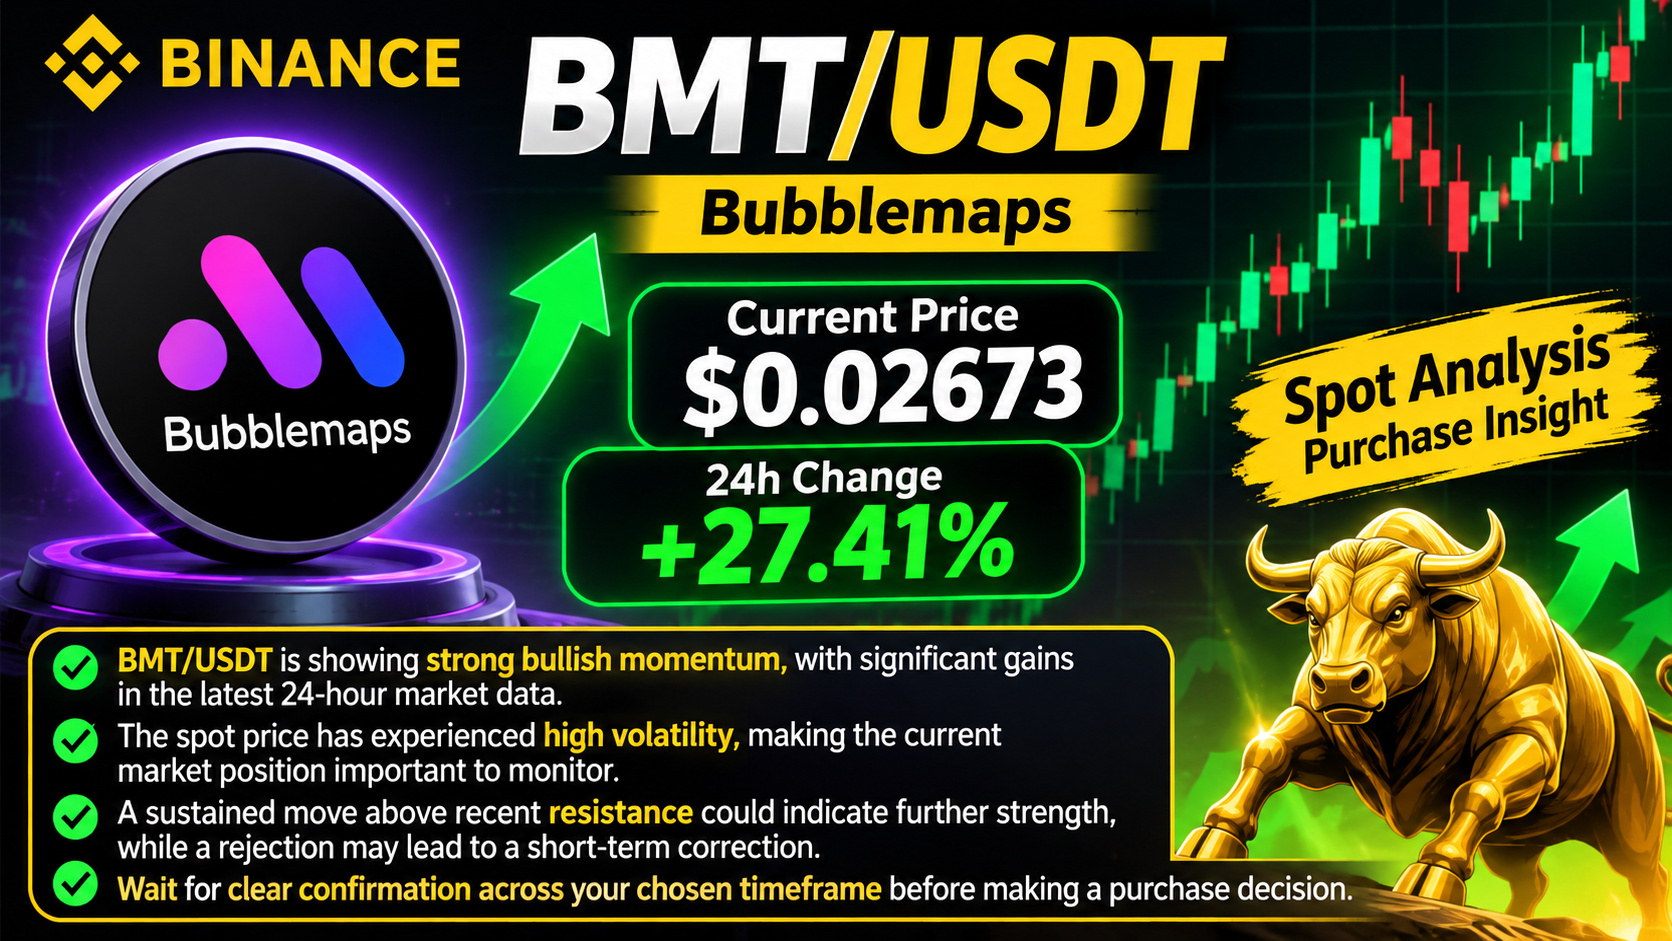
$BMT /USDT is showing strong bullish momentum, with significant gains in the latest 24-hour market data.
The spot price has experienced high volatility, making the current market position important to monitor.
A sustained move above recent resistance could indicate further strength, while a rejection may lead to a short-term correction.
Wait for clear confirmation across your chosen timeframe before making any purchase decision.
{spot}(BMTUSDT)
#BinanceReopensWithdrawalsForMoreAssets
$BMT /USDT is showing strong bullish momentum, with significant gains in the latest 24-hour market data.
The spot price has experienced high volatility, making the current market position important to monitor.
A sustained move above recent resistance could indicate further strength, while a rejection may lead to a short-term correction.
Wait for clear confirmation across your chosen timeframe before making any purchase decision.
#BinanceReopensWithdrawalsForMoreAssets
The spot price has experienced high volatility, making the current market position important to monitor.
A sustained move above recent resistance could indicate further strength, while a rejection may lead to a short-term correction.
Wait for clear confirmation across your chosen timeframe before making any purchase decision.
#BinanceReopensWithdrawalsForMoreAssets
143
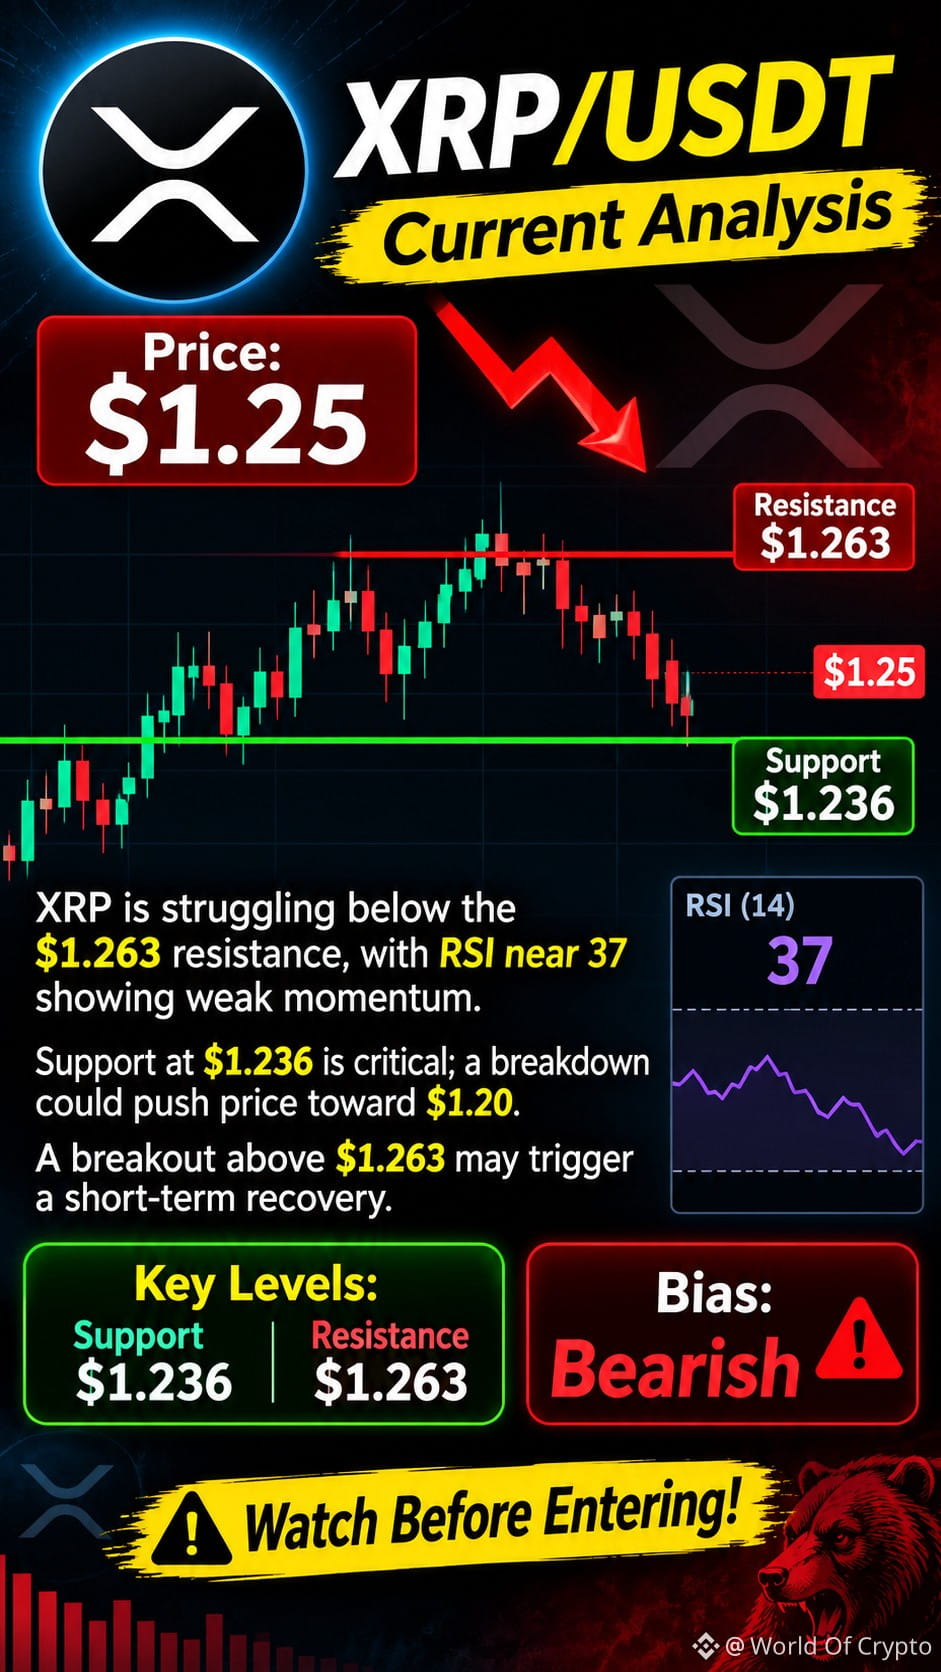
$XRP /USDT – Bearish Pressure Continues
Price: $1.25
XRP is struggling below the $1.263 resistance, with RSI near 37 showing weak momentum. Support at $1.236 is critical; a breakdown could push price toward $1.20. A breakout above $1.263 may trigger a short-term recovery. Watch the reaction before entering.
Key Levels: Support $1.236 | Resistance $1.263
Bias: Bearish ⚠️
{spot}(XRPUSDT)
#Xrp🔥🔥
$XRP /USDT – Bearish Pressure Continues
Price: $1.25
XRP is struggling below the $1.263 resistance, with RSI near 37 showing weak momentum. Support at $1.236 is critical; a breakdown could push price toward $1.20. A breakout above $1.263 may trigger a short-term recovery. Watch the reaction before entering.
Key Levels: Support $1.236 | Resistance $1.263
Bias: Bearish ⚠️
#Xrp🔥🔥
Price: $1.25
XRP is struggling below the $1.263 resistance, with RSI near 37 showing weak momentum. Support at $1.236 is critical; a breakdown could push price toward $1.20. A breakout above $1.263 may trigger a short-term recovery. Watch the reaction before entering.
Key Levels: Support $1.236 | Resistance $1.263
Bias: Bearish ⚠️
#Xrp🔥🔥
45
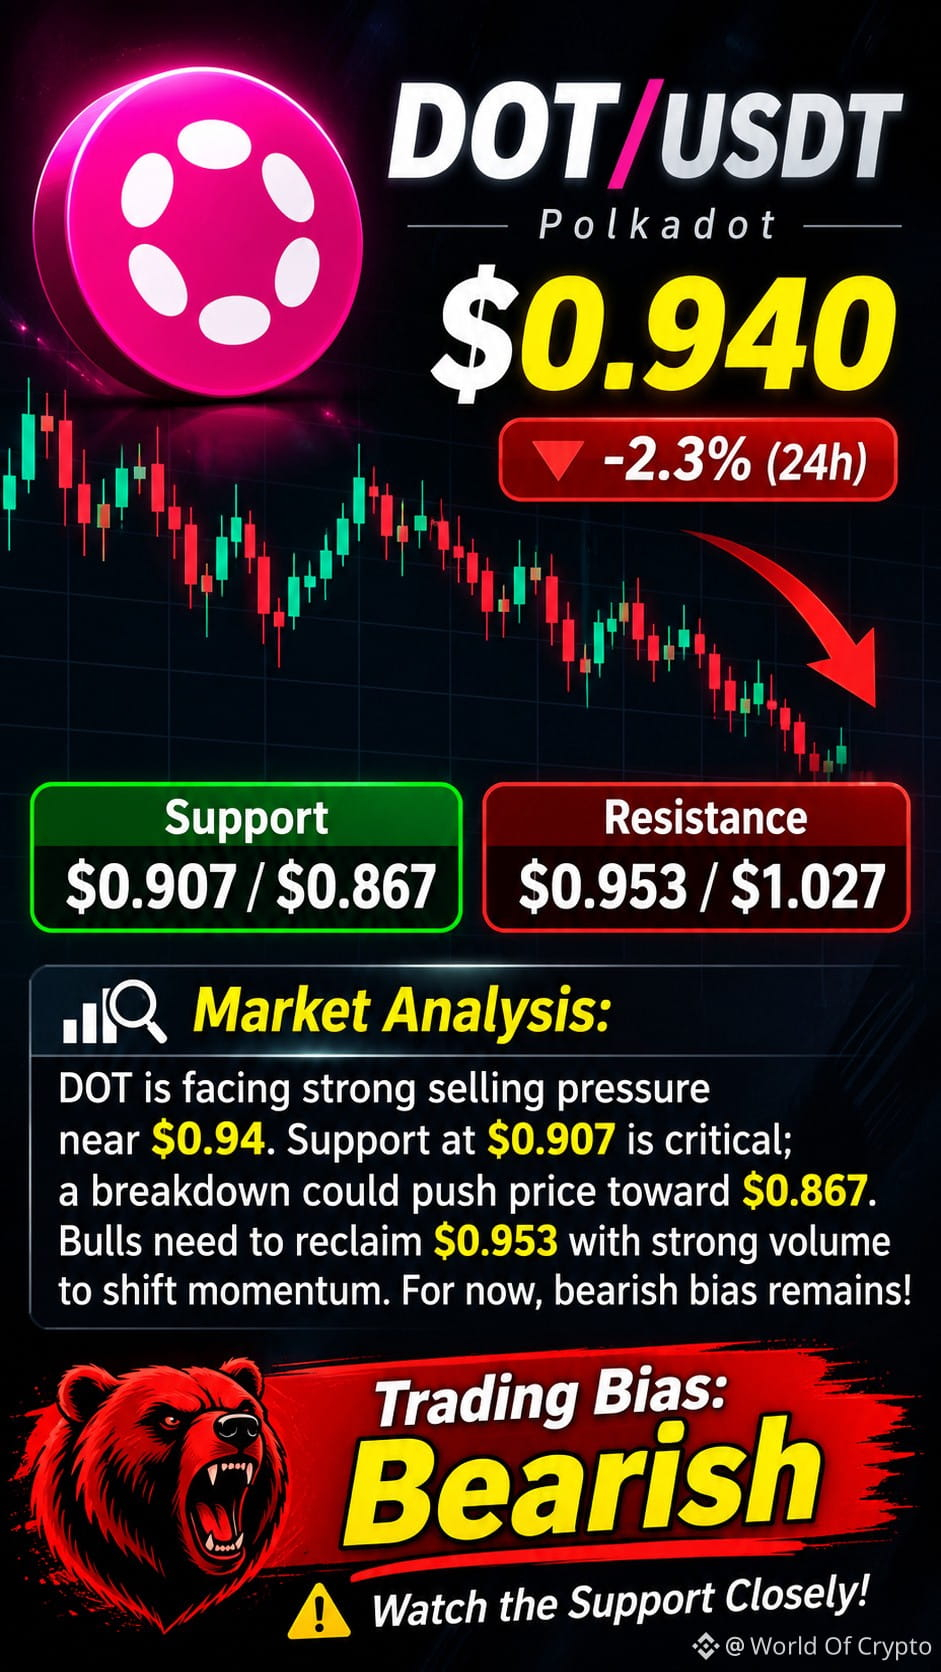
$DOT /USDT – Sellers Still in Control 📉
DOT is facing strong selling pressure near $0.94. Support at $0.907 is critical; a breakdown could push price toward $0.867. Bulls need to reclaim $0.953 with strong volume to shift momentum. For now, bearish bias remains dominant. Watch the support closely!
{spot}(DOTUSDT)
#USMidtermElections
$DOT /USDT – Sellers Still in Control 📉
DOT is facing strong selling pressure near $0.94. Support at $0.907 is critical; a breakdown could push price toward $0.867. Bulls need to reclaim $0.953 with strong volume to shift momentum. For now, bearish bias remains dominant. Watch the support closely!
#USMidtermElections
DOT is facing strong selling pressure near $0.94. Support at $0.907 is critical; a breakdown could push price toward $0.867. Bulls need to reclaim $0.953 with strong volume to shift momentum. For now, bearish bias remains dominant. Watch the support closely!
#USMidtermElections
2
596
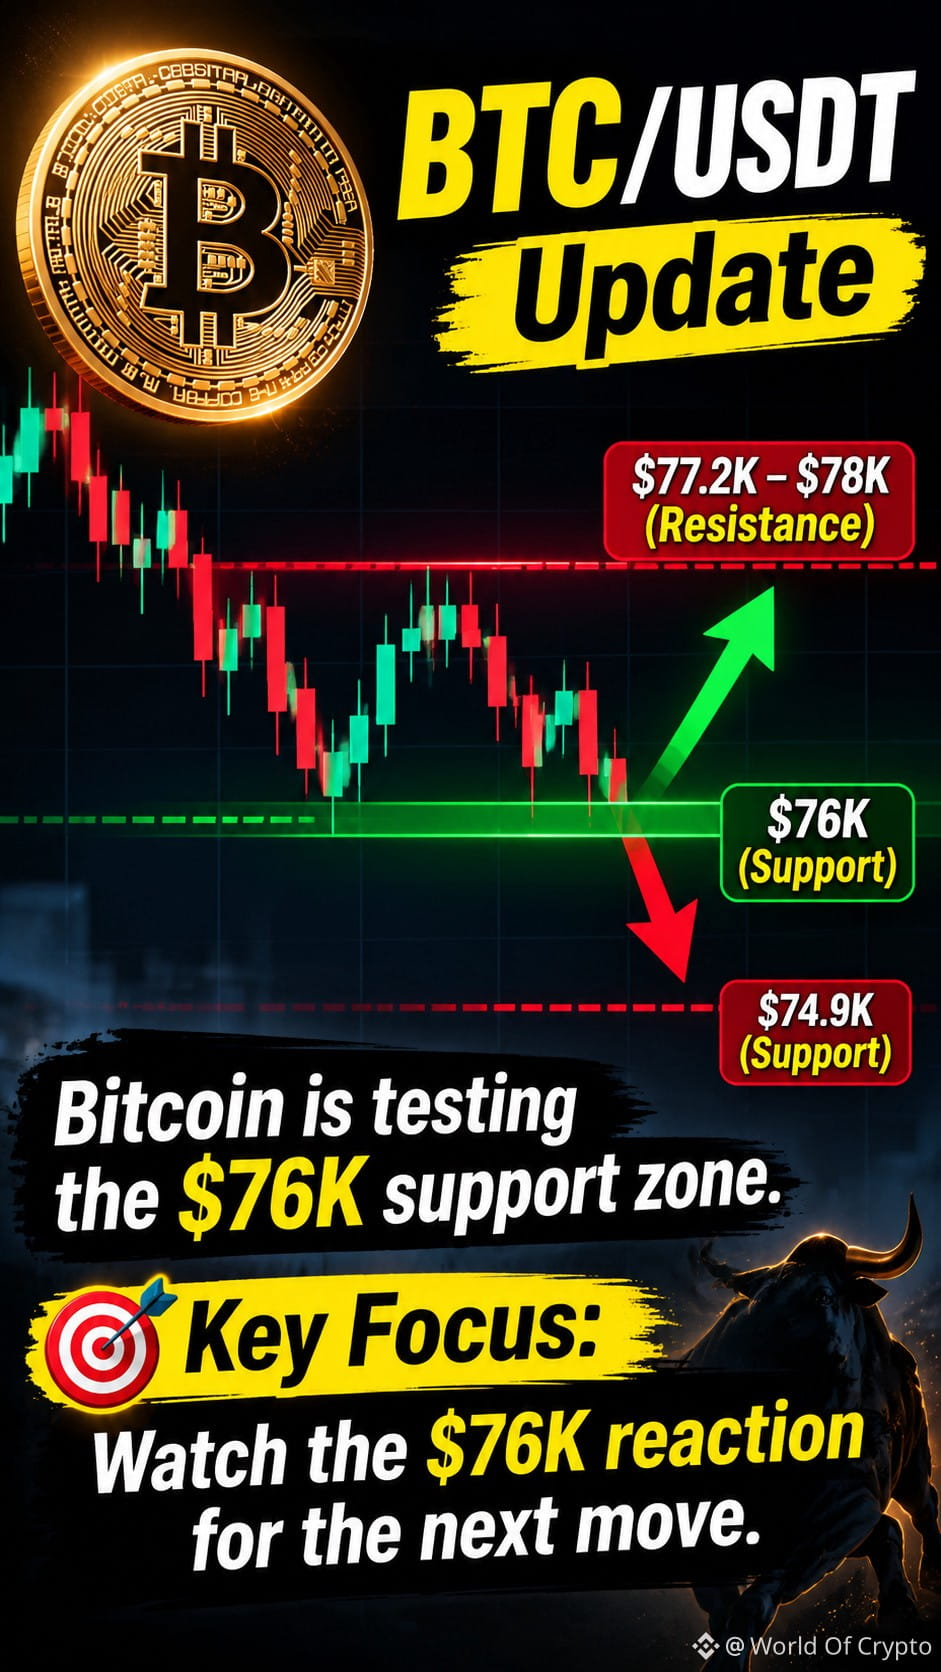
$BTC /USDT Update
Bitcoin is testing the $76K support zone. Holding this level could trigger a bounce toward $77.2K–$78K, while a breakdown may push BTC toward $74.9K.
Key Focus: Watch the $76K reaction for the next move.
#Verify1to1BinanceReserves
{spot}(BTCUSDT)
$BTC /USDT Update
Bitcoin is testing the $76K support zone. Holding this level could trigger a bounce toward $77.2K–$78K, while a breakdown may push BTC toward $74.9K.
Key Focus: Watch the $76K reaction for the next move.
#Verify1to1BinanceReserves
Bitcoin is testing the $76K support zone. Holding this level could trigger a bounce toward $77.2K–$78K, while a breakdown may push BTC toward $74.9K.
Key Focus: Watch the $76K reaction for the next move.
#Verify1to1BinanceReserves
86
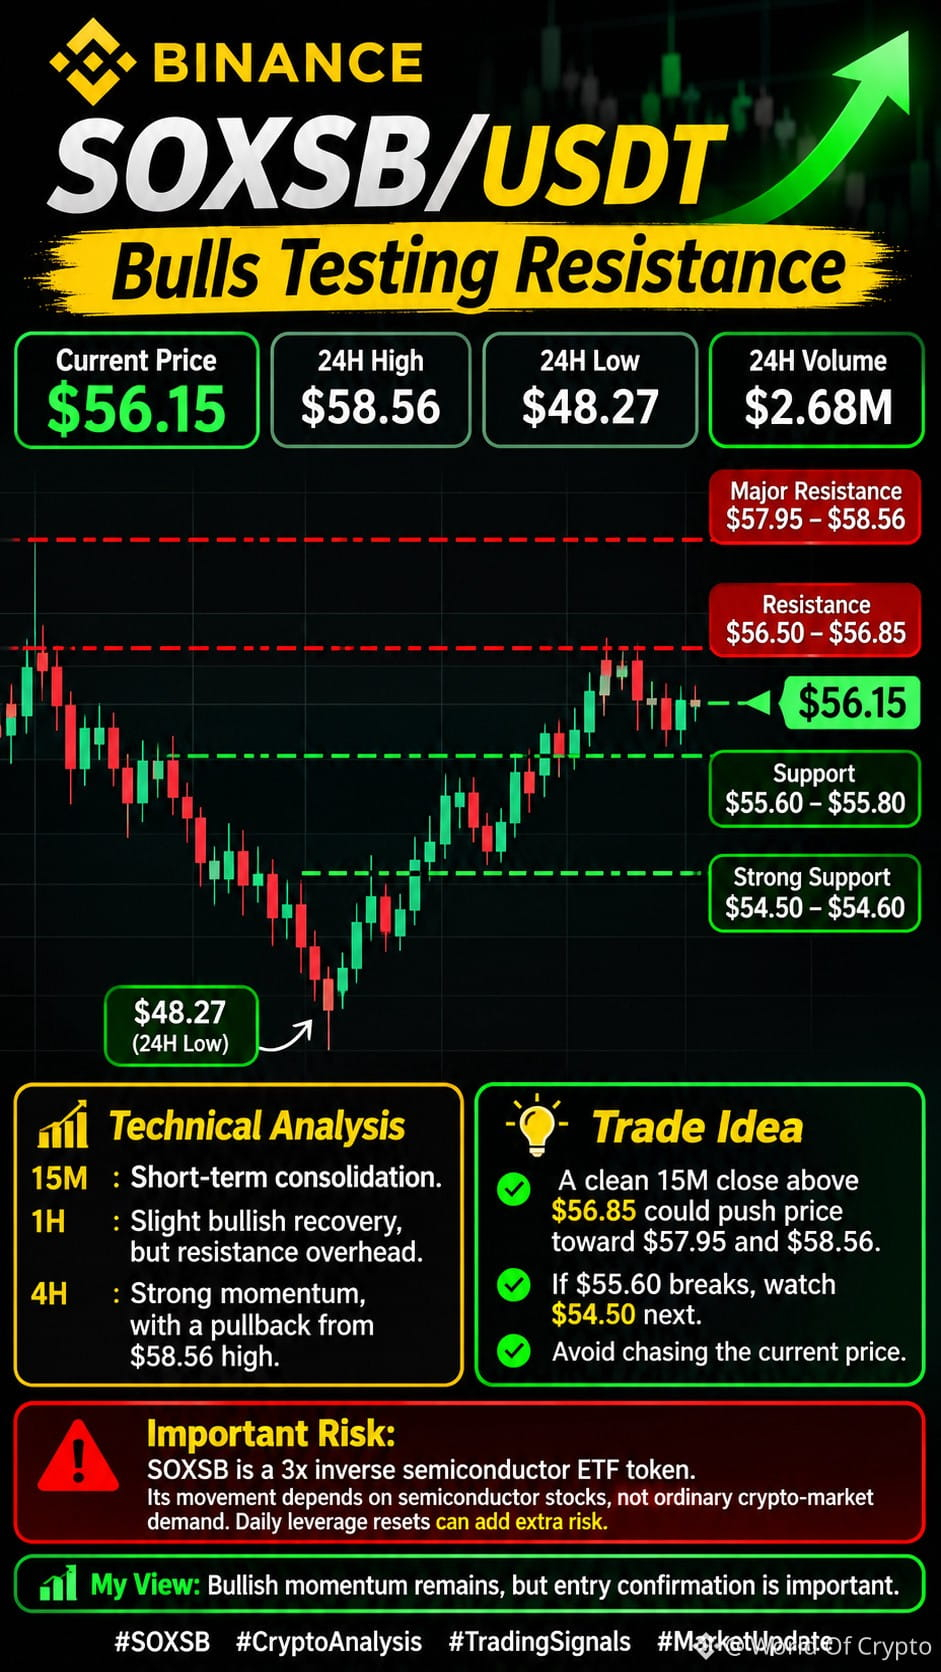
$SOXSB /USDT – Bulls Testing Resistance
SOXSB is showing strong momentum after bouncing from the $48.27 low. Price is currently around $56.15, with buyers testing the $56.50–$56.85 resistance zone. A breakout could push price toward $57.95–$58.56
{spot}(SOXSBUSDT)
#USMidtermElections
$SOXSB /USDT – Bulls Testing Resistance
SOXSB is showing strong momentum after bouncing from the $48.27 low. Price is currently around $56.15, with buyers testing the $56.50–$56.85 resistance zone. A breakout could push price toward $57.95–$58.56
#USMidtermElections
SOXSB is showing strong momentum after bouncing from the $48.27 low. Price is currently around $56.15, with buyers testing the $56.50–$56.85 resistance zone. A breakout could push price toward $57.95–$58.56
#USMidtermElections
90
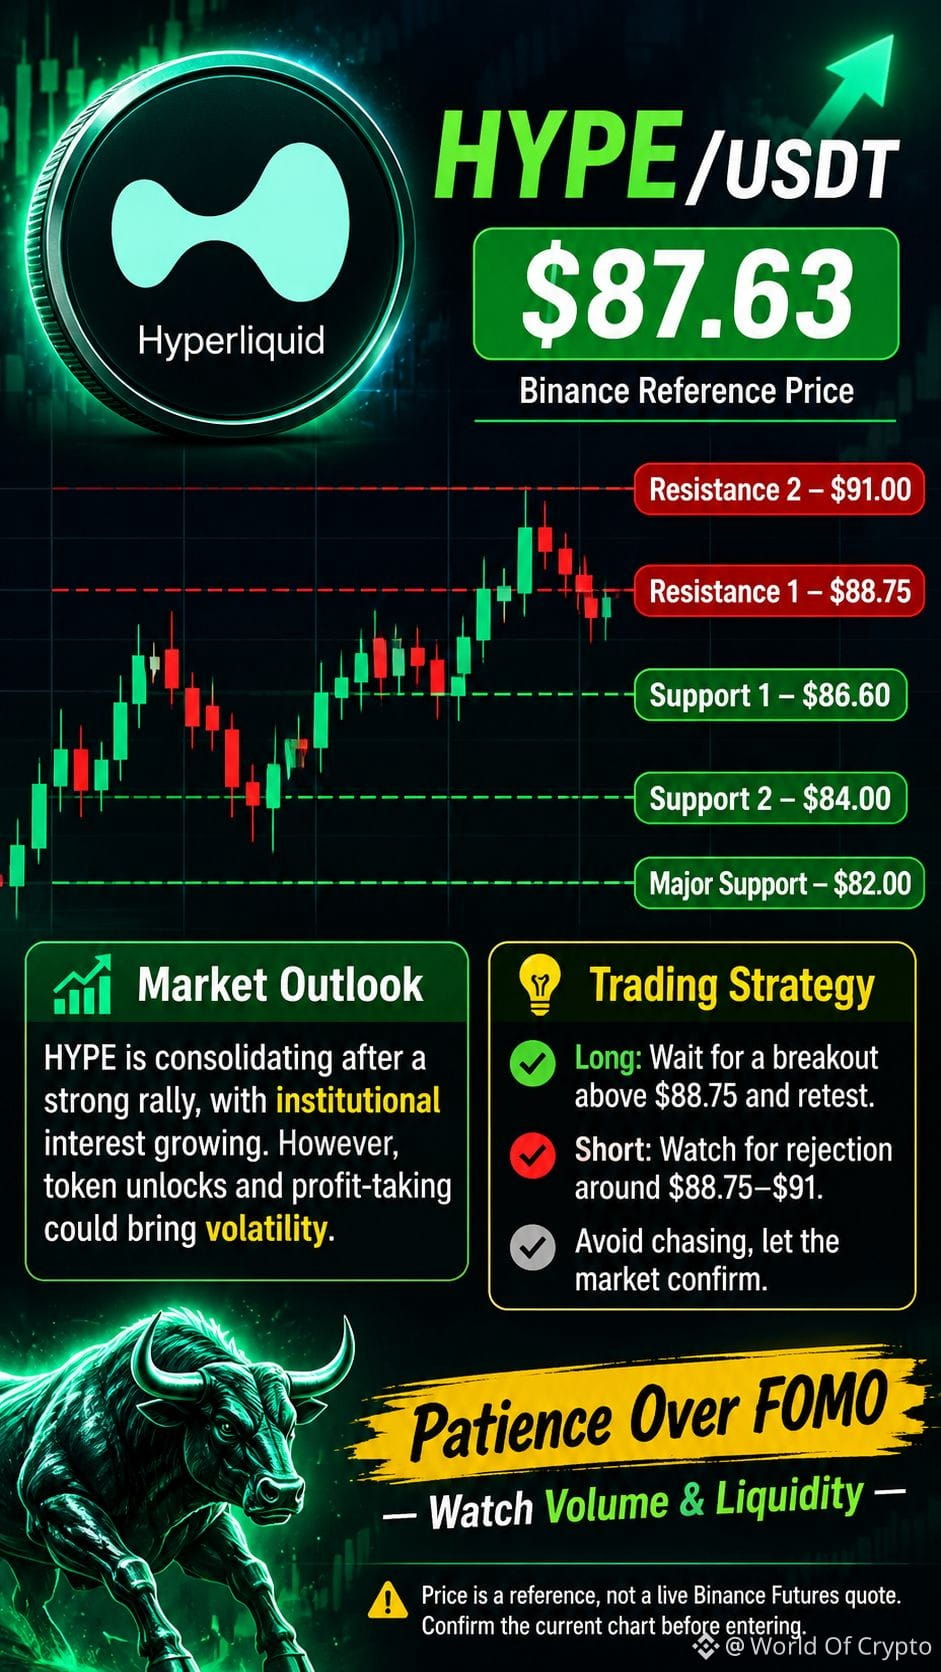
$HYPE /USDT is approaching a critical resistance zone where the next major move could unfold. A breakout above $88.75 with strong volume may trigger bullish momentum toward $91–$98, while rejection could bring a retest of $86.60 and $84 support. Watch volume and liquidity closely before entering. Patience over FOMO — let the market confirm its direction.
{spot}(HYPEUSDT)
#BrazilVirtualAssetLicenseDeadlineDrawsAbout40Firms
$HYPE /USDT is approaching a critical resistance zone where the next major move could unfold. A breakout above $88.75 with strong volume may trigger bullish momentum toward $91–$98, while rejection could bring a retest of $86.60 and $84 support. Watch volume and liquidity closely before entering. Patience over FOMO — let the market confirm its direction.
#BrazilVirtualAssetLicenseDeadlineDrawsAbout40Firms
#BrazilVirtualAssetLicenseDeadlineDrawsAbout40Firms
155
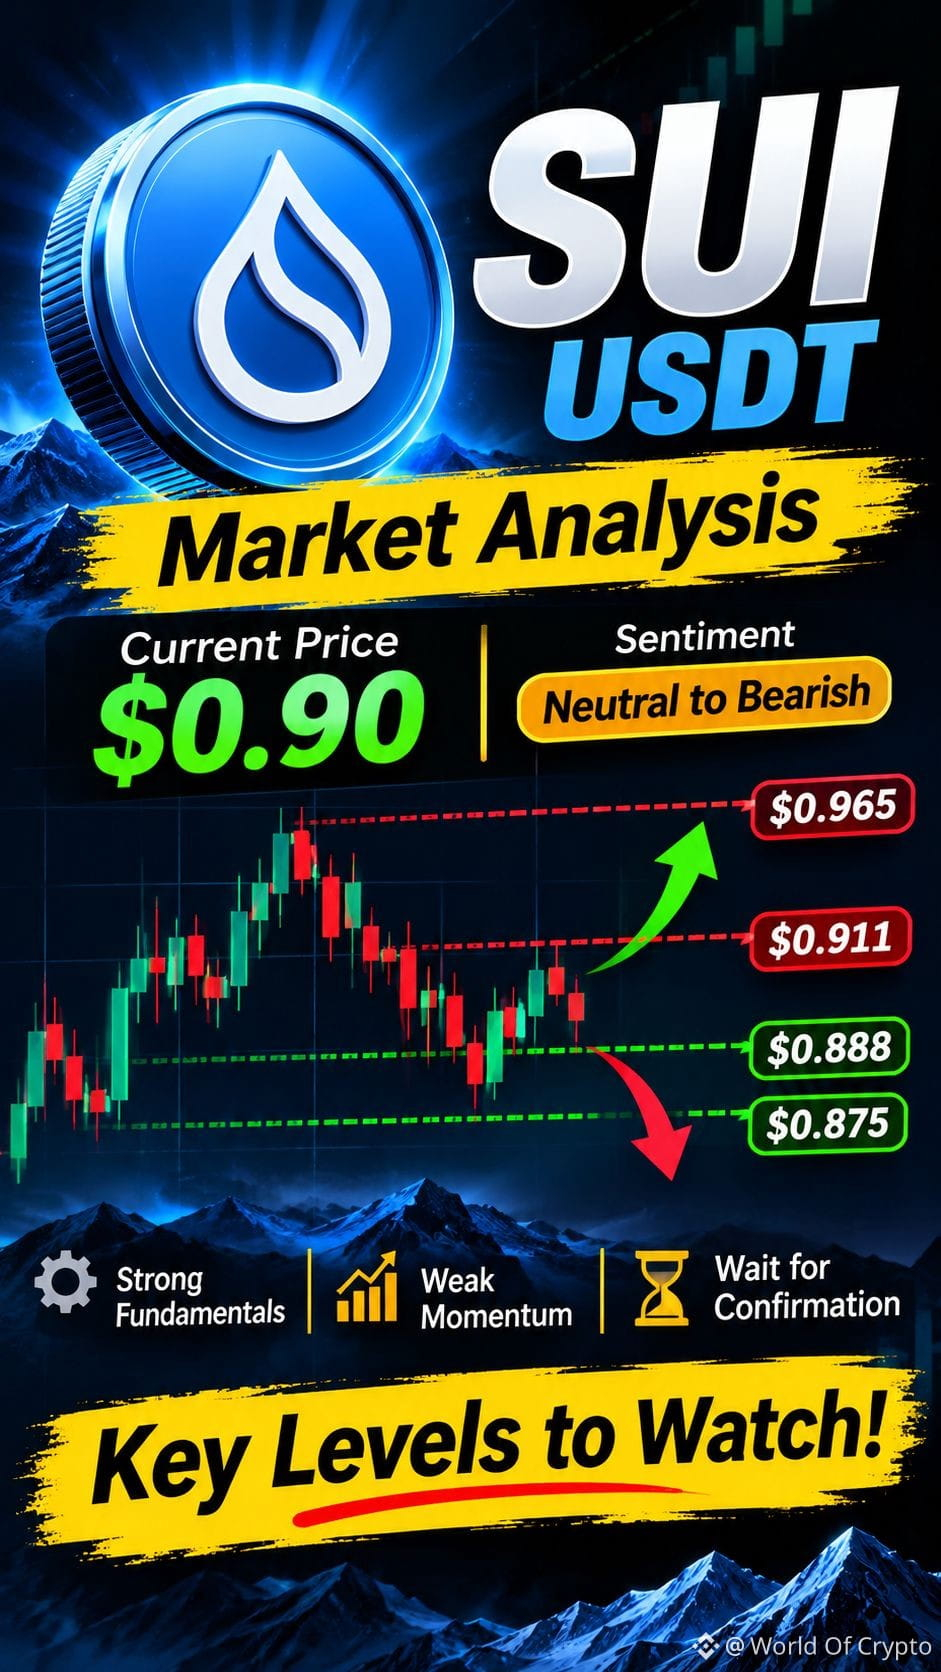
$SUI is at a point where the next move could be interesting. Its Layer-1 technology and growing ecosystem continue to support the long-term story, but the price still needs to prove its strength. Buyers need to defend the $0.888 zone and push above $0.911 to bring bullish momentum back. Until then, patience is more important than chasing a move. The fundamentals look promising, but the chart needs confirmation.
{spot}(SUIUSDT)
#BrazilVirtualAssetLicenseDeadlineDrawsAbout40Firms
$SUI is at a point where the next move could be interesting. Its Layer-1 technology and growing ecosystem continue to support the long-term story, but the price still needs to prove its strength. Buyers need to defend the $0.888 zone and push above $0.911 to bring bullish momentum back. Until then, patience is more important than chasing a move. The fundamentals look promising, but the chart needs confirmation.
#BrazilVirtualAssetLicenseDeadlineDrawsAbout40Firms
#BrazilVirtualAssetLicenseDeadlineDrawsAbout40Firms
187
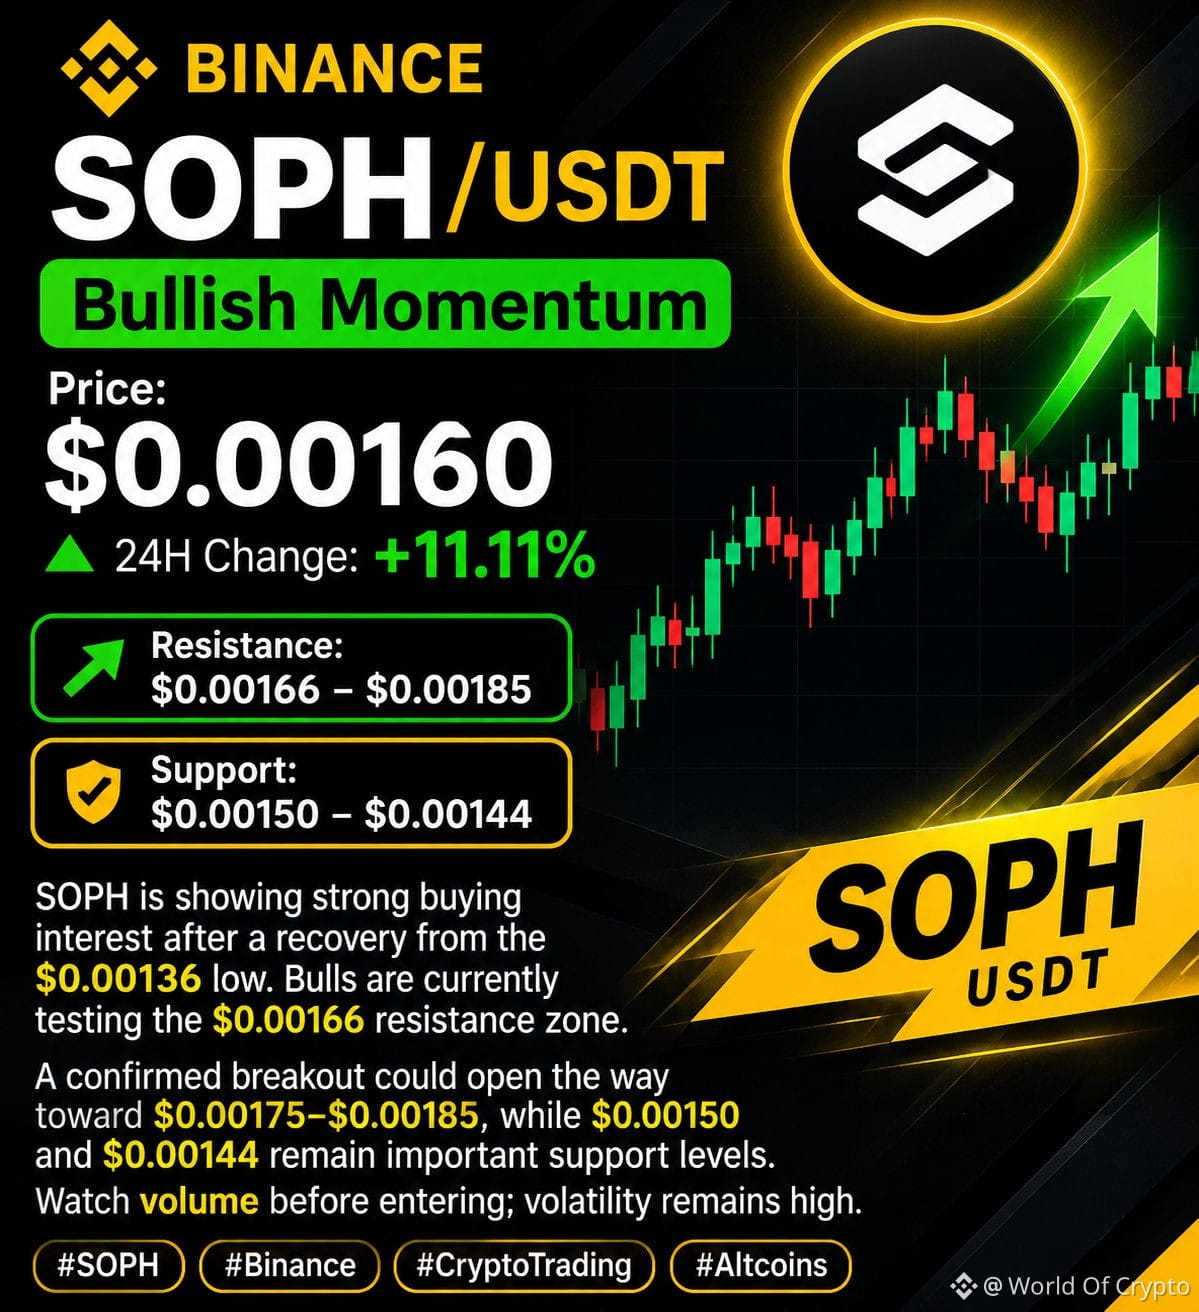
$SOPH /USDT | Bullish Momentum
Price: $0.00160
24H Change: +11.11%
SOPH is showing strong buying interest after a recovery from the $0.00136 low. Bulls are currently testing the $0.00166 resistance zone. A confirmed breakout could open the way toward $0.00175–$0.00185, while $0.00150 and $0.00144 remain important support levels. Watch volume before entering; volatility remains high.
#SOPH
{spot}(SOPHUSDT)
$SOPH /USDT | Bullish Momentum
Price: $0.00160
24H Change: +11.11%
SOPH is showing strong buying interest after a recovery from the $0.00136 low. Bulls are currently testing the $0.00166 resistance zone. A confirmed breakout could open the way toward $0.00175–$0.00185, while $0.00150 and $0.00144 remain important support levels. Watch volume before entering; volatility remains high.
#SOPH
Price: $0.00160
24H Change: +11.11%
SOPH is showing strong buying interest after a recovery from the $0.00136 low. Bulls are currently testing the $0.00166 resistance zone. A confirmed breakout could open the way toward $0.00175–$0.00185, while $0.00150 and $0.00144 remain important support levels. Watch volume before entering; volatility remains high.
#SOPH
198
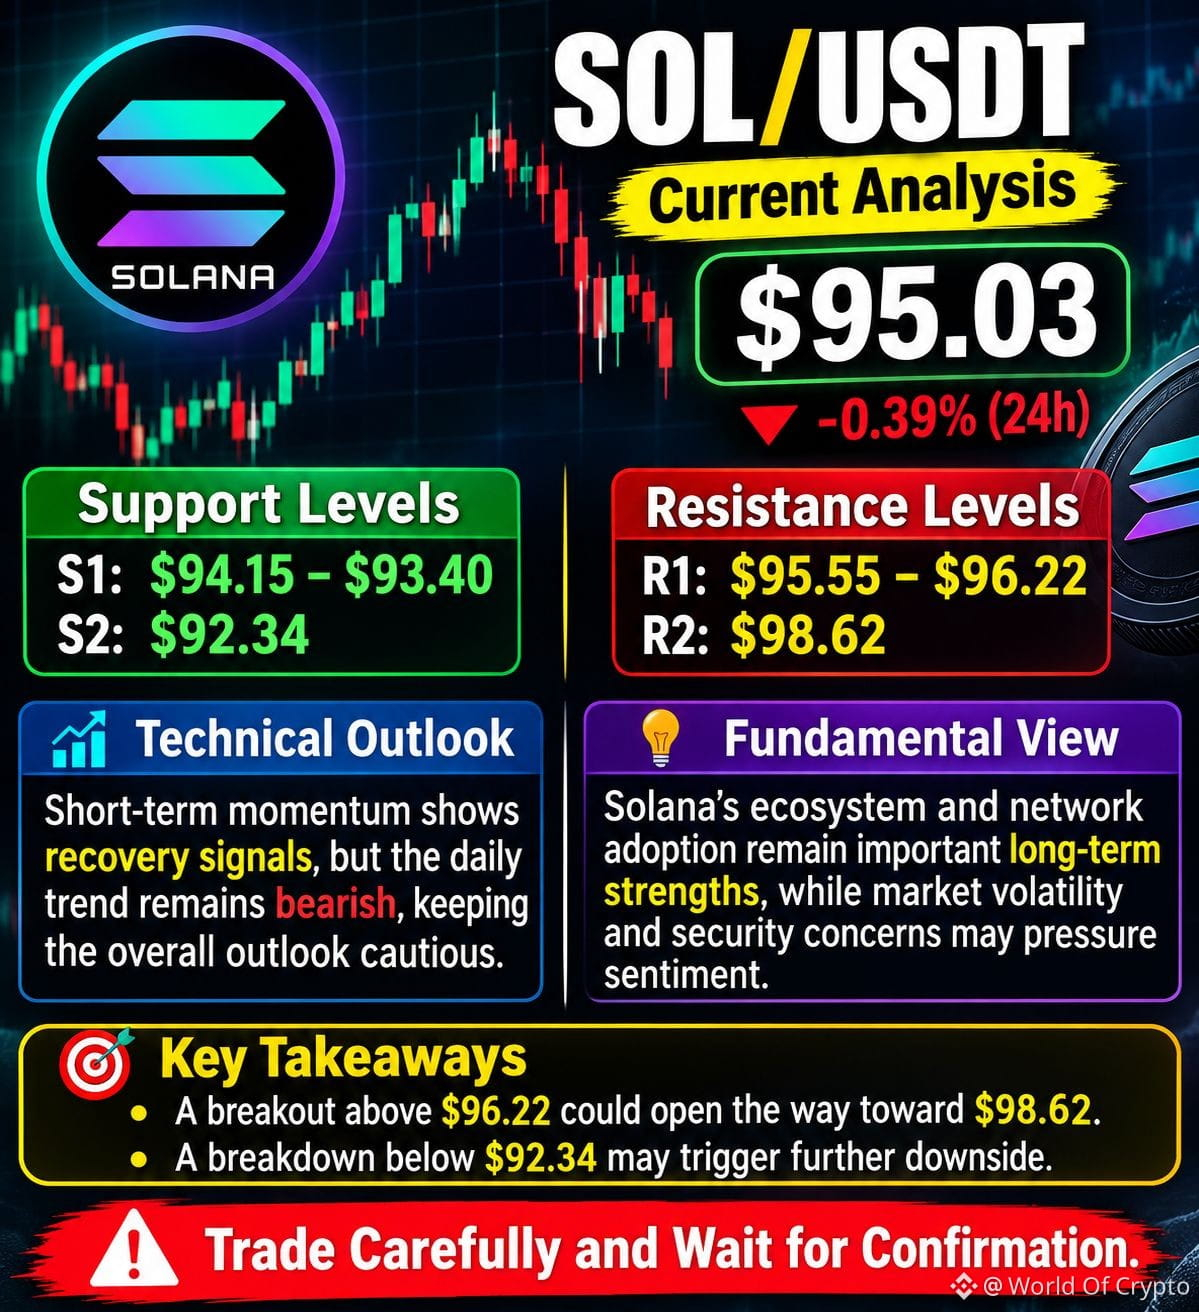
$SOL /USDT – Current Market Analysis
Solana (SOL) is currently trading around $95.03, down approximately 0.39% in the last 24 hours. Immediate support is at $94.15–$93.40, with stronger support near $92.34. Resistance stands at $95.55–$96.22, followed by $98.62. Technically, short-term momentum shows recovery signals, but the daily trend remains bearish, keeping the overall outlook cautious. Fundamentally, Solana's ecosystem and network adoption remain important long-term strengths, while market volatility and security concerns may pressure sentiment. A sustained breakout above $96.22 could open the way toward $98.62, whereas a breakdown below $92.34 may trigger further downside. Trade carefully and wait for confirmation.
{spot}(SOLUSDT)
#BinanceToResumePhaseOneOfWithdrawals
$SOL /USDT – Current Market Analysis
Solana (SOL) is currently trading around $95.03, down approximately 0.39% in the last 24 hours. Immediate support is at $94.15–$93.40, with stronger support near $92.34. Resistance stands at $95.55–$96.22, followed by $98.62. Technically, short-term momentum shows recovery signals, but the daily trend remains bearish, keeping the overall outlook cautious. Fundamentally, Solana's ecosystem and network adoption remain important long-term strengths, while market volatility and security concerns may pressure sentiment. A sustained breakout above $96.22 could open the way toward $98.62, whereas a breakdown below $92.34 may trigger further downside. Trade carefully and wait for confirmation.
#BinanceToResumePhaseOneOfWithdrawals
Solana (SOL) is currently trading around $95.03, down approximately 0.39% in the last 24 hours. Immediate support is at $94.15–$93.40, with stronger support near $92.34. Resistance stands at $95.55–$96.22, followed by $98.62. Technically, short-term momentum shows recovery signals, but the daily trend remains bearish, keeping the overall outlook cautious. Fundamentally, Solana's ecosystem and network adoption remain important long-term strengths, while market volatility and security concerns may pressure sentiment. A sustained breakout above $96.22 could open the way toward $98.62, whereas a breakdown below $92.34 may trigger further downside. Trade carefully and wait for confirmation.
#BinanceToResumePhaseOneOfWithdrawals
97
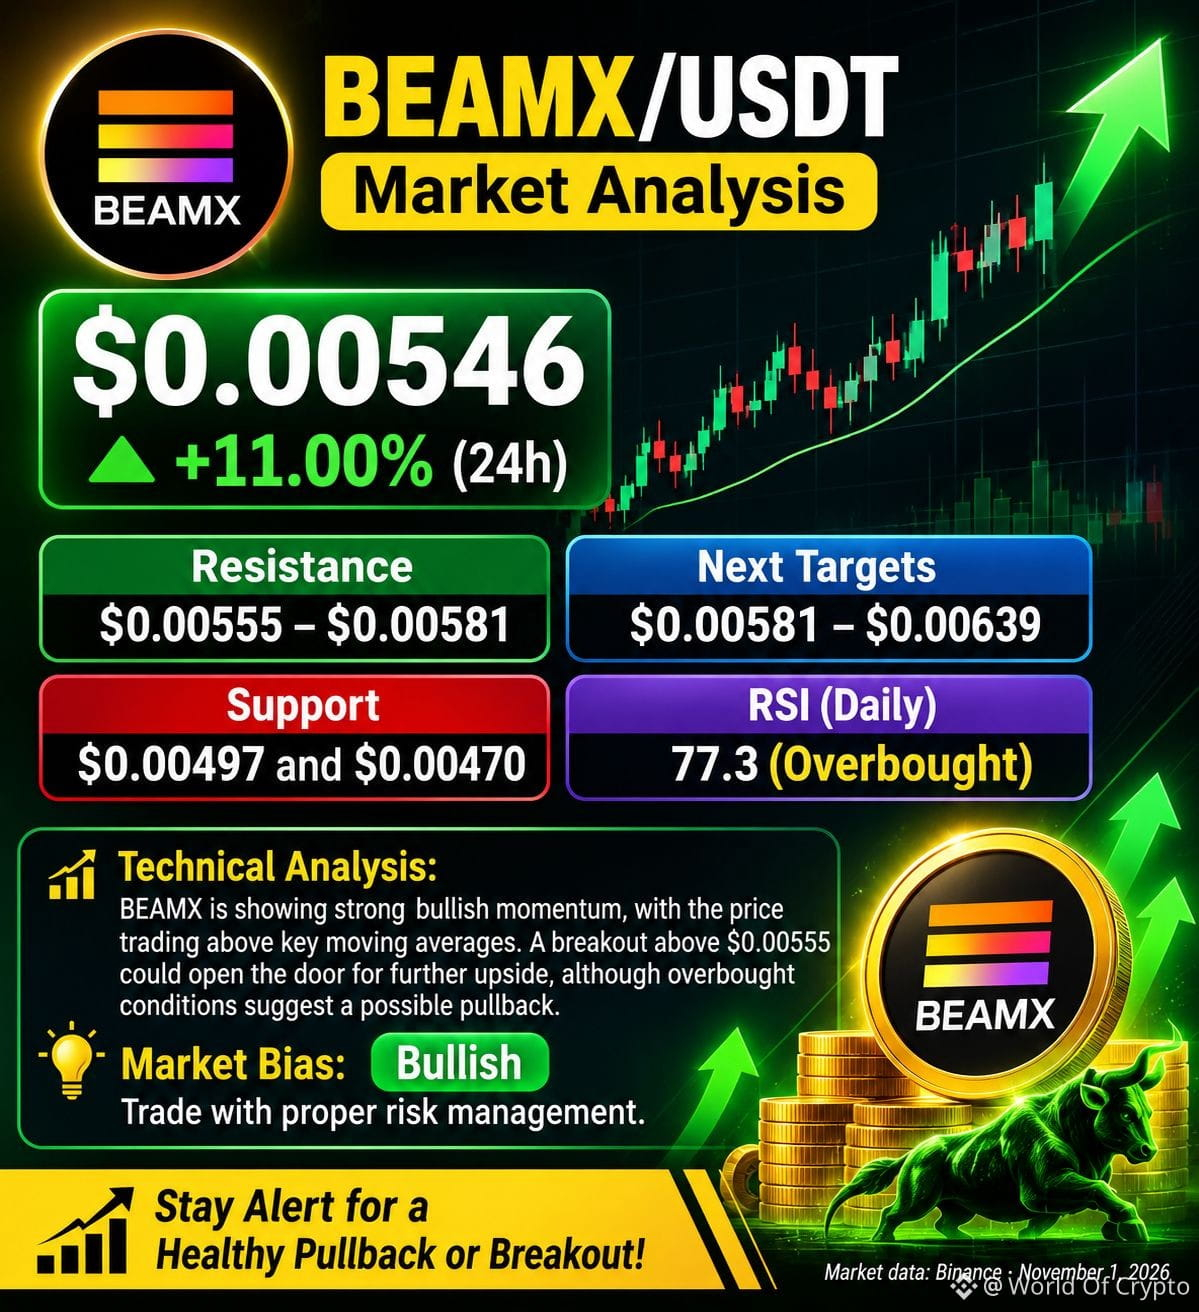
$BEAMX /USDT Market Analysis
BEAMX is showing strong bullish momentum, with the price trading around $0.00546, up approximately 11% in the last 24 hours. The technical structure remains positive, supported by strong buying pressure and bullish moving averages. Immediate resistance is at $0.00555–$0.00581, while key support stands at $0.00497 and $0.00470. A confirmed breakout above resistance could open the door for further upside, although overbought conditions suggest traders should watch for a possible pullback before entering new positions.
Market Bias: Bullish | Trade with proper risk management.
{spot}(BEAMXUSDT)
#BinanceSAFUFundTransferCompleted7499BTC 1qq
$BEAMX /USDT Market Analysis
BEAMX is showing strong bullish momentum, with the price trading around $0.00546, up approximately 11% in the last 24 hours. The technical structure remains positive, supported by strong buying pressure and bullish moving averages. Immediate resistance is at $0.00555–$0.00581, while key support stands at $0.00497 and $0.00470. A confirmed breakout above resistance could open the door for further upside, although overbought conditions suggest traders should watch for a possible pullback before entering new positions.
Market Bias: Bullish | Trade with proper risk management.
#BinanceSAFUFundTransferCompleted7499BTC 1qq
BEAMX is showing strong bullish momentum, with the price trading around $0.00546, up approximately 11% in the last 24 hours. The technical structure remains positive, supported by strong buying pressure and bullish moving averages. Immediate resistance is at $0.00555–$0.00581, while key support stands at $0.00497 and $0.00470. A confirmed breakout above resistance could open the door for further upside, although overbought conditions suggest traders should watch for a possible pullback before entering new positions.
Market Bias: Bullish | Trade with proper risk management.
#BinanceSAFUFundTransferCompleted7499BTC 1qq
426
$BTC /USDT – Bitcoin Market Analysis
Bitcoin is currently trading around $77,963, showing a modest recovery with buyers attempting to regain short-term momentum. The broader market structure remains cautious, while Bitcoin's limited supply and long-term institutional adoption continue to support its fundamental outlook. Technically, the daily RSI is around 37.5, indicating weak momentum, while the 4H trend remains bearish. Immediate Support: $76,974 – $76,074. Strong Support: $74,842. Immediate Resistance: $78,041 – $79,119. Major Resistance: $80,392. A confirmed breakout above $79,119 could open the way toward $80,392, while a breakdown below $76,974 may trigger further downside. Overall, BTC remains volatile with a cautious short-term outlook. Watch volume and candle-closing confirmation before entering any trade.
#BTC
{spot}(BTCUSDT)
#BinanceSAFUFundTransferCompleted7499BTC
$BTC /USDT – Bitcoin Market Analysis
Bitcoin is currently trading around $77,963, showing a modest recovery with buyers attempting to regain short-term momentum. The broader market structure remains cautious, while Bitcoin's limited supply and long-term institutional adoption continue to support its fundamental outlook. Technically, the daily RSI is around 37.5, indicating weak momentum, while the 4H trend remains bearish. Immediate Support: $76,974 – $76,074. Strong Support: $74,842. Immediate Resistance: $78,041 – $79,119. Major Resistance: $80,392. A confirmed breakout above $79,119 could open the way toward $80,392, while a breakdown below $76,974 may trigger further downside. Overall, BTC remains volatile with a cautious short-term outlook. Watch volume and candle-closing confirmation before entering any trade.
#BTC
#BinanceSAFUFundTransferCompleted7499BTC
Bitcoin is currently trading around $77,963, showing a modest recovery with buyers attempting to regain short-term momentum. The broader market structure remains cautious, while Bitcoin's limited supply and long-term institutional adoption continue to support its fundamental outlook. Technically, the daily RSI is around 37.5, indicating weak momentum, while the 4H trend remains bearish. Immediate Support: $76,974 – $76,074. Strong Support: $74,842. Immediate Resistance: $78,041 – $79,119. Major Resistance: $80,392. A confirmed breakout above $79,119 could open the way toward $80,392, while a breakdown below $76,974 may trigger further downside. Overall, BTC remains volatile with a cautious short-term outlook. Watch volume and candle-closing confirmation before entering any trade.
#BTC
#BinanceSAFUFundTransferCompleted7499BTC

42
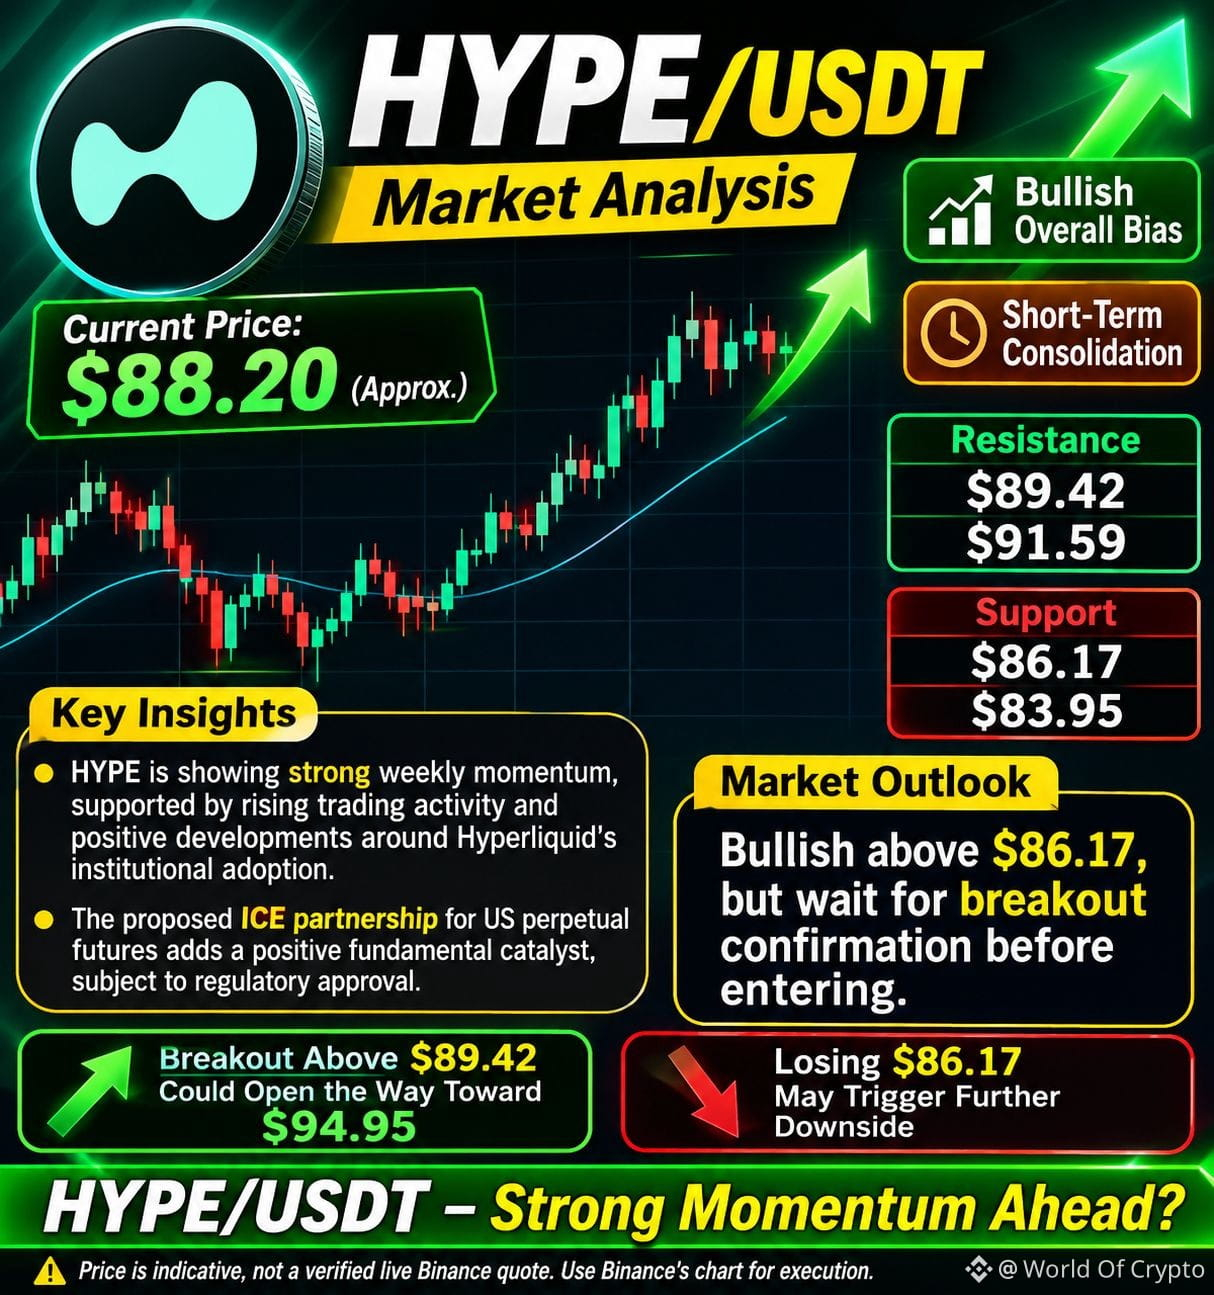
$HYPE is showing strong weekly momentum, supported by rising trading activity and positive developments around Hyperliquid's institutional adoption. The proposed ICE partnership for US perpetual futures adds a positive fundamental catalyst, subject to regulatory approval. Technically, price is consolidating near $88, with support at $86.17 and $83.95 and resistance at $89.42 and $91.59. A breakout above $89.42 could open the way toward $94.95, while losing $86.17 may trigger further downside.
Market Outlook: Bullish above $86.17, but wait for breakout confirmation before entering.
{spot}(HYPEUSDT)
#YiHe:ProofOfReserves:10TokensAt100%Backing
$HYPE is showing strong weekly momentum, supported by rising trading activity and positive developments around Hyperliquid's institutional adoption. The proposed ICE partnership for US perpetual futures adds a positive fundamental catalyst, subject to regulatory approval. Technically, price is consolidating near $88, with support at $86.17 and $83.95 and resistance at $89.42 and $91.59. A breakout above $89.42 could open the way toward $94.95, while losing $86.17 may trigger further downside.
Market Outlook: Bullish above $86.17, but wait for breakout confirmation before entering.
#YiHe:ProofOfReserves:10TokensAt100%Backing
Market Outlook: Bullish above $86.17, but wait for breakout confirmation before entering.
#YiHe:ProofOfReserves:10TokensAt100%Backing
152
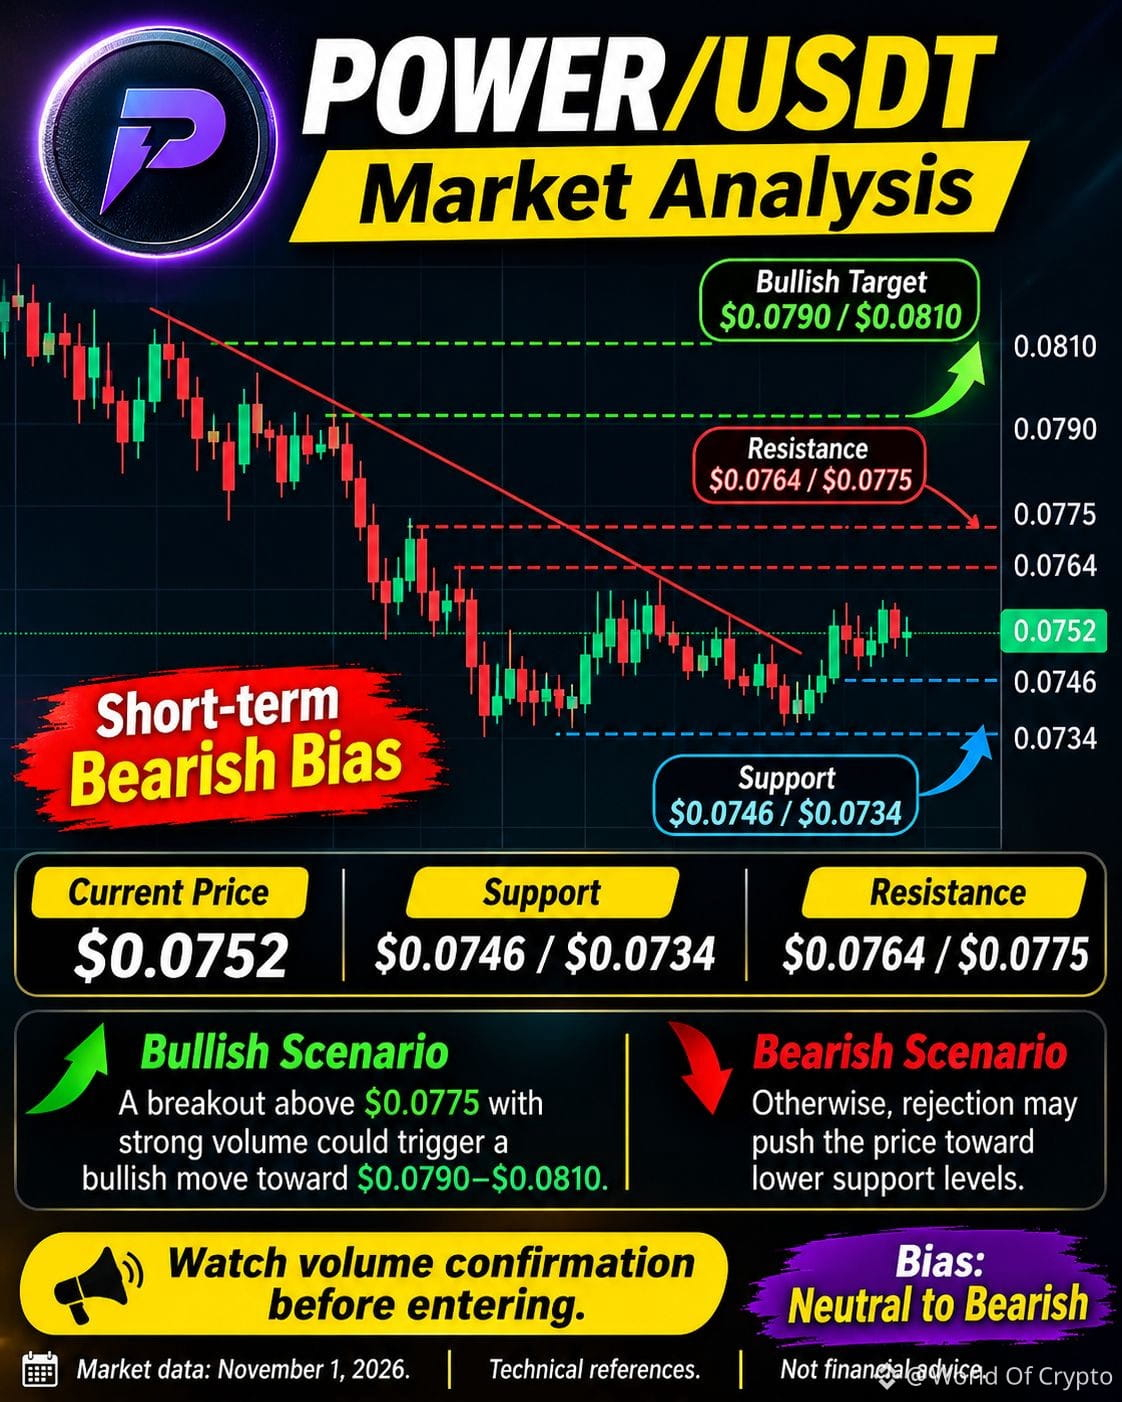
$POWER is currently trading around $0.0752, showing a short-term recovery, but the overall technical structure remains bearish. Daily and 4H indicators show selling pressure, while the 1H chart is neutral. Immediate support is at $0.0746, followed by $0.0734, while resistance stands at $0.0764–$0.0775. A breakout above $0.0775 with strong volume could trigger a bullish move toward $0.0790–$0.0810; otherwise, rejection may push the price toward lower support levels. Watch volume confirmation before entering
{future}(POWERUSDT)
#BackedNotBroken:RichardTengSaysUsersBearNoLoss
$POWER is currently trading around $0.0752, showing a short-term recovery, but the overall technical structure remains bearish. Daily and 4H indicators show selling pressure, while the 1H chart is neutral. Immediate support is at $0.0746, followed by $0.0734, while resistance stands at $0.0764–$0.0775. A breakout above $0.0775 with strong volume could trigger a bullish move toward $0.0790–$0.0810; otherwise, rejection may push the price toward lower support levels. Watch volume confirmation before entering
#BackedNotBroken:RichardTengSaysUsersBearNoLoss
#BackedNotBroken:RichardTengSaysUsersBearNoLoss
167
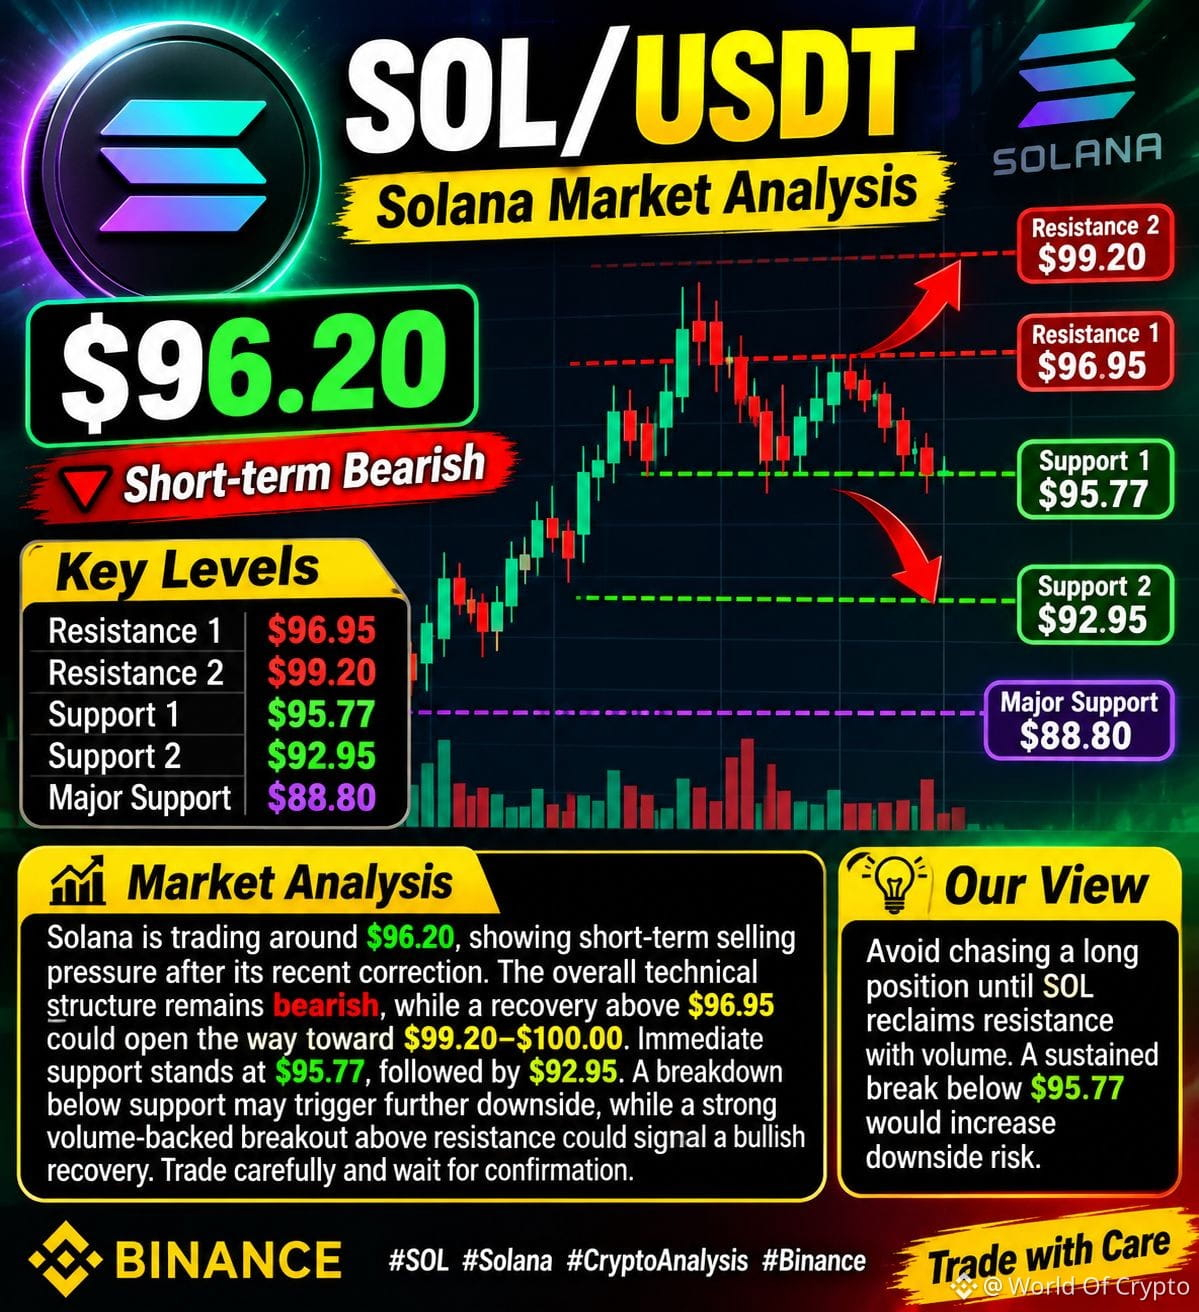
$SOL /USDT MARKET ANALYSIS
Solana is trading around $96.20, showing short-term selling pressure after its recent correction. The overall technical structure remains bearish, while a recovery above $96.95 could open the way toward $99.20–$100.00. Immediate support stands at $95.77, followed by $92.95. A breakdown below support may trigger further downside, while a strong volume-backed breakout above resistance could signal a bullish recovery. Trade carefully and wait for confirmation.
#SOL
{spot}(SOLUSDT)
#ASICHasReceivedNoPredictionMarketApplications
$SOL /USDT MARKET ANALYSIS
Solana is trading around $96.20, showing short-term selling pressure after its recent correction. The overall technical structure remains bearish, while a recovery above $96.95 could open the way toward $99.20–$100.00. Immediate support stands at $95.77, followed by $92.95. A breakdown below support may trigger further downside, while a strong volume-backed breakout above resistance could signal a bullish recovery. Trade carefully and wait for confirmation.
#SOL
#ASICHasReceivedNoPredictionMarketApplications
Solana is trading around $96.20, showing short-term selling pressure after its recent correction. The overall technical structure remains bearish, while a recovery above $96.95 could open the way toward $99.20–$100.00. Immediate support stands at $95.77, followed by $92.95. A breakdown below support may trigger further downside, while a strong volume-backed breakout above resistance could signal a bullish recovery. Trade carefully and wait for confirmation.
#SOL
#ASICHasReceivedNoPredictionMarketApplications
69
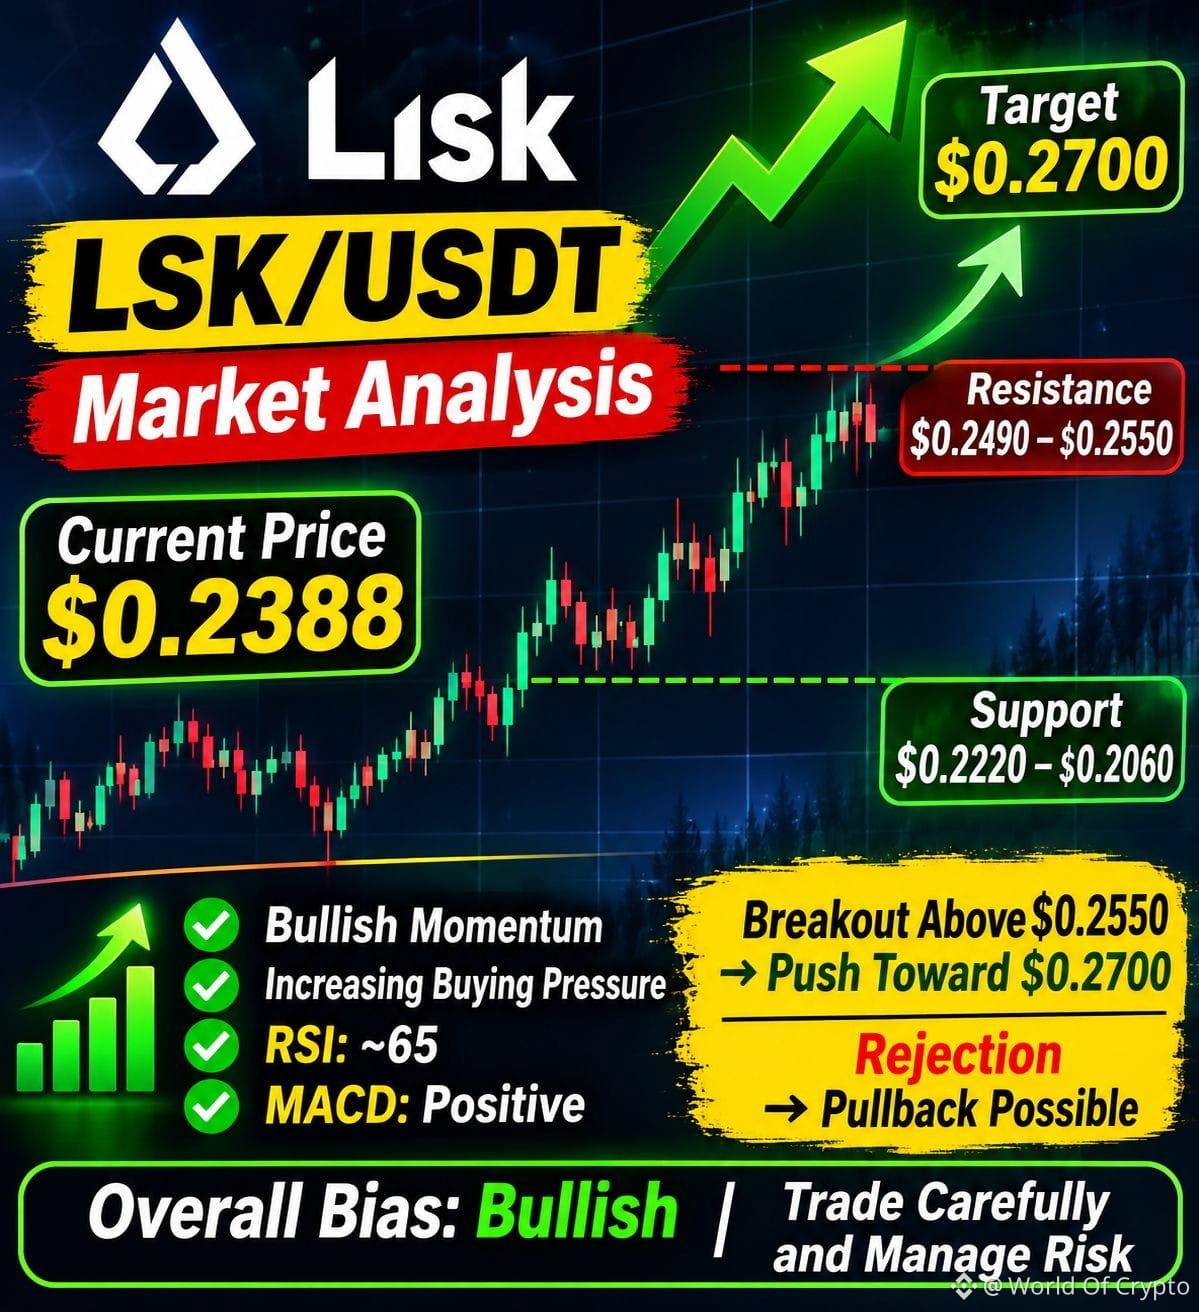
$LSK /USDT is showing bullish momentum with increasing buying pressure. Resistance: $0.2490–$0.2550. Support: $0.2220–$0.2060. A breakout above $0.2550 could push the price toward $0.2700, while rejection may trigger a short-term pullback. Overall bias remains bullish; watch volume and manage risk carefully.
{spot}(LSKUSDT)
#ASICHasReceivedNoPredictionMarketApplications
$LSK /USDT is showing bullish momentum with increasing buying pressure. Resistance: $0.2490–$0.2550. Support: $0.2220–$0.2060. A breakout above $0.2550 could push the price toward $0.2700, while rejection may trigger a short-term pullback. Overall bias remains bullish; watch volume and manage risk carefully.
#ASICHasReceivedNoPredictionMarketApplications
#ASICHasReceivedNoPredictionMarketApplications
257
₿ $BTC /USDT | BITCOIN MARKET UPDATE
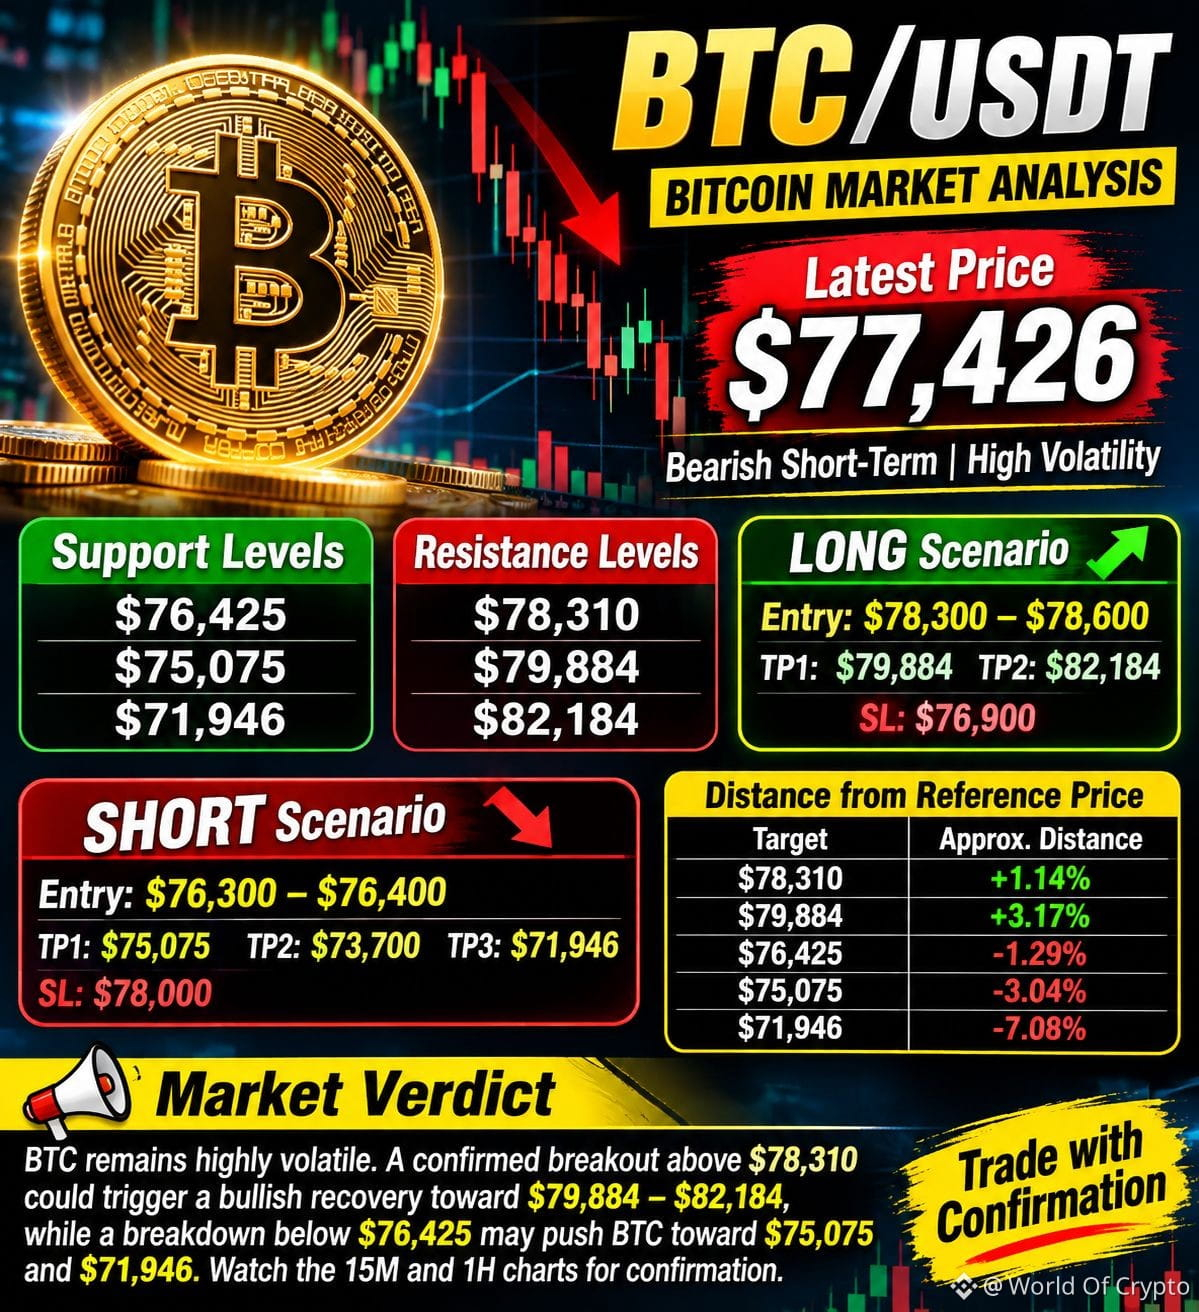
Bitcoin is trading near $77,426, with bearish short-term momentum and increased market volatility. Fundamental uncertainty and selling pressure are keeping traders cautious. Key support levels are $76,425, $75,075 and $71,946, while resistance stands at $78,310, $79,884 and $82,184. A confirmed breakout above $78,310 could trigger a bullish recovery toward $79,884–$82,184, while a breakdown below $76,425 may push BTC toward $75,075 and $71,946. Overall bias remains cautious until buyers reclaim resistance. Watch the 15M and 1H charts for confirmation before entering any trade.
#BTC
{spot}(BTCUSDT)
₿ $BTC /USDT | BITCOIN MARKET UPDATE
Bitcoin is trading near $77,426, with bearish short-term momentum and increased market volatility. Fundamental uncertainty and selling pressure are keeping traders cautious. Key support levels are $76,425, $75,075 and $71,946, while resistance stands at $78,310, $79,884 and $82,184. A confirmed breakout above $78,310 could trigger a bullish recovery toward $79,884–$82,184, while a breakdown below $76,425 may push BTC toward $75,075 and $71,946. Overall bias remains cautious until buyers reclaim resistance. Watch the 15M and 1H charts for confirmation before entering any trade.
#BTC
Bitcoin is trading near $77,426, with bearish short-term momentum and increased market volatility. Fundamental uncertainty and selling pressure are keeping traders cautious. Key support levels are $76,425, $75,075 and $71,946, while resistance stands at $78,310, $79,884 and $82,184. A confirmed breakout above $78,310 could trigger a bullish recovery toward $79,884–$82,184, while a breakdown below $76,425 may push BTC toward $75,075 and $71,946. Overall bias remains cautious until buyers reclaim resistance. Watch the 15M and 1H charts for confirmation before entering any trade.
#BTC
52
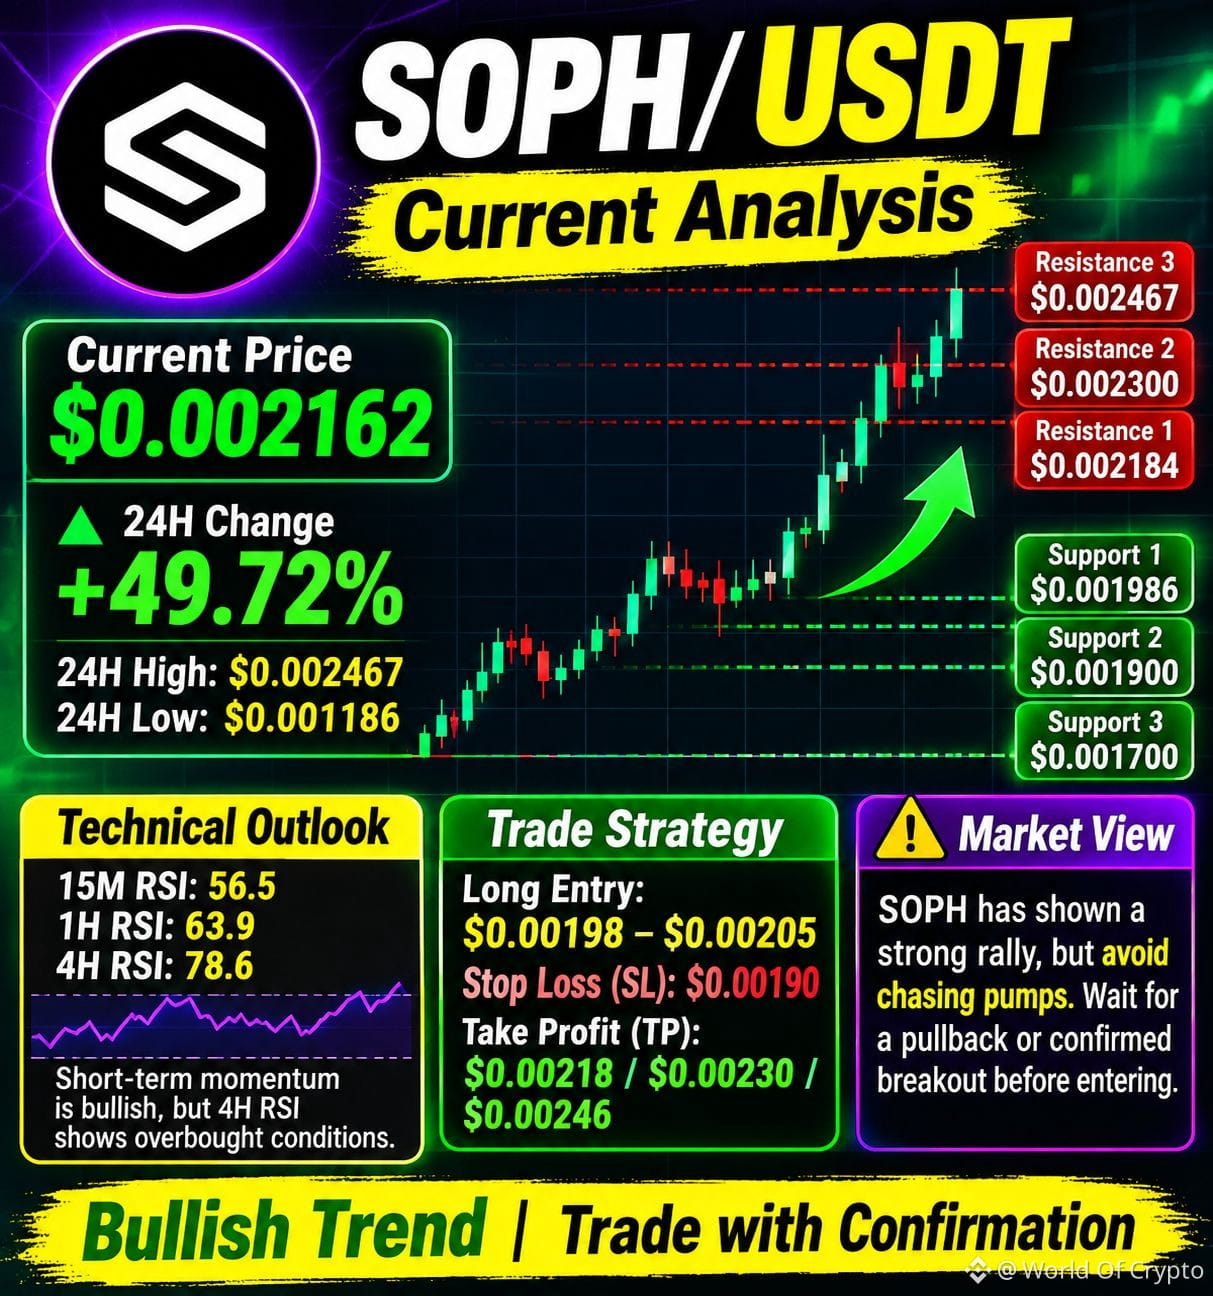
$SOPH /USDT is showing strong bullish momentum after a significant 24-hour rally of nearly 50%, with price trading around $0.002162. The key resistance levels are $0.002184, $0.002300, and $0.002467, while major support lies at $0.001986 and $0.001900. A confirmed breakout above $0.002184 could push SOPH toward $0.002300–$0.002467, while losing $0.001986 may trigger a deeper pullback. The overall short-term trend remains bullish, but traders should avoid chasing pumps and wait for confirmation before entering.
{spot}(SOPHUSDT)
#UniswapA16zSeekDeFiExemptionFromIllinoisCryptoTax
$SOPH /USDT is showing strong bullish momentum after a significant 24-hour rally of nearly 50%, with price trading around $0.002162. The key resistance levels are $0.002184, $0.002300, and $0.002467, while major support lies at $0.001986 and $0.001900. A confirmed breakout above $0.002184 could push SOPH toward $0.002300–$0.002467, while losing $0.001986 may trigger a deeper pullback. The overall short-term trend remains bullish, but traders should avoid chasing pumps and wait for confirmation before entering.
#UniswapA16zSeekDeFiExemptionFromIllinoisCryptoTax
#UniswapA16zSeekDeFiExemptionFromIllinoisCryptoTax
160
Войдите, чтобы посмотреть больше материала
Присоединяйтесь к пользователям криптовалют по всему миру на Binance Square
⚡️ Получайте новейшую и полезную информацию о криптоактивах.
💬 Нам доверяет крупнейшая в мире криптобиржа.
👍 Получите достоверные аналитические данные от верифицированных создателей контента.
Эл. почта/номер телефона
В тренде
USMidterms-WhatAreMarketsExpecting?
Просмотров: 152,821
1,131 обсуждают
Democratic Congressional Sweep Shakes Trump Trades in AI Stocks and Crypto
Binance News
·Лайков: 17
·Просмотров: 6.1k
USOctoberNFP-AreRateCutsStillPossible
Просмотров: 284,085
2,188 обсуждают
CircleQ3Revenue865M
Просмотров: 2,492
129 обсуждают