

Market_Hawk
37 Публикации

Market_Hawk
Отправить жалобу
Заблокировать пользователя
Открытая сделка
3.3 г
0 подписок(и/а)
1 подписчиков(а)
0 понравилось
Посты
Портфель
·
--
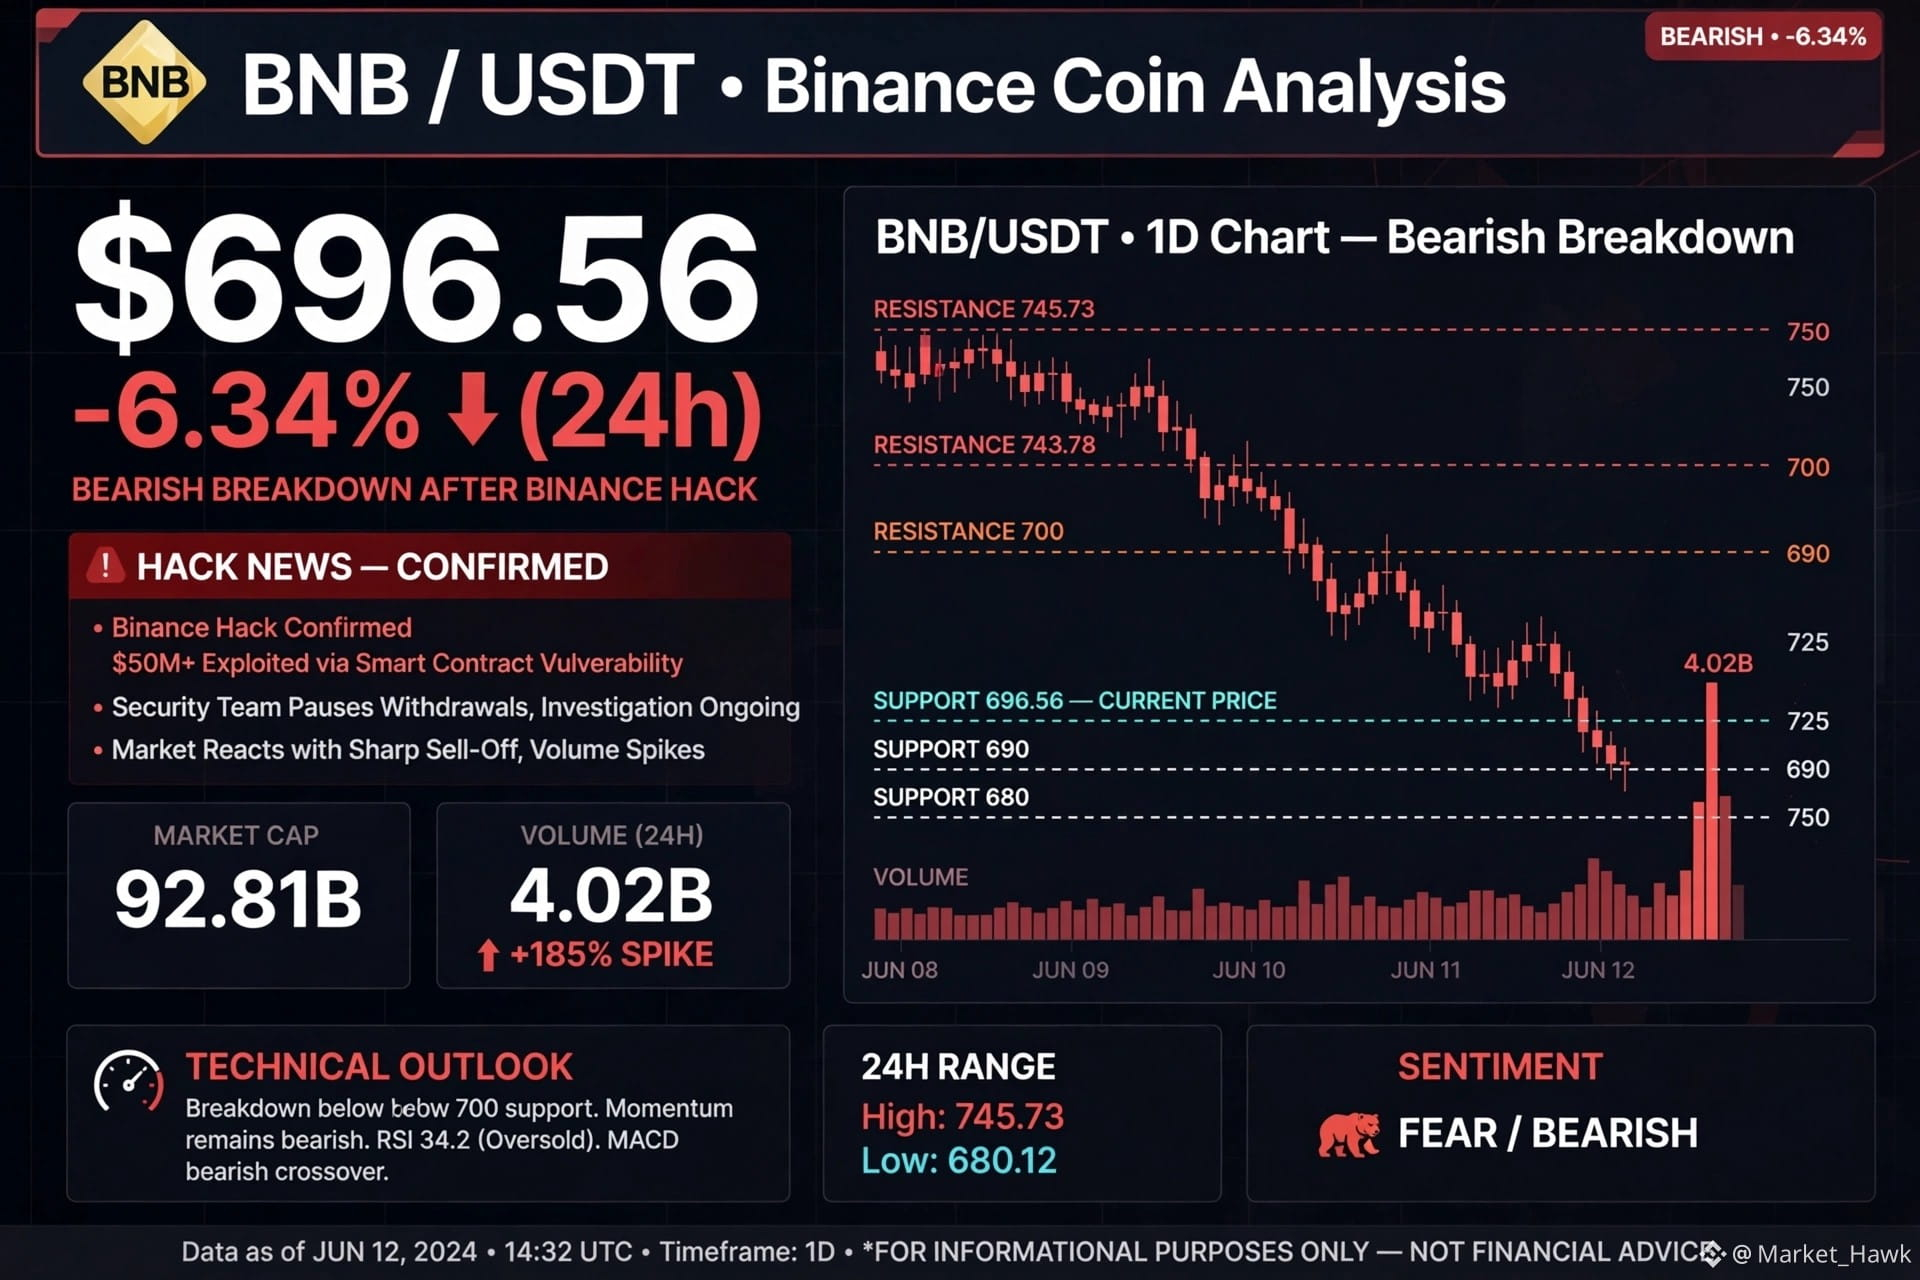
$BNB at $696.56 down -6.34% — bearish breakdown after Binance hack confirmed, volume spiked +185% to $4.02B, breaking $700. Holding near $680 low, needs reclaim of $700-$743 to recover #UniswapA16zSeekDeFiExemptionFromIllinoisCryptoTax #HKDollarStablecoinHKDAPToLaunchOnSolana #KOSPIFalls3.53%BackBelow6000 #AmazonSharesFallAbout7%InPremarketTrading
{spot}(BNBUSDT)
$BNB at $696.56 down -6.34% — bearish breakdown after Binance hack confirmed, volume spiked +185% to $4.02B, breaking $700. Holding near $680 low, needs reclaim of $700-$743 to recover #UniswapA16zSeekDeFiExemptionFromIllinoisCryptoTax #HKDollarStablecoinHKDAPToLaunchOnSolana #KOSPIFalls3.53%BackBelow6000 #AmazonSharesFallAbout7%InPremarketTrading
54
·
--
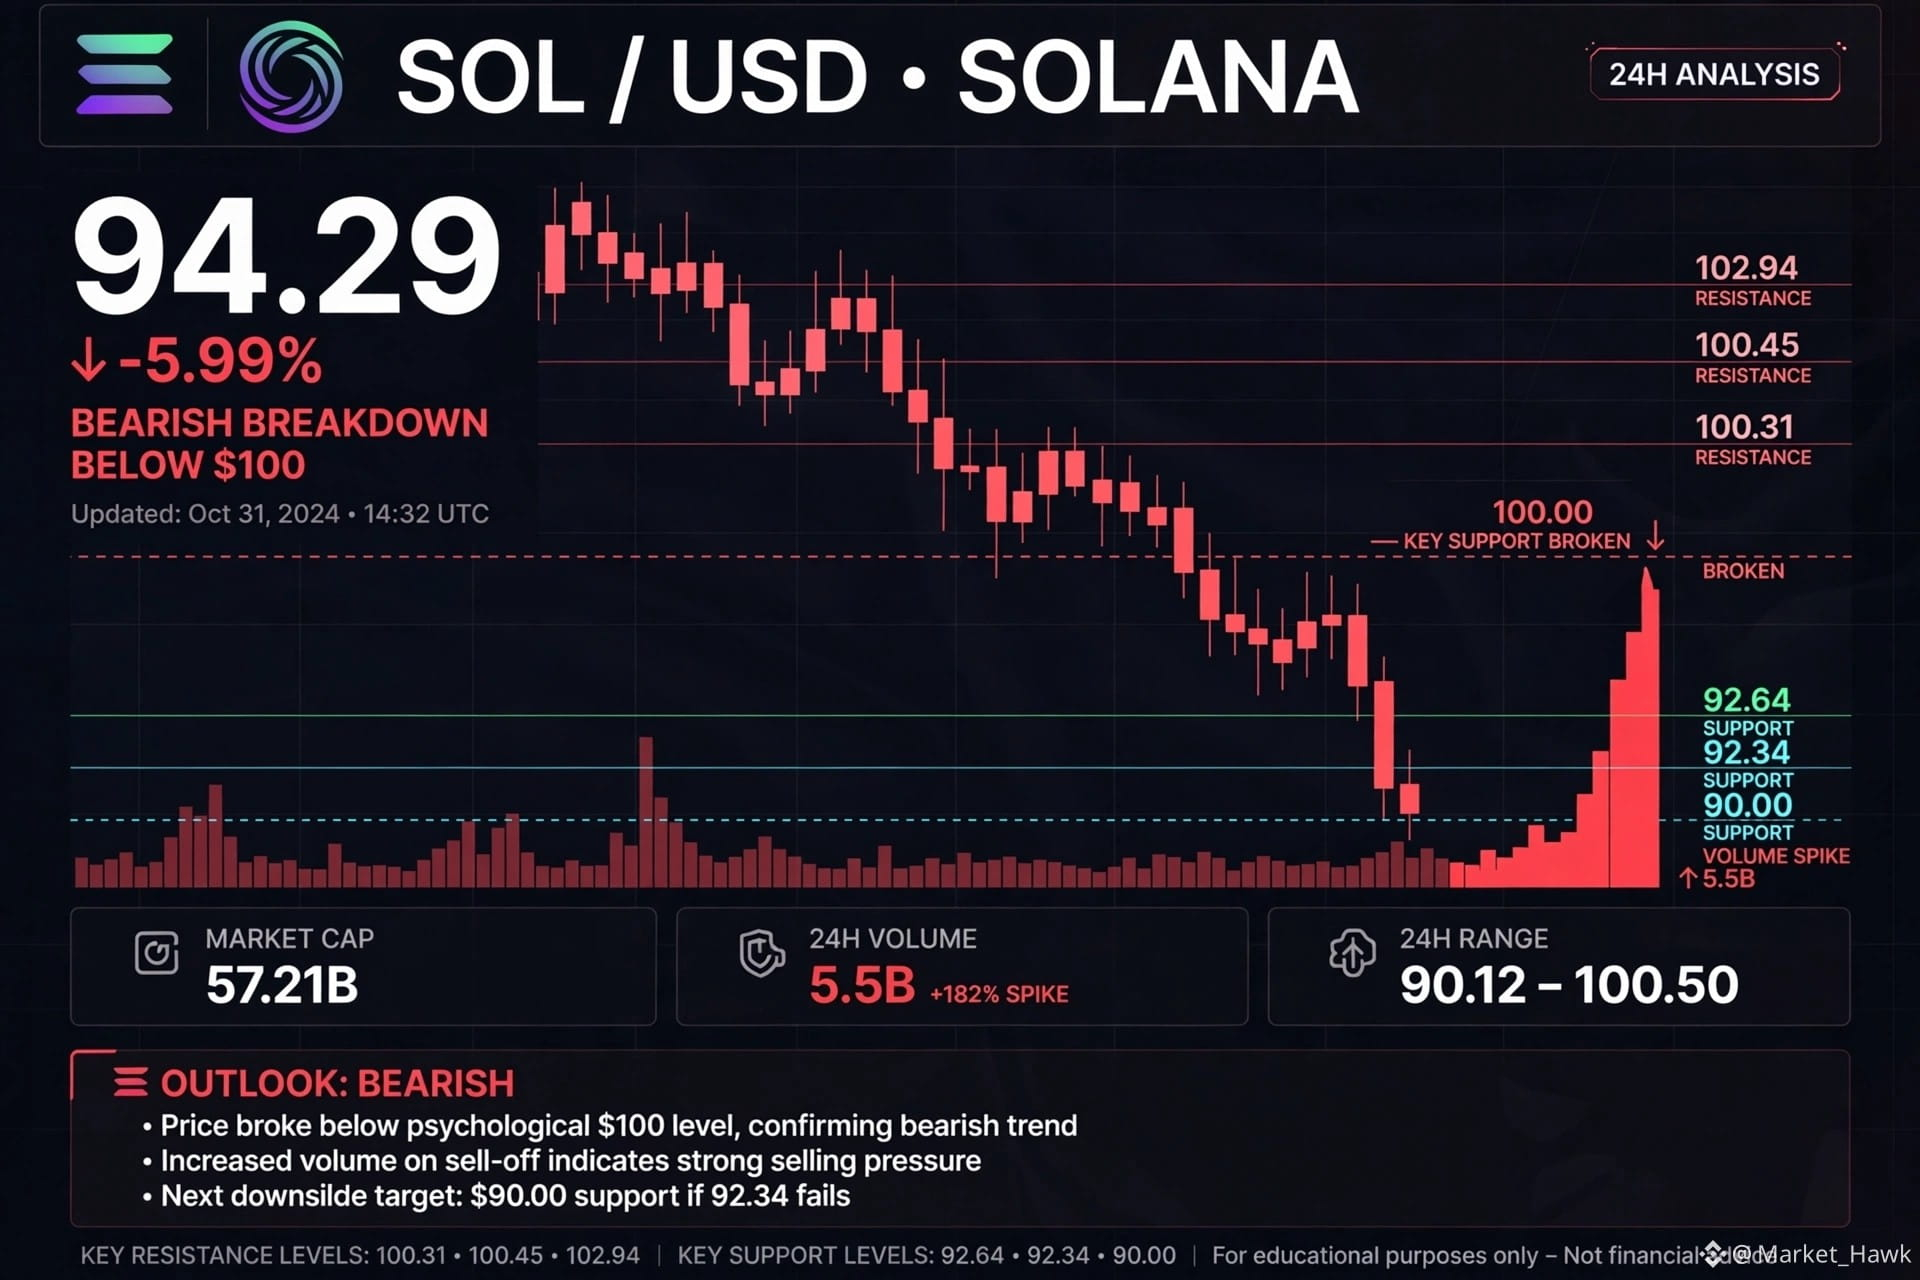
$SOL at $94.29 down -5.99% — bearish breakdown below the psychological $100 level with $5.5B volume spike, now testing $92.34 support. Needs reclaim of $100.31 to flip, otherwise next target $90 #UniswapA16zSeekDeFiExemptionFromIllinoisCryptoTax #HKDollarStablecoinHKDAPToLaunchOnSolana #KOSPIFalls3.53%BackBelow6000 #AmazonSharesFallAbout7%InPremarketTrading
{spot}(SOLUSDT)
$SOL at $94.29 down -5.99% — bearish breakdown below the psychological $100 level with $5.5B volume spike, now testing $92.34 support. Needs reclaim of $100.31 to flip, otherwise next target $90 #UniswapA16zSeekDeFiExemptionFromIllinoisCryptoTax #HKDollarStablecoinHKDAPToLaunchOnSolana #KOSPIFalls3.53%BackBelow6000 #AmazonSharesFallAbout7%InPremarketTrading
124
·
--
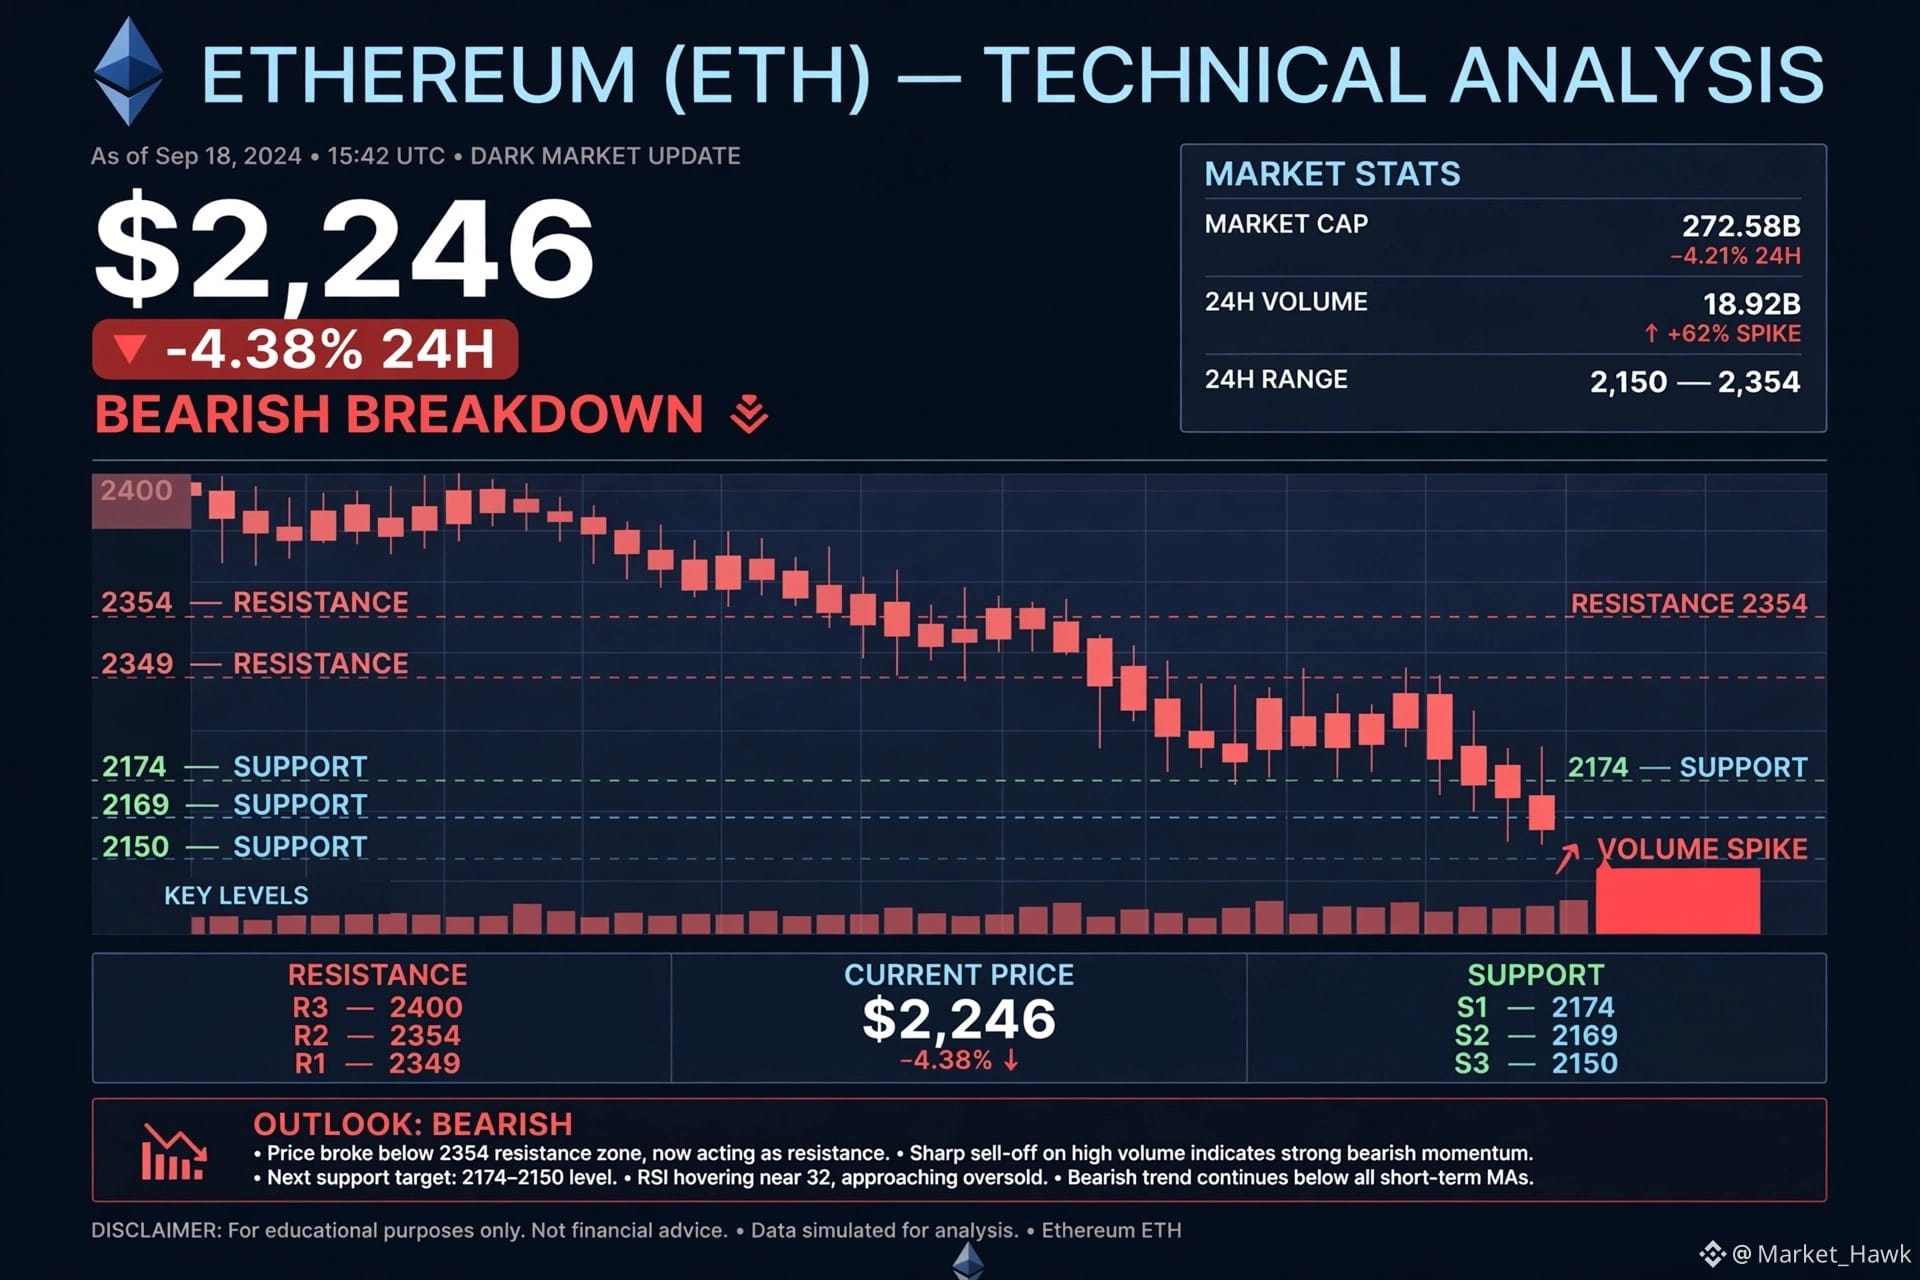
$ETH at $2,246 down -4.38% in a bearish breakdown after losing $2,349-$2,354 resistance, now eyeing $2,174 support. Volume spiked +62%, trend stays below MA-20/50#UniswapA16zSeekDeFiExemptionFromIllinoisCryptoTax #HKDollarStablecoinHKDAPToLaunchOnSolana #KOSPIFalls3.53%BackBelow6000 #AmazonSharesFallAbout7%InPremarketTrading
{spot}(ETHUSDT)
$ETH at $2,246 down -4.38% in a bearish breakdown after losing $2,349-$2,354 resistance, now eyeing $2,174 support. Volume spiked +62%, trend stays below MA-20/50#UniswapA16zSeekDeFiExemptionFromIllinoisCryptoTax #HKDollarStablecoinHKDAPToLaunchOnSolana #KOSPIFalls3.53%BackBelow6000 #AmazonSharesFallAbout7%InPremarketTrading
95
·
--
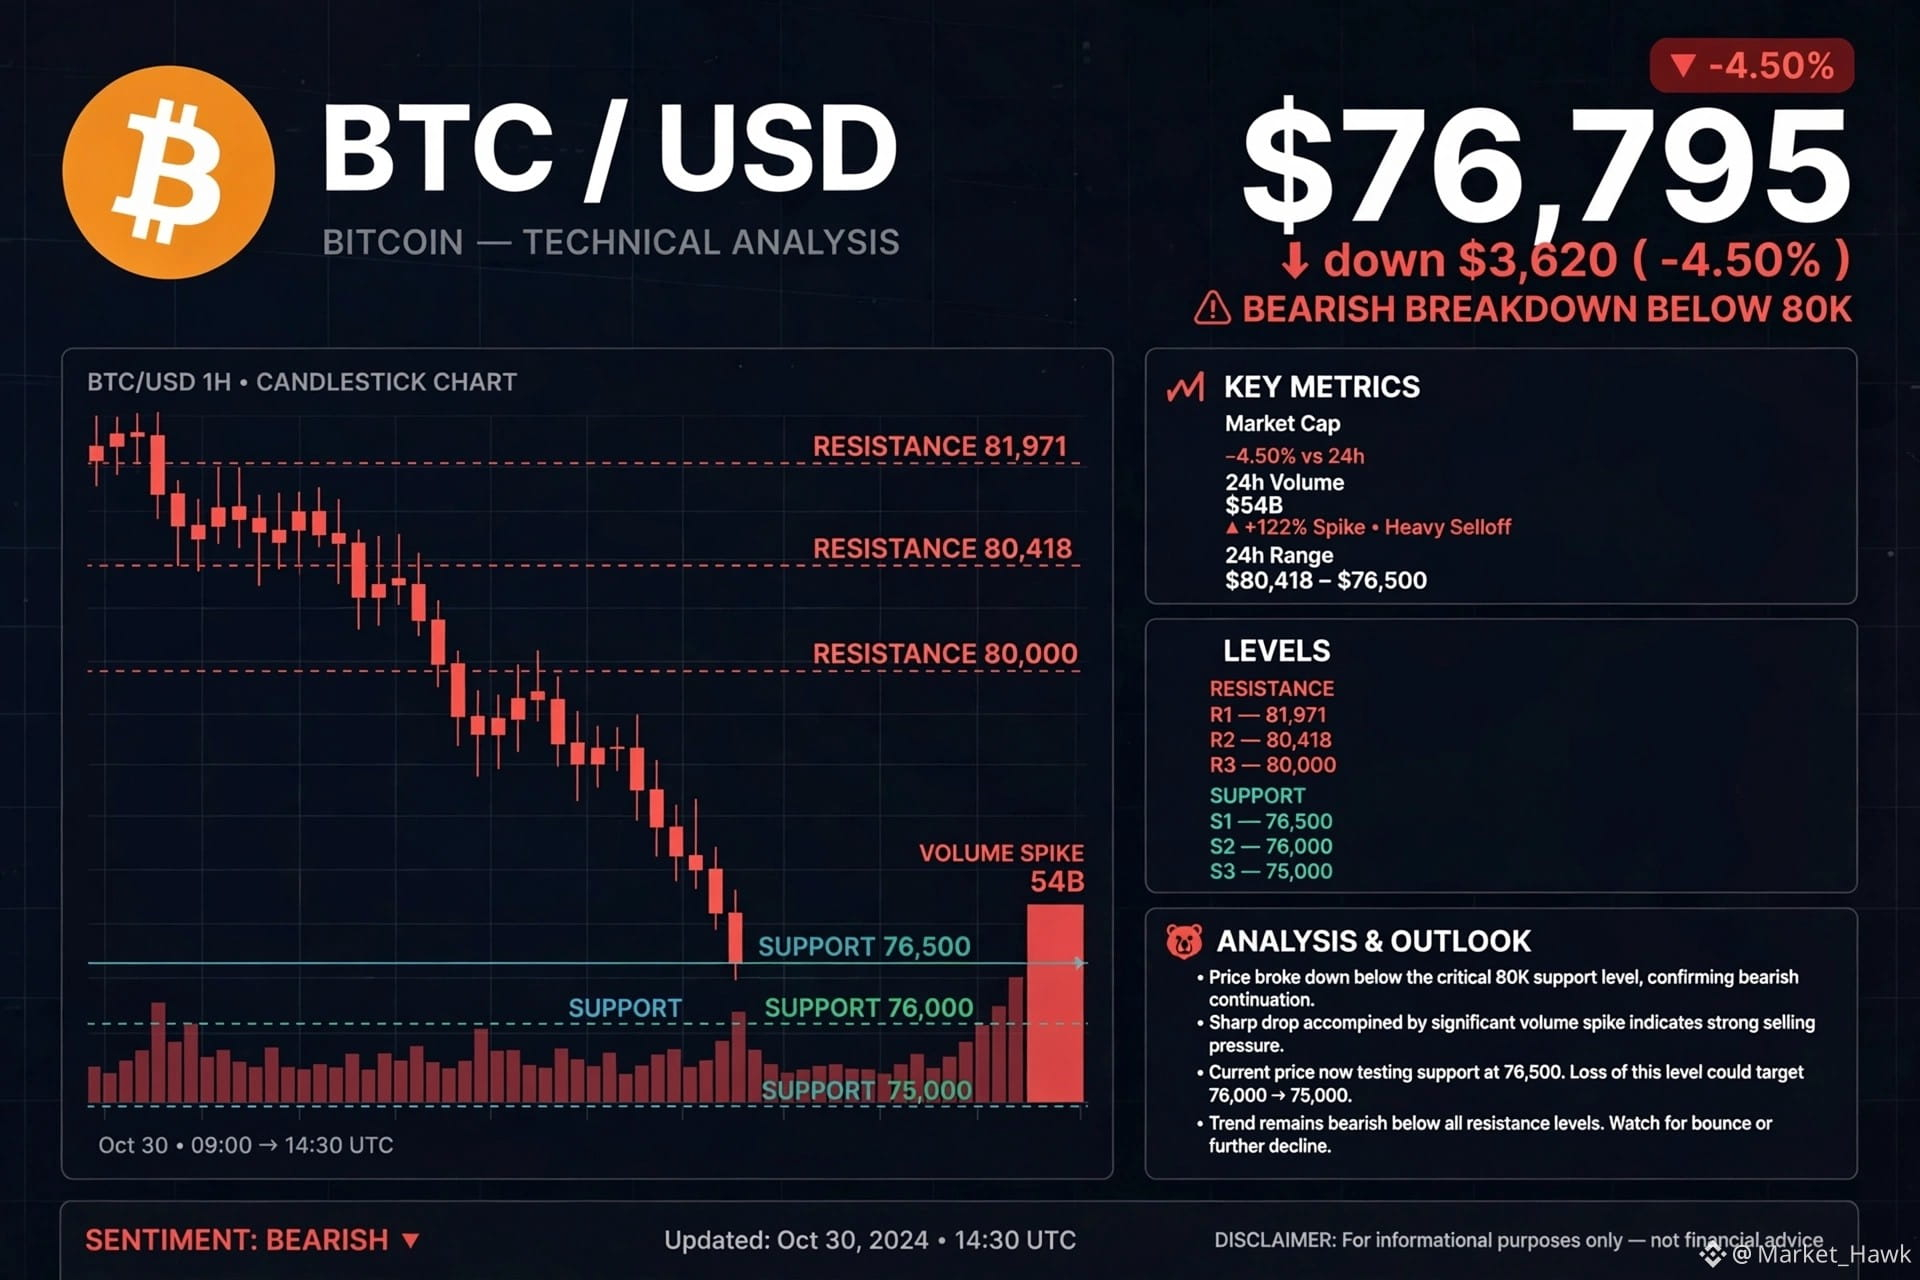
$BTC just broke down — $76,795 down -4.50% with $54B volume spike, now testing $76,500 support after losing $80K. Reclaim $80,418 needed to flip bullish, otherwise eyes on $75K #UniswapA16zSeekDeFiExemptionFromIllinoisCryptoTax #KOSPIFalls3.53%BackBelow6000 #AmazonSharesFallAbout7%InPremarketTrading #USMidtermElections
{spot}(BTCUSDT)
$BTC just broke down — $76,795 down -4.50% with $54B volume spike, now testing $76,500 support after losing $80K. Reclaim $80,418 needed to flip bullish, otherwise eyes on $75K #UniswapA16zSeekDeFiExemptionFromIllinoisCryptoTax #KOSPIFalls3.53%BackBelow6000 #AmazonSharesFallAbout7%InPremarketTrading #USMidtermElections
91
·
--
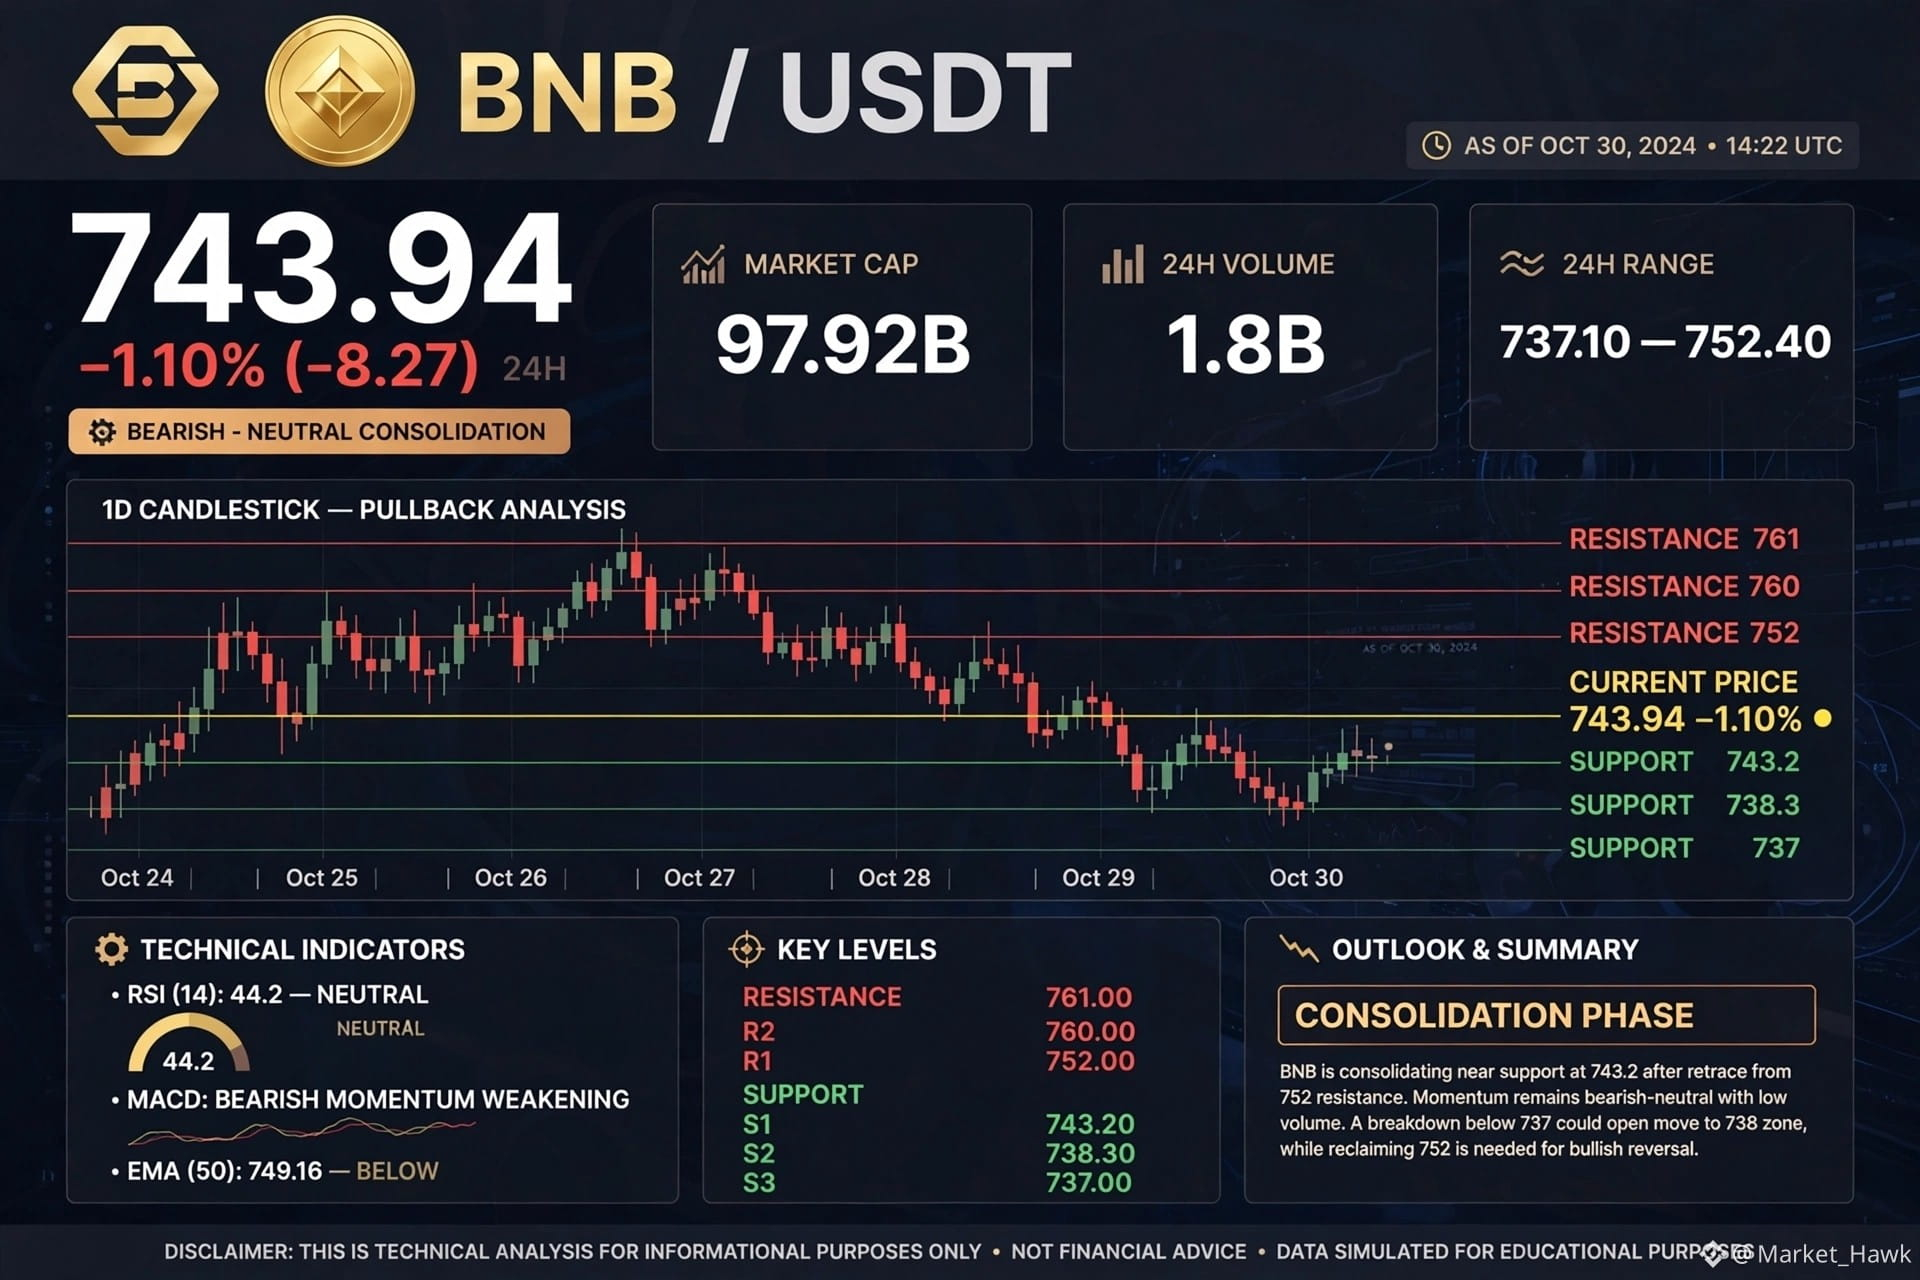
$BNB — $743.94 down -1.10% in a bearish-neutral consolidation after rejecting $761, with $743.2 immediate support and $752 needed to flip bullish#FedWatch #EarningsSeason #USMidtermElections #BrazilCryptoExchangesMustApplyForLicensesByFriday
{spot}(BNBUSDT)
$BNB — $743.94 down -1.10% in a bearish-neutral consolidation after rejecting $761, with $743.2 immediate support and $752 needed to flip bullish#FedWatch #EarningsSeason #USMidtermElections #BrazilCryptoExchangesMustApplyForLicensesByFriday
90
·
--
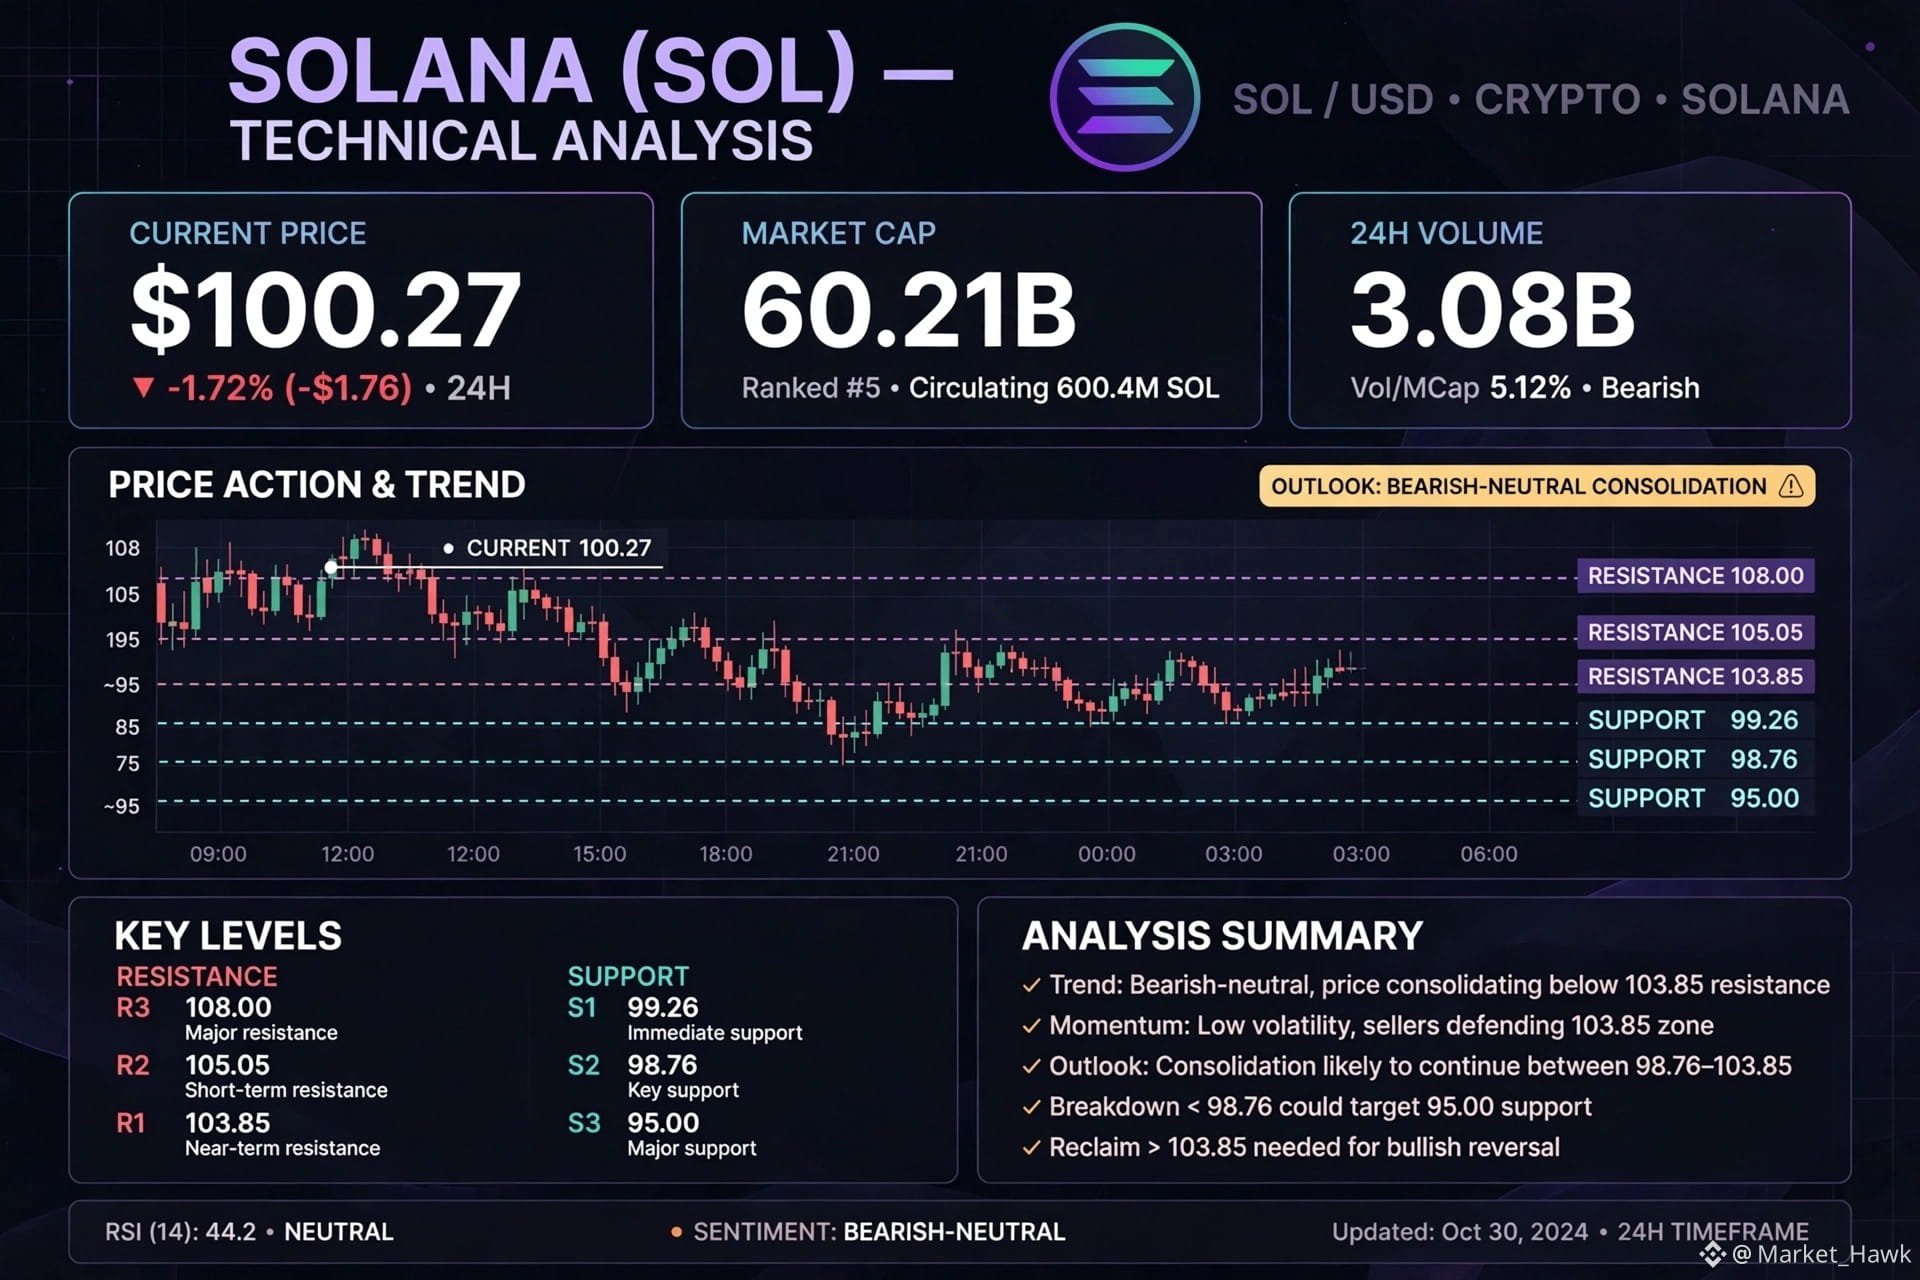
$SOL — holding the $100.27 level in bearish-neutral consolidation, with $99.26 support critical and $103.85 as the next reclaim target#FedWatch #EarningsSeason #USMidtermElections #BrazilCryptoExchangesMustApplyForLicensesByFriday
{spot}(SOLUSDT)
$SOL — holding the $100.27 level in bearish-neutral consolidation, with $99.26 support critical and $103.85 as the next reclaim target#FedWatch #EarningsSeason #USMidtermElections #BrazilCryptoExchangesMustApplyForLicensesByFriday
87
·
--
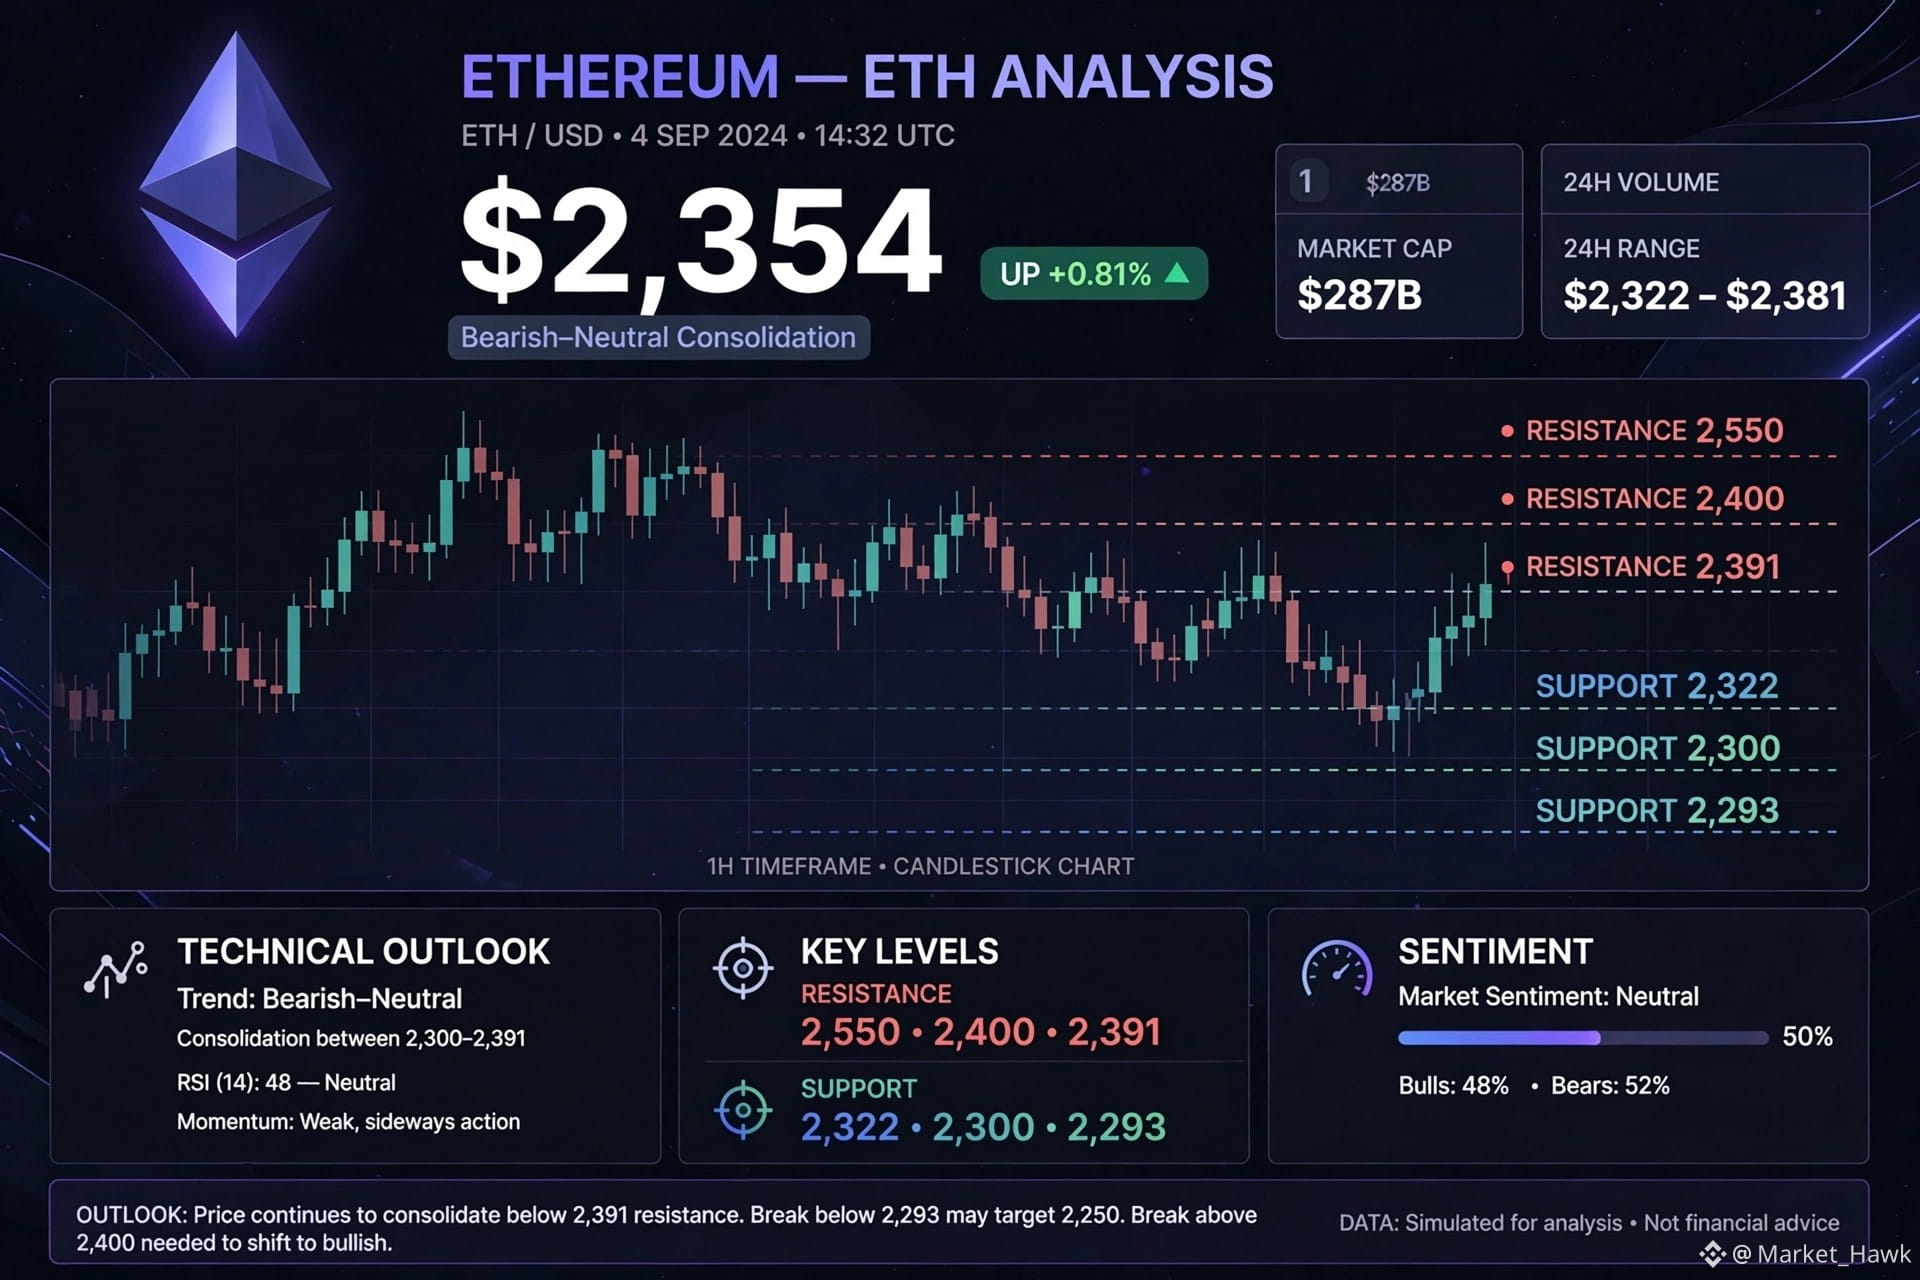
$ETH — $2,354 up +0.81%, in bearish-neutral consolidation between $2,322 support and $2,391 resistance, needing $2,400 break to flip bullish#FedWatch #EarningsSeason #USMidtermElections #BrazilCryptoExchangesMustApplyForLicensesByFriday
{spot}(ETHUSDT)
$ETH — $2,354 up +0.81%, in bearish-neutral consolidation between $2,322 support and $2,391 resistance, needing $2,400 break to flip bullish#FedWatch #EarningsSeason #USMidtermElections #BrazilCryptoExchangesMustApplyForLicensesByFriday
82
·
--
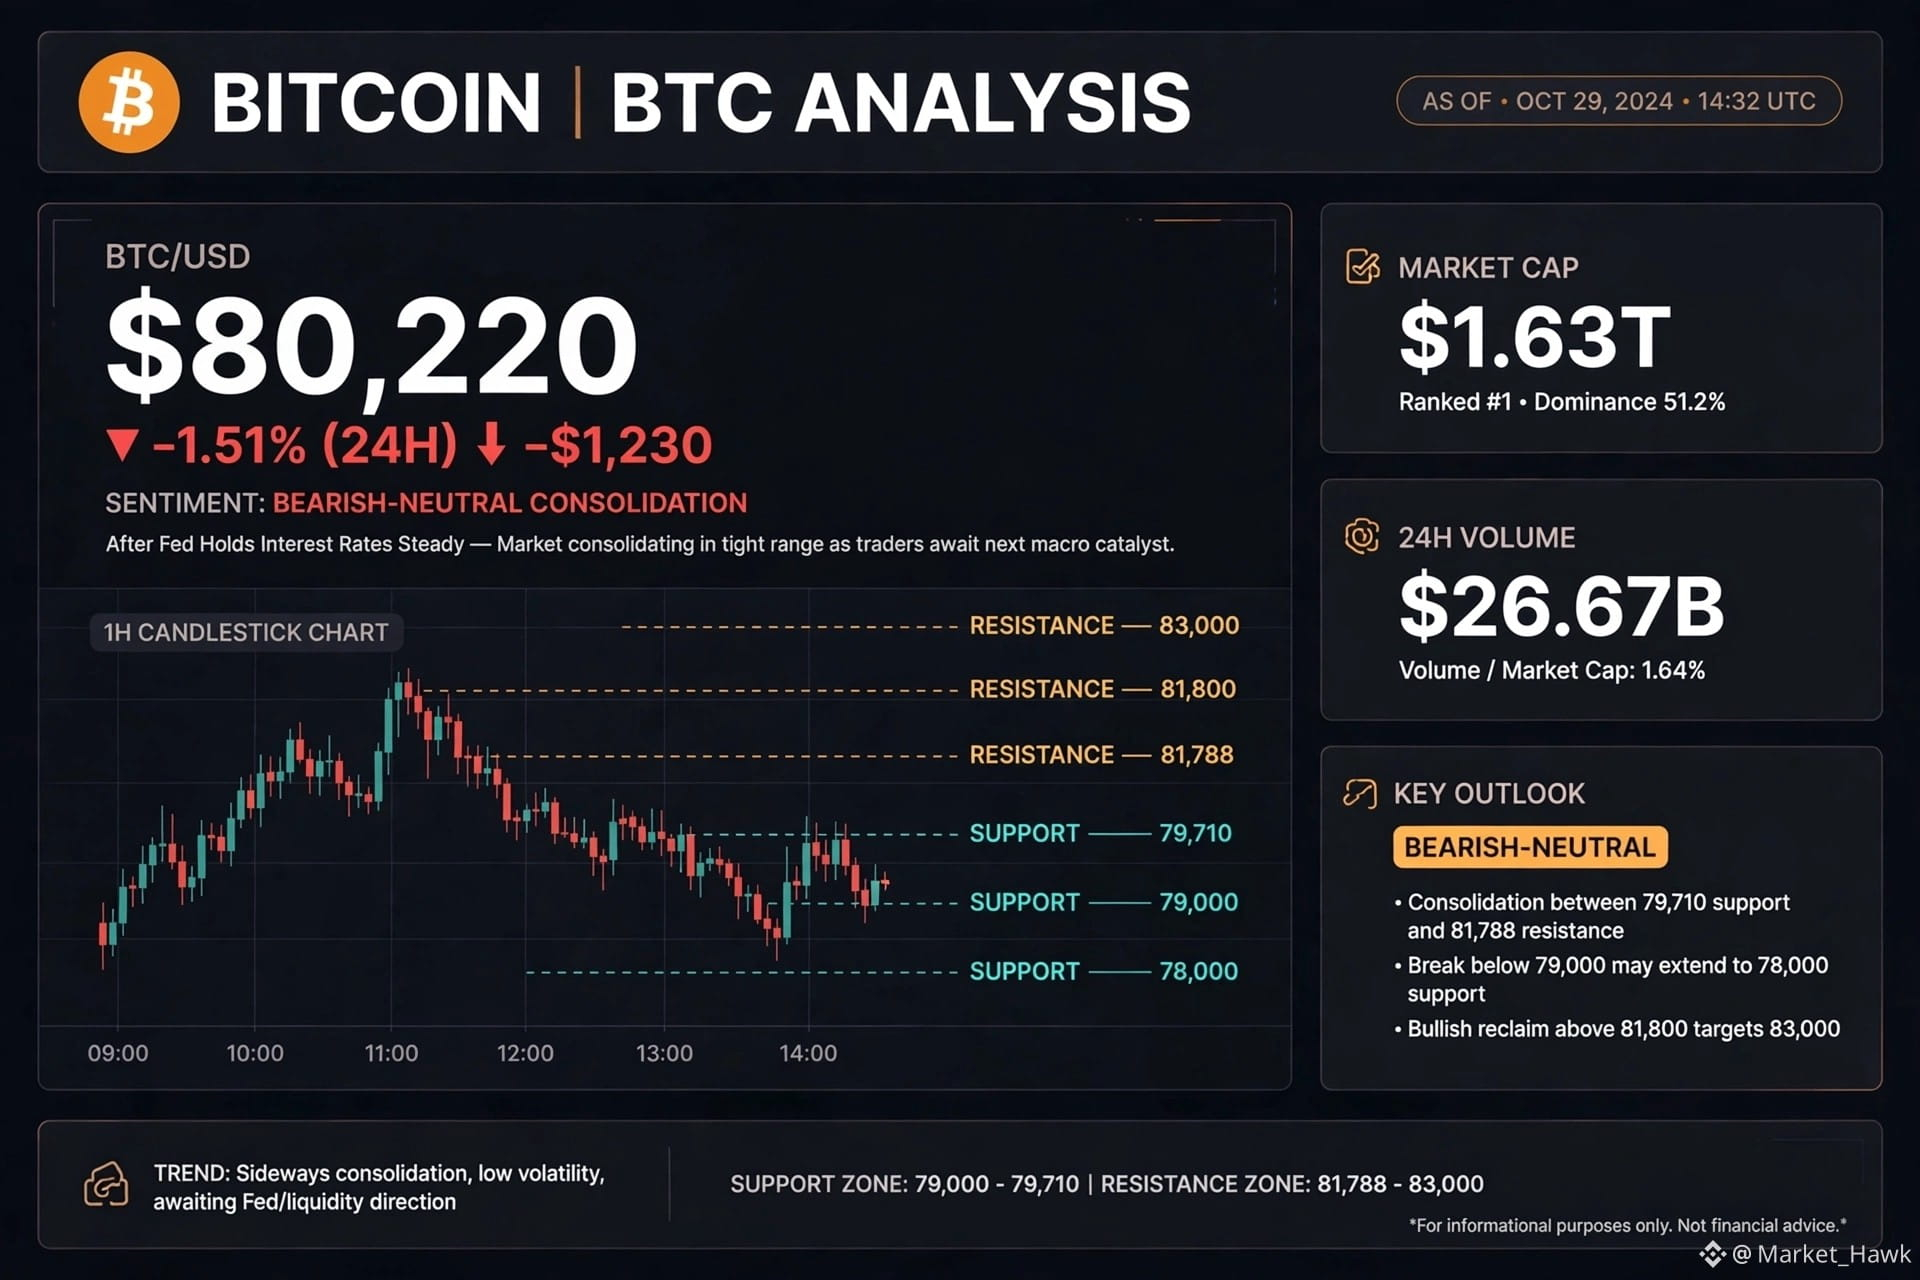
$BTC is at $80,220 down -1.51% after the Fed's hawkish hold at 3.75%-4%, consolidating between $79,710 support and $81,788-$81,800 resistance with $26.67B volume#CanMicrosoftDeliverOnAI #CanGoogleDefindItsCore #FedWatch #BitcoinCore32.1RaisesPeerConnectionLimit
{spot}(BTCUSDT)
$BTC is at $80,220 down -1.51% after the Fed's hawkish hold at 3.75%-4%, consolidating between $79,710 support and $81,788-$81,800 resistance with $26.67B volume#CanMicrosoftDeliverOnAI #CanGoogleDefindItsCore #FedWatch #BitcoinCore32.1RaisesPeerConnectionLimit
117
·
--
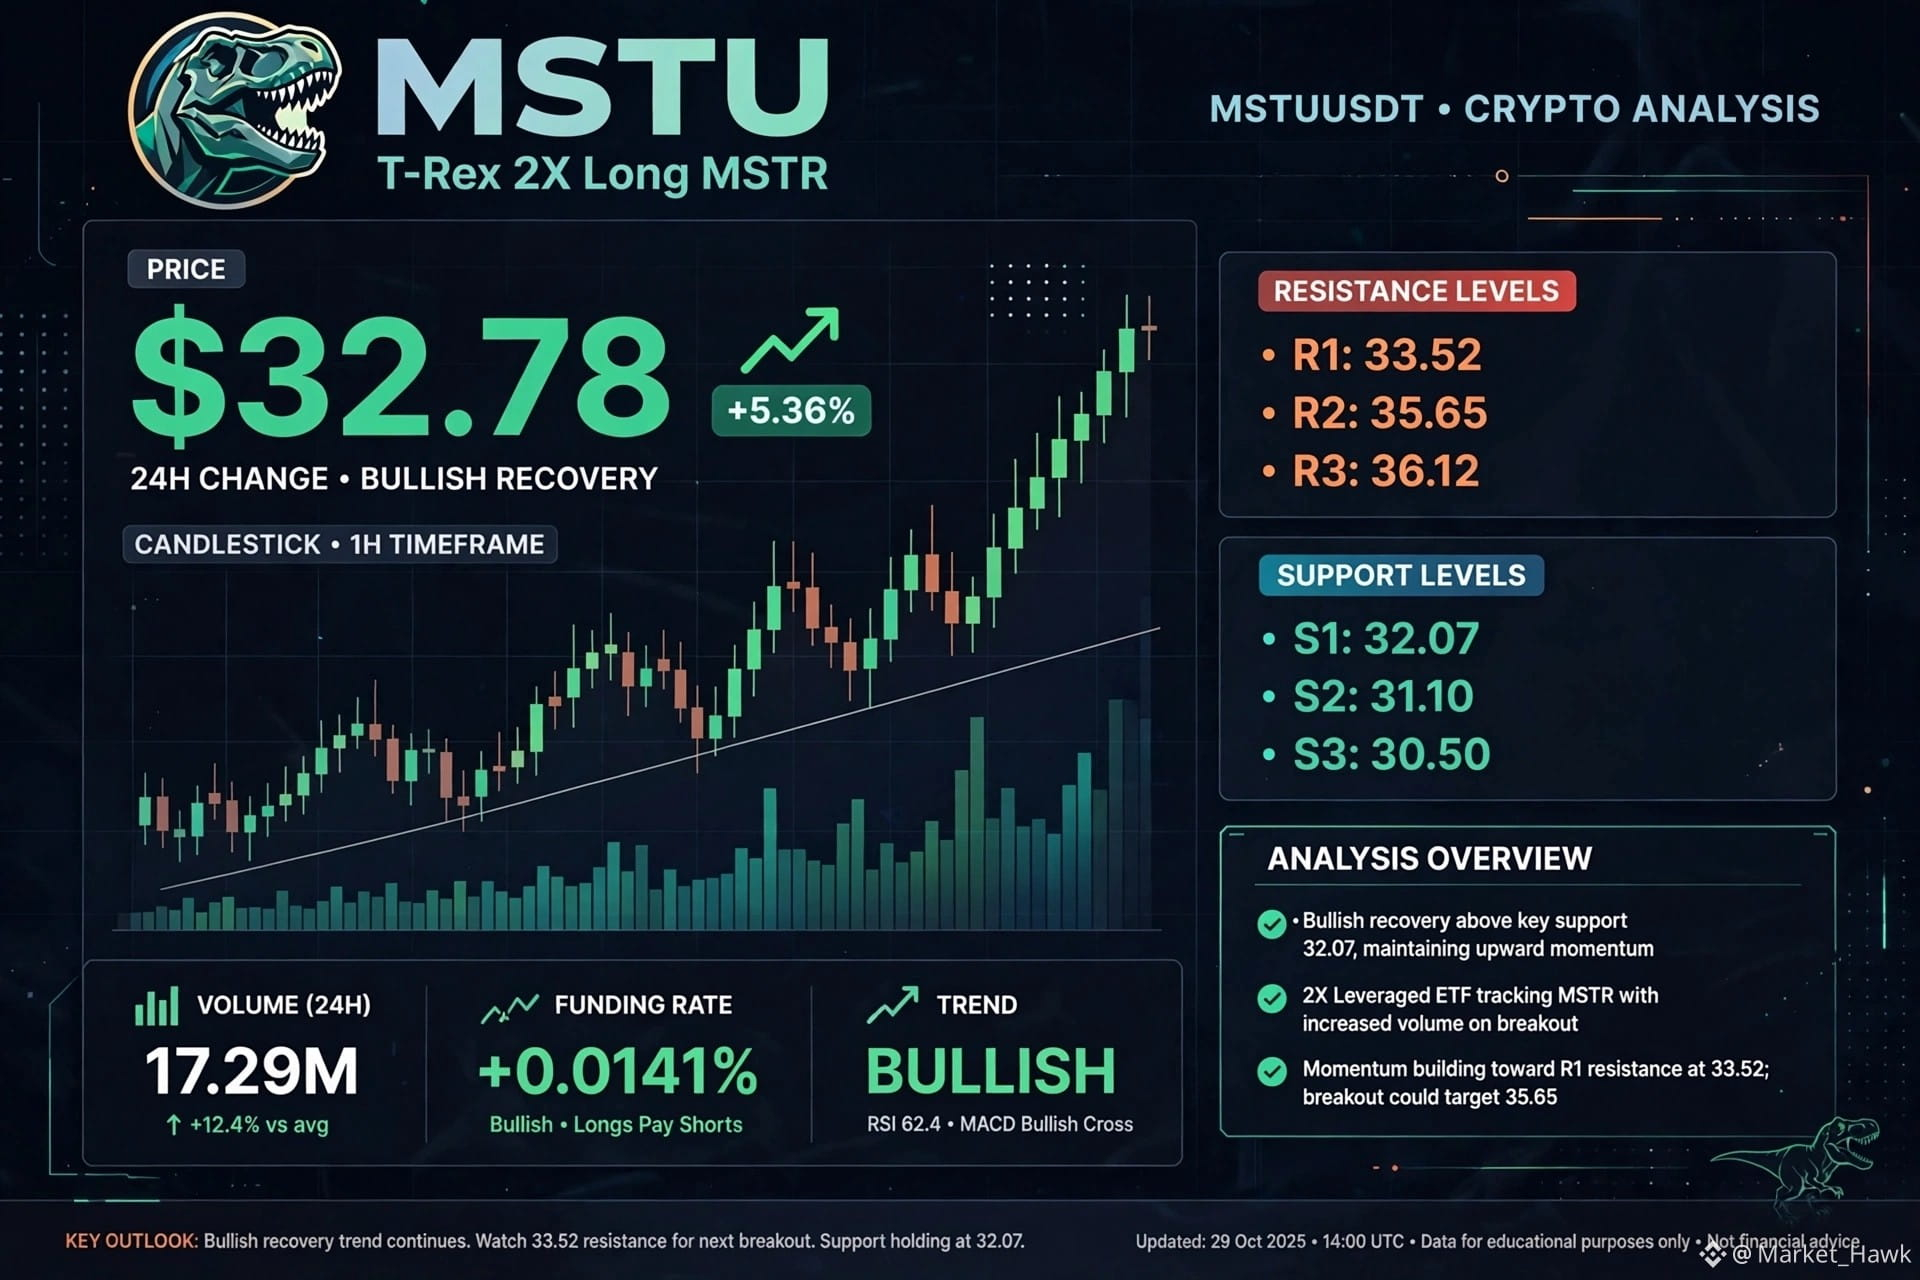
$MSTU analysis — $32.78 up +5.36% in a bullish recovery with volume spike $17.29M and longs paying shorts, breaking toward R1 $33.52
#CanMicrosoftDeliverOnAI #CanGoogleDefindItsCore #EarningsSeason #ThailandSupremeCourtRulesBitcoinIsProperty
{future}(MSTUUSDT)
$MSTU analysis — $32.78 up +5.36% in a bullish recovery with volume spike $17.29M and longs paying shorts, breaking toward R1 $33.52
#CanMicrosoftDeliverOnAI #CanGoogleDefindItsCore #EarningsSeason #ThailandSupremeCourtRulesBitcoinIsProperty
#CanMicrosoftDeliverOnAI #CanGoogleDefindItsCore #EarningsSeason #ThailandSupremeCourtRulesBitcoinIsProperty
188
·
--
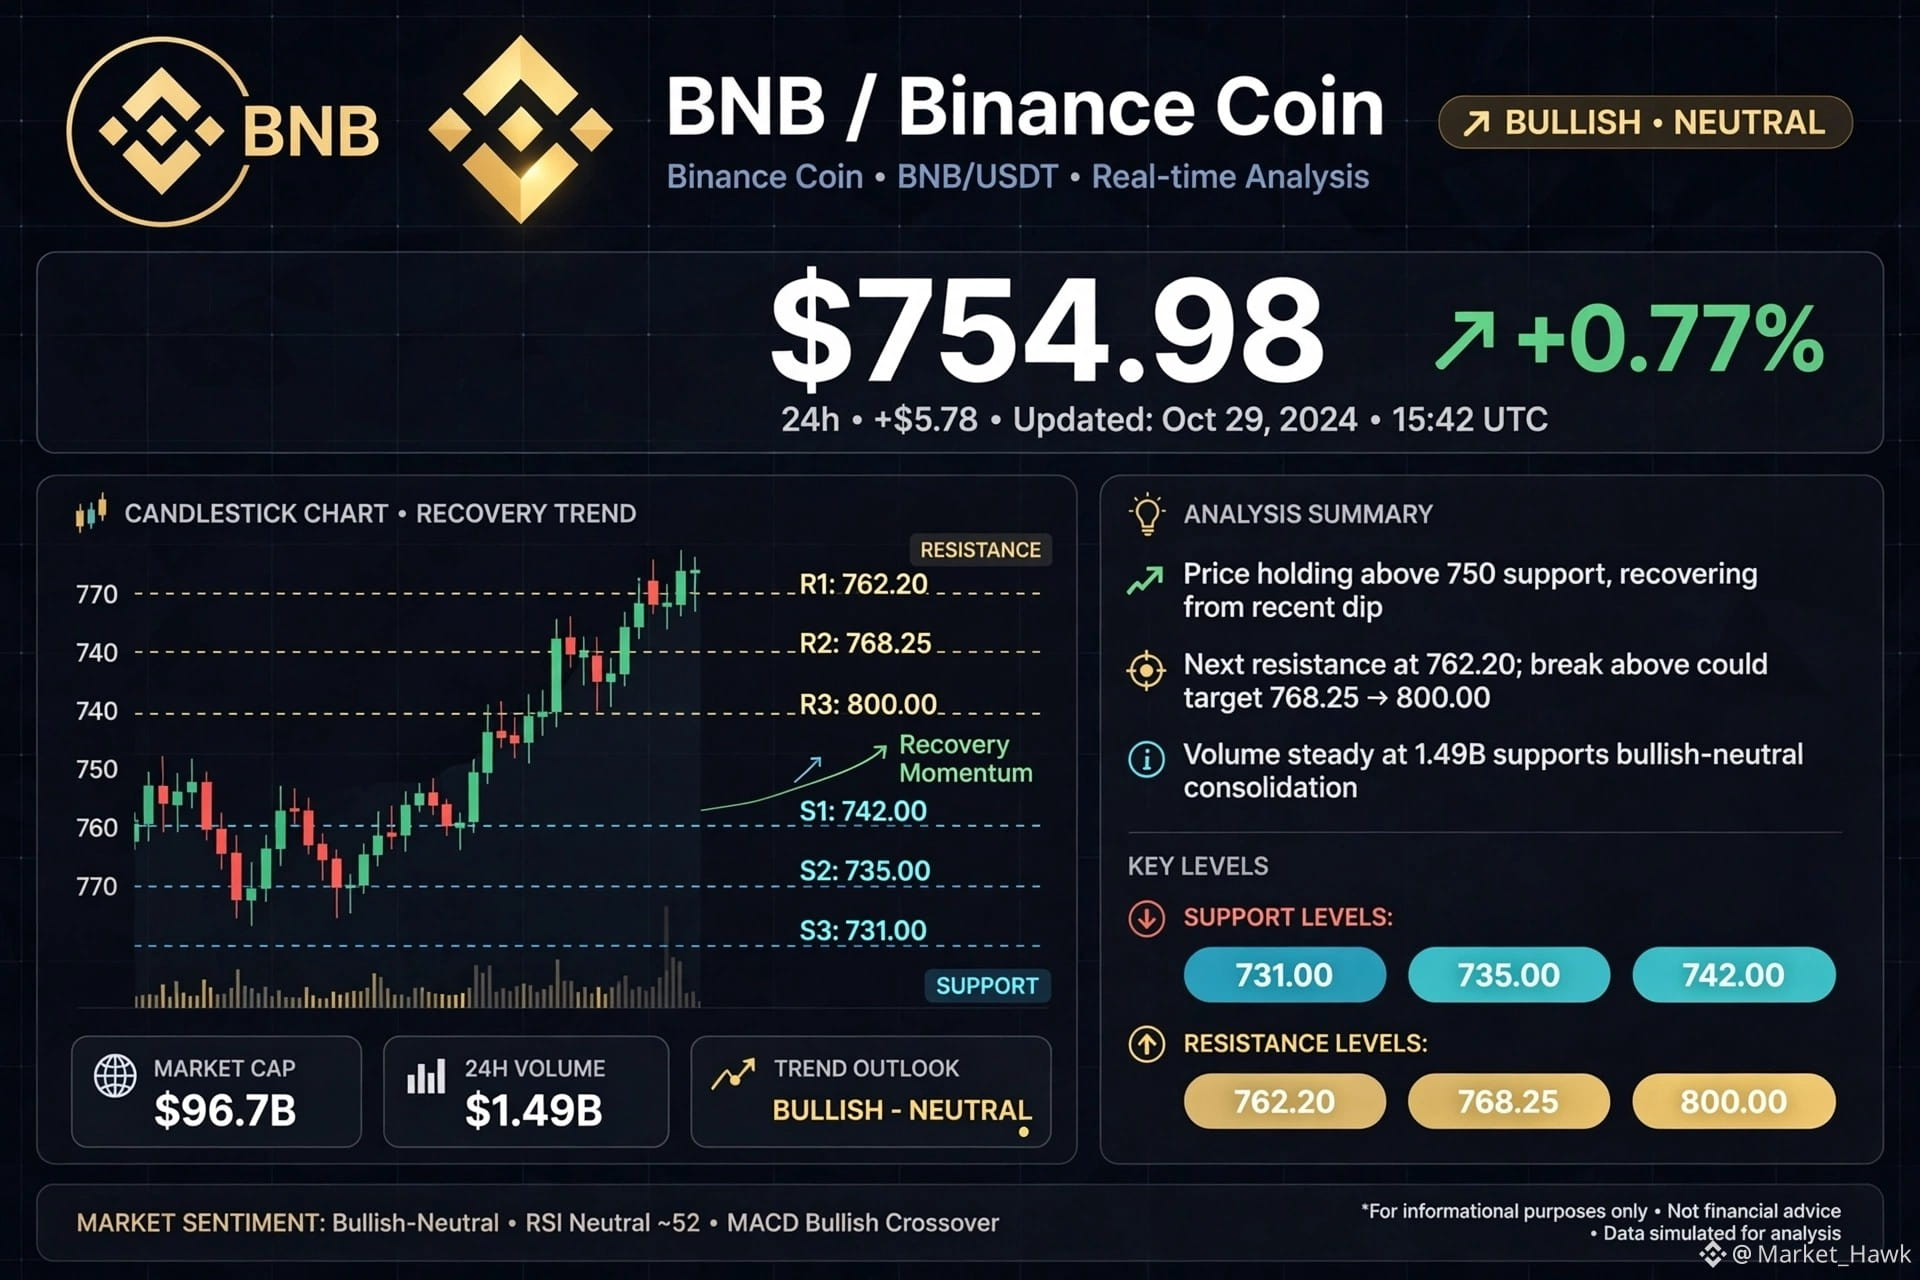
$BNB analysis — holding $754.98 up +0.77% with bullish-neutral momentum above $749 support, eyeing $762.20 resistance next#CanMicrosoftDeliverOnAI #CanGoogleDefindItsCore #EarningsSeason #ThailandSupremeCourtRulesBitcoinIsProperty
{spot}(BNBUSDT)
$BNB analysis — holding $754.98 up +0.77% with bullish-neutral momentum above $749 support, eyeing $762.20 resistance next#CanMicrosoftDeliverOnAI #CanGoogleDefindItsCore #EarningsSeason #ThailandSupremeCourtRulesBitcoinIsProperty
43
·
--
$SOL
Price & Momentum: SOL has fallen roughly 14% over the past month, testing psychological support near the $100 threshold.
Key Levels to Watch:
Support: $98.50 – $100.00 remains crucial for buyers to defend.
Resistance: Reclaiming the 20-day and 50-day moving averages around $106 – $110 is required to confirm a short-term trend reversal.
On-Chain & Macro Drivers: On-chain Decentralized Exchange (DEX) volumes have experienced a temporary dip, and institutional ETF flows have slowed alongside broader macroeconomic uncertainties. However, developer activity and long-term ecosystem upgrades continue to provide fundamental support#CanMicrosoftDeliverOnAI #CanGoogleDefindItsCore #EarningsSeason #ThailandSupremeCourtRulesBitcoinIsProperty
{spot}(SOLUSDT)
$SOL
Price & Momentum: SOL has fallen roughly 14% over the past month, testing psychological support near the $100 threshold.
Key Levels to Watch:
Support: $98.50 – $100.00 remains crucial for buyers to defend.
Resistance: Reclaiming the 20-day and 50-day moving averages around $106 – $110 is required to confirm a short-term trend reversal.
On-Chain & Macro Drivers: On-chain Decentralized Exchange (DEX) volumes have experienced a temporary dip, and institutional ETF flows have slowed alongside broader macroeconomic uncertainties. However, developer activity and long-term ecosystem upgrades continue to provide fundamental support#CanMicrosoftDeliverOnAI #CanGoogleDefindItsCore #EarningsSeason #ThailandSupremeCourtRulesBitcoinIsProperty

53
·
--
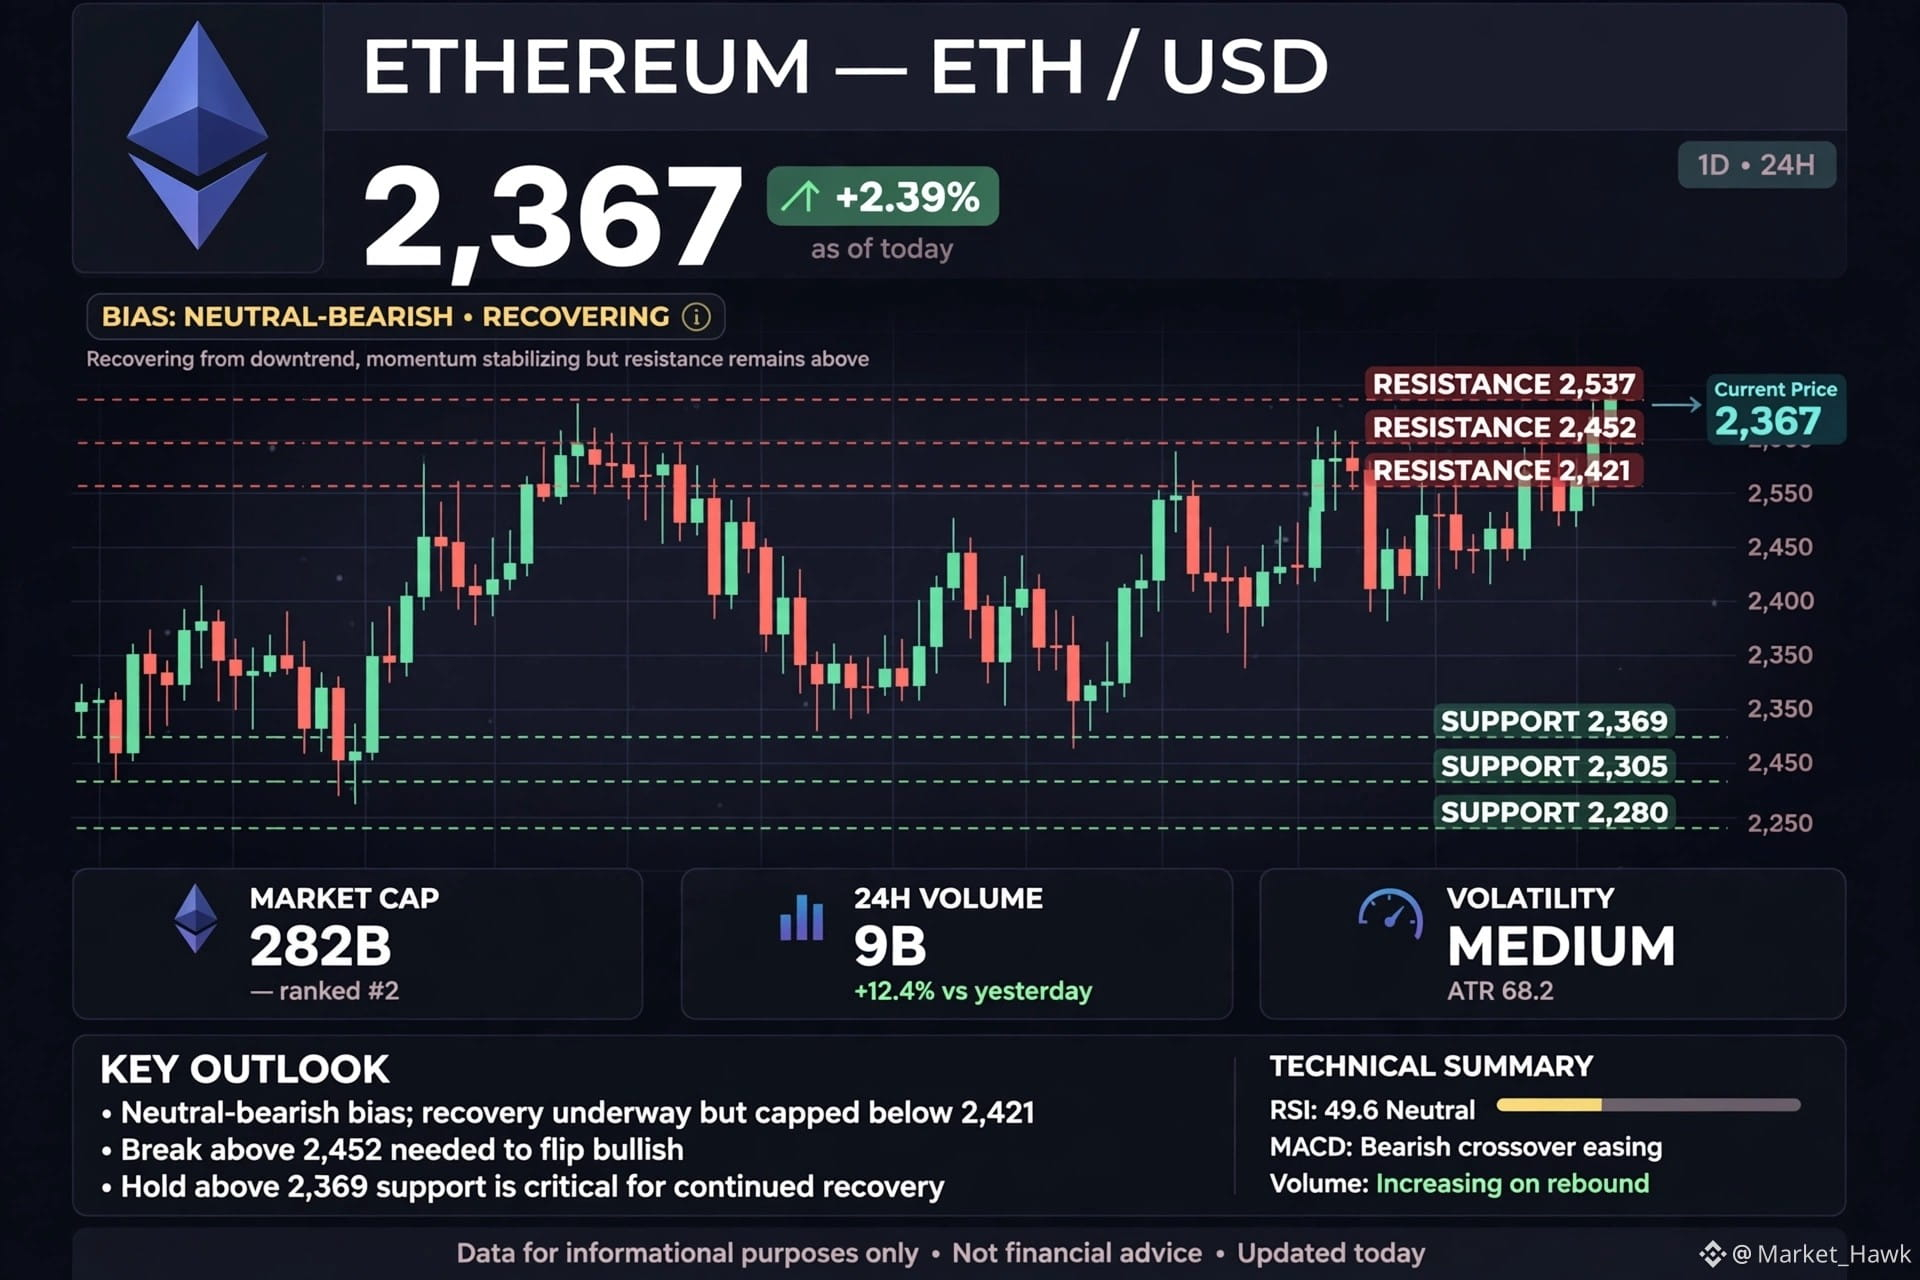
$ETH currently $2,367 up +2.39%, recovering after holding the $2,305 support zone. Price needs to break $2,421 and $2,452 to flip bullish, with $2,369 as the must-hold level below#CanMicrosoftDeliverOnAI #CanGoogleDefindItsCore #EarningsSeason #RobinhoodFalls8.4%AfterItsResults
{spot}(ETHUSDT)
$ETH currently $2,367 up +2.39%, recovering after holding the $2,305 support zone. Price needs to break $2,421 and $2,452 to flip bullish, with $2,369 as the must-hold level below#CanMicrosoftDeliverOnAI #CanGoogleDefindItsCore #EarningsSeason #RobinhoodFalls8.4%AfterItsResults
71
·
--
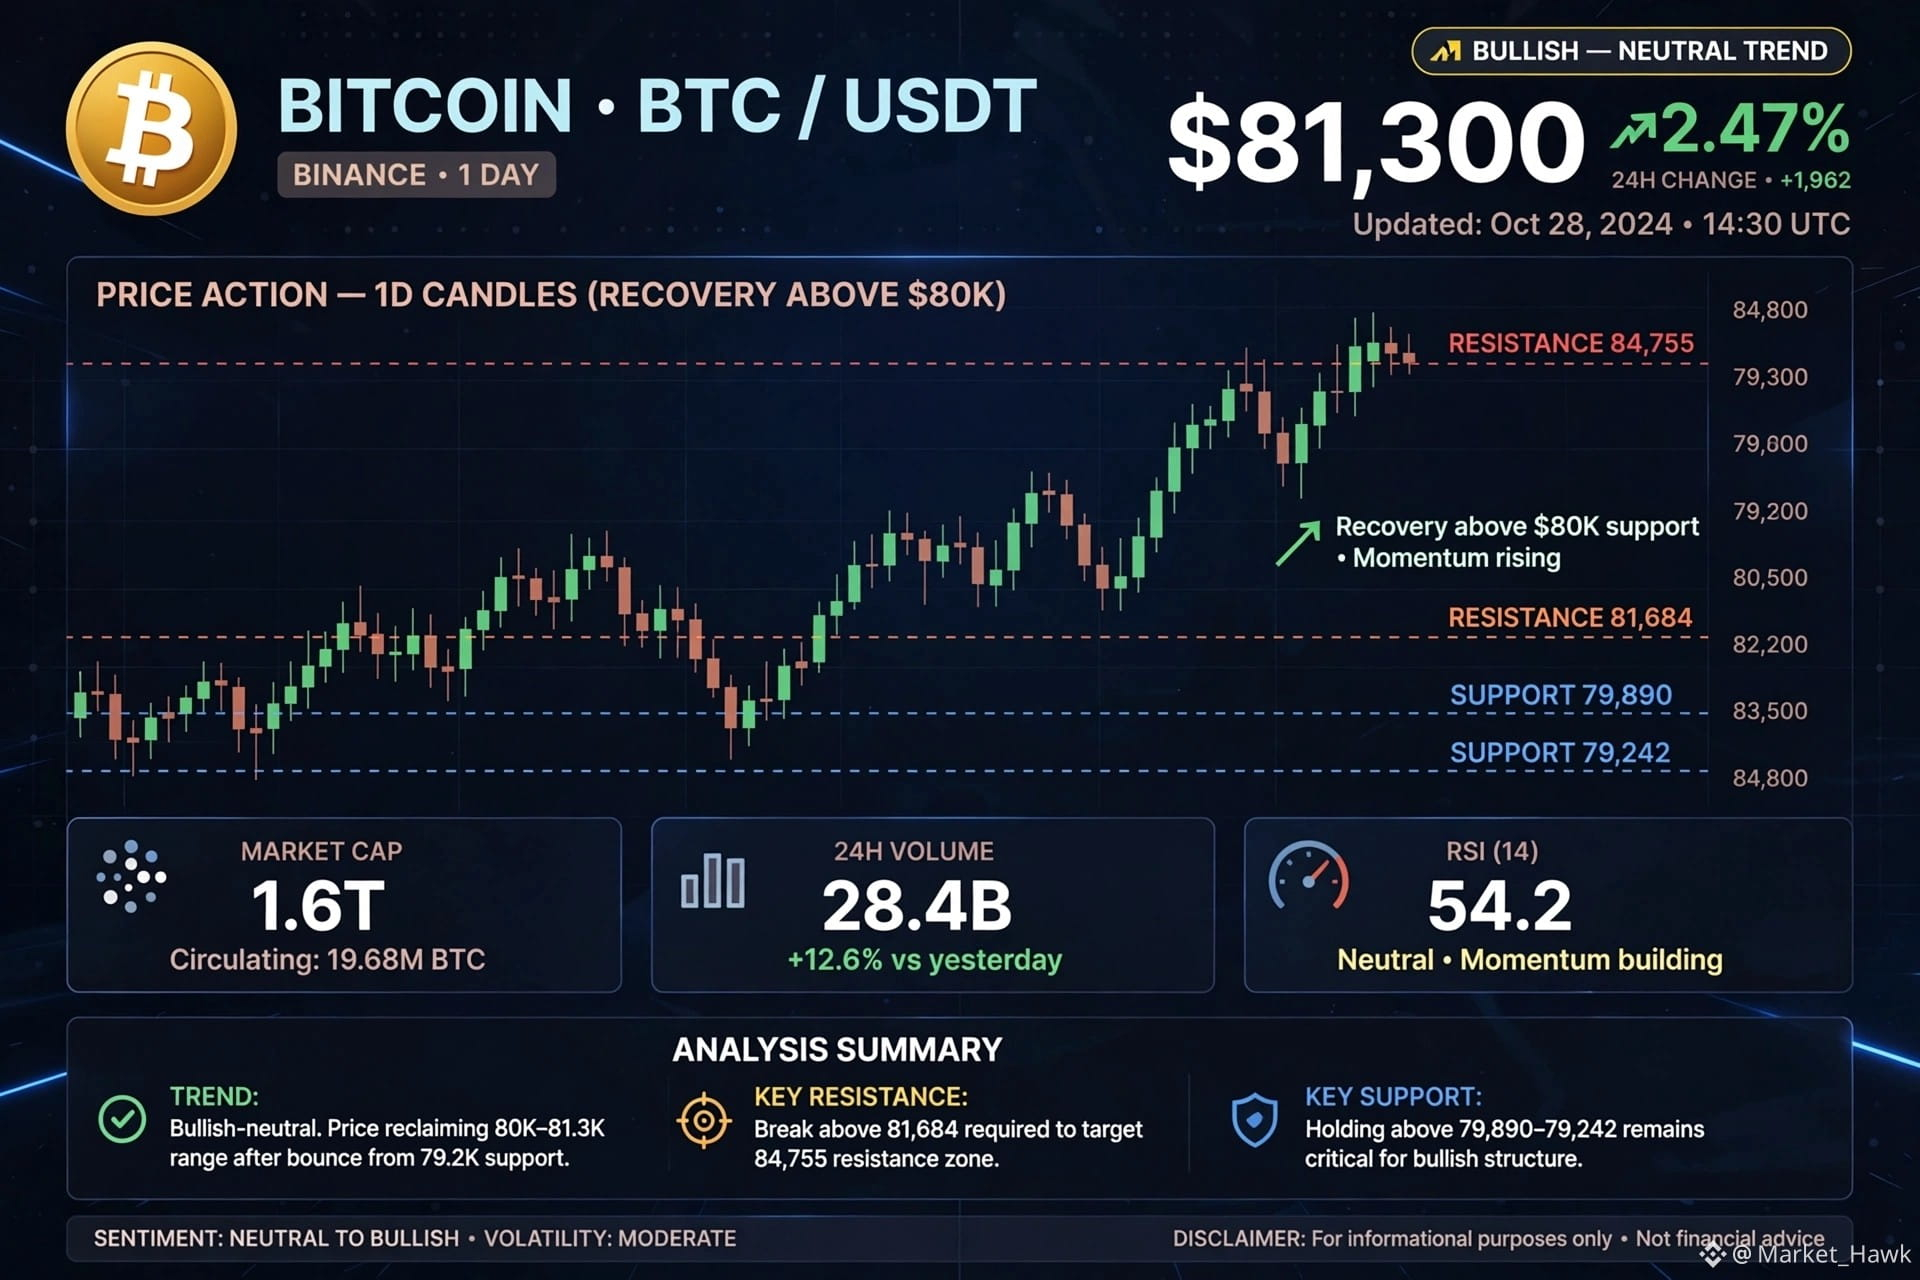
$BTC is holding $81.3k today up +2.47% — clean bounce back above $80k after dipping to $79.2k. The chart shows recovery momentum building with $81,684 as the next resistance and $84,755 above it#CanMicrosoftDeliverOnAI #CanGoogleDefindItsCore #EarningsSeason #RobinhoodFalls8.4%AfterItsResults
{spot}(BTCUSDT)
$BTC is holding $81.3k today up +2.47% — clean bounce back above $80k after dipping to $79.2k. The chart shows recovery momentum building with $81,684 as the next resistance and $84,755 above it#CanMicrosoftDeliverOnAI #CanGoogleDefindItsCore #EarningsSeason #RobinhoodFalls8.4%AfterItsResults
88
·
--
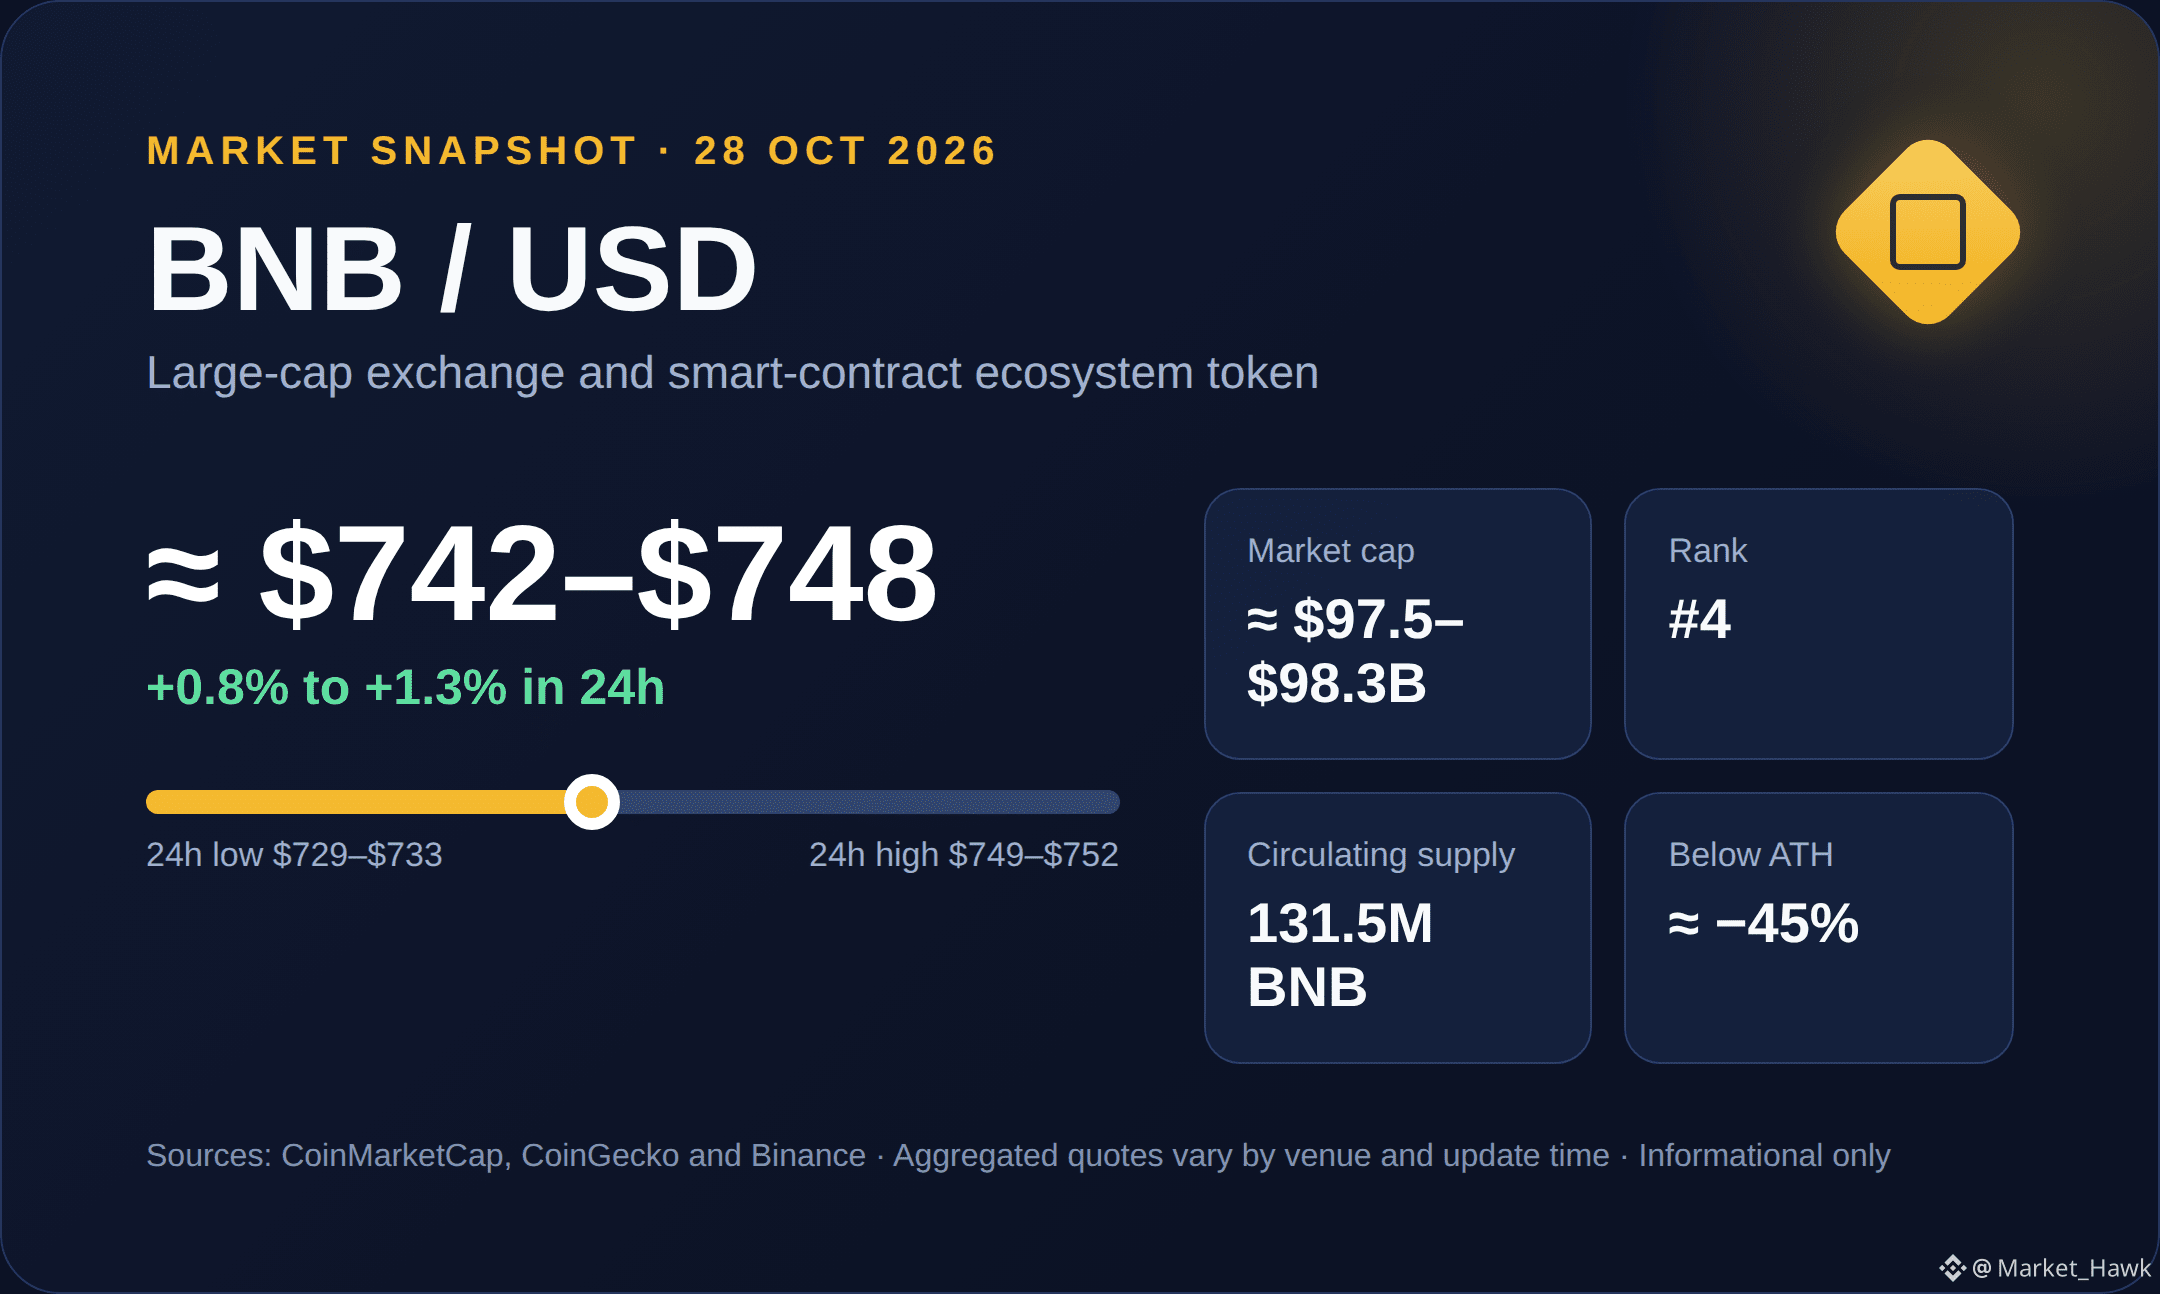
$BNB is trading around **$742–$748**, up roughly **0.8%–1.3% over 24 hours** and about **2.9% over seven days**. Its market capitalization is approximately **$97.5–$98.3 billion**, ranking it **#4** among cryptocurrencies. Quotes vary slightly by exchange and update time.
The short-term picture is **mildly constructive**, but momentum should be treated cautiously near the **$750–$752** area, the recent 24-hour high. BNB remains about **45% below its October 2025 all-time high**, so it has not fully recovered its previous peak. Its main fundamental supports are continued use across BNB Chain, opBNB and Greenfield, along with the Auto-Burn mechanism designed to reduce supply toward 100 million BNB.
The main risks are broad crypto-market weakness, regulatory or Binance-related developments, and security issues in the surrounding ecosystem. Overall, BNB currently has a **positive short-term bias but high volatility and significant downside risk#CanMicrosoftDeliverOnAI #CanGoogleDefindItsCore #FOMCWatch #ThailandLaunchesWORPTStablecoinToQRPaymentApp
{spot}(BNBUSDT)
$BNB is trading around **$742–$748**, up roughly **0.8%–1.3% over 24 hours** and about **2.9% over seven days**. Its market capitalization is approximately **$97.5–$98.3 billion**, ranking it **#4** among cryptocurrencies. Quotes vary slightly by exchange and update time.
The short-term picture is **mildly constructive**, but momentum should be treated cautiously near the **$750–$752** area, the recent 24-hour high. BNB remains about **45% below its October 2025 all-time high**, so it has not fully recovered its previous peak. Its main fundamental supports are continued use across BNB Chain, opBNB and Greenfield, along with the Auto-Burn mechanism designed to reduce supply toward 100 million BNB.
The main risks are broad crypto-market weakness, regulatory or Binance-related developments, and security issues in the surrounding ecosystem. Overall, BNB currently has a **positive short-term bias but high volatility and significant downside risk#CanMicrosoftDeliverOnAI #CanGoogleDefindItsCore #FOMCWatch #ThailandLaunchesWORPTStablecoinToQRPaymentApp
52
·
--
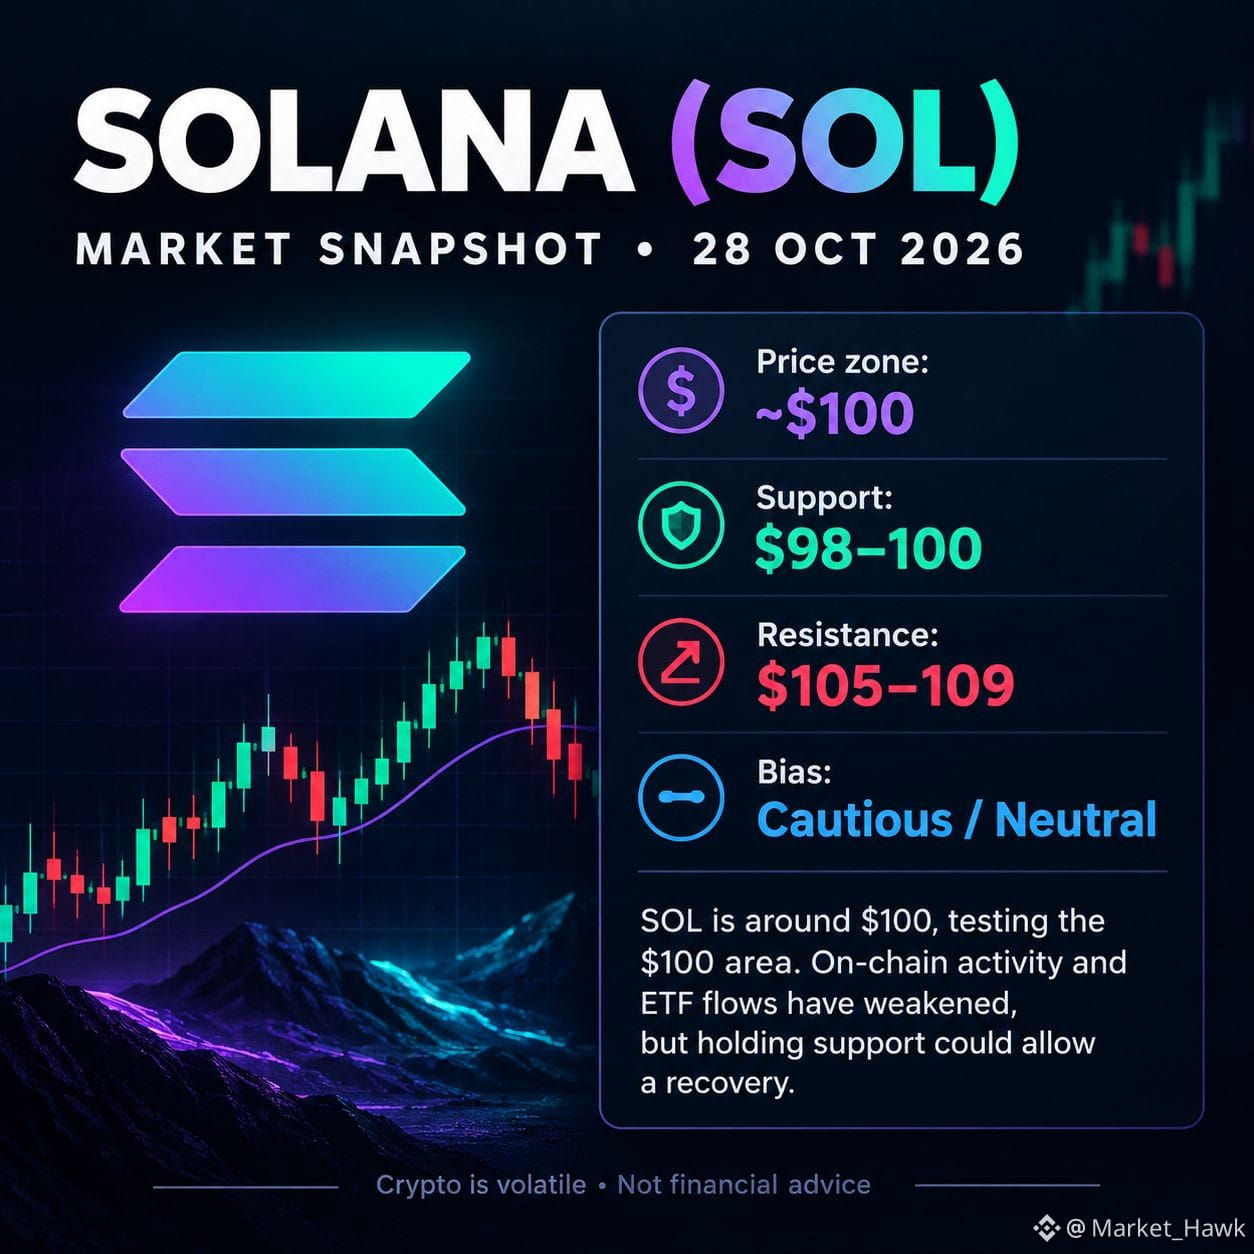
$SOL Short-term outlook: Neutral to bearish unless SOL regains the $105–109 zone. A break below $98 could signal further weakness, while holding support may allow a recovery.
Trading view: Wait for confirmation before entering a trade. Avoid excessive leverage.#CanMicrosoftDeliverOnAI #CanGoogleDefindItsCore #FOMCWatch #ThailandLaunchesWORPTStablecoinToQRPaymentApp
{spot}(SOLUSDT)
$SOL Short-term outlook: Neutral to bearish unless SOL regains the $105–109 zone. A break below $98 could signal further weakness, while holding support may allow a recovery.
Trading view: Wait for confirmation before entering a trade. Avoid excessive leverage.#CanMicrosoftDeliverOnAI #CanGoogleDefindItsCore #FOMCWatch #ThailandLaunchesWORPTStablecoinToQRPaymentApp
Trading view: Wait for confirmation before entering a trade. Avoid excessive leverage.#CanMicrosoftDeliverOnAI #CanGoogleDefindItsCore #FOMCWatch #ThailandLaunchesWORPTStablecoinToQRPaymentApp
87
·
--
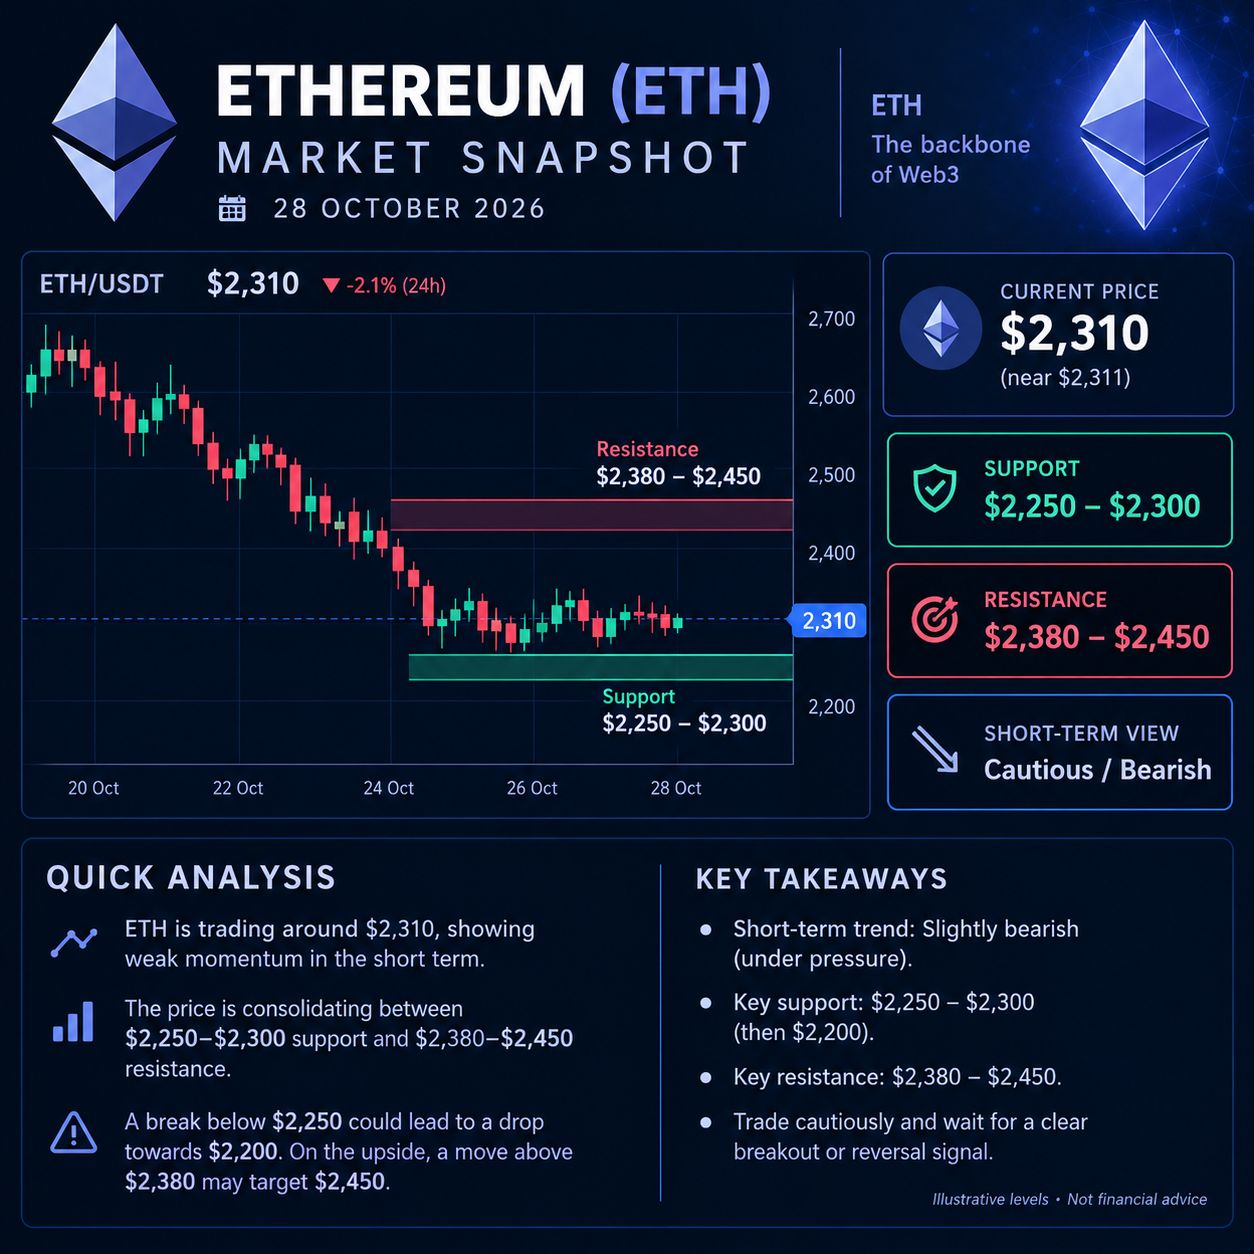
$ETH Current price: Around $2,310–$2,330, based on recent market reports.
Trend: Short-term bearish; selling pressure remains.
Support: $2,250–$2,300.
Resistance: $2,380–$2,450.
Bearish scenario: A confirmed break below $2,250 could expose the $2,200 area.
Bullish scenario: A sustained move above $2,450 could signal a recovery.
Market outlook: Cautious / Bearish until ETH shows stronger buying momentum. The US Federal Reserve decision on October 28 may increase volatility.
Trading reminder: Wait for breakout confirmation and manage risk carefully. These levels are approximate, not guaranteed predictions#CanMicrosoftDeliverOnAI #CanGoogleDefindItsCore #FOMCWatch #ThailandLaunchesWORPTStablecoinToQRPaymentApp
{spot}(ETHUSDT)
$ETH Current price: Around $2,310–$2,330, based on recent market reports.
Trend: Short-term bearish; selling pressure remains.
Support: $2,250–$2,300.
Resistance: $2,380–$2,450.
Bearish scenario: A confirmed break below $2,250 could expose the $2,200 area.
Bullish scenario: A sustained move above $2,450 could signal a recovery.
Market outlook: Cautious / Bearish until ETH shows stronger buying momentum. The US Federal Reserve decision on October 28 may increase volatility.
Trading reminder: Wait for breakout confirmation and manage risk carefully. These levels are approximate, not guaranteed predictions#CanMicrosoftDeliverOnAI #CanGoogleDefindItsCore #FOMCWatch #ThailandLaunchesWORPTStablecoinToQRPaymentApp
96
·
--
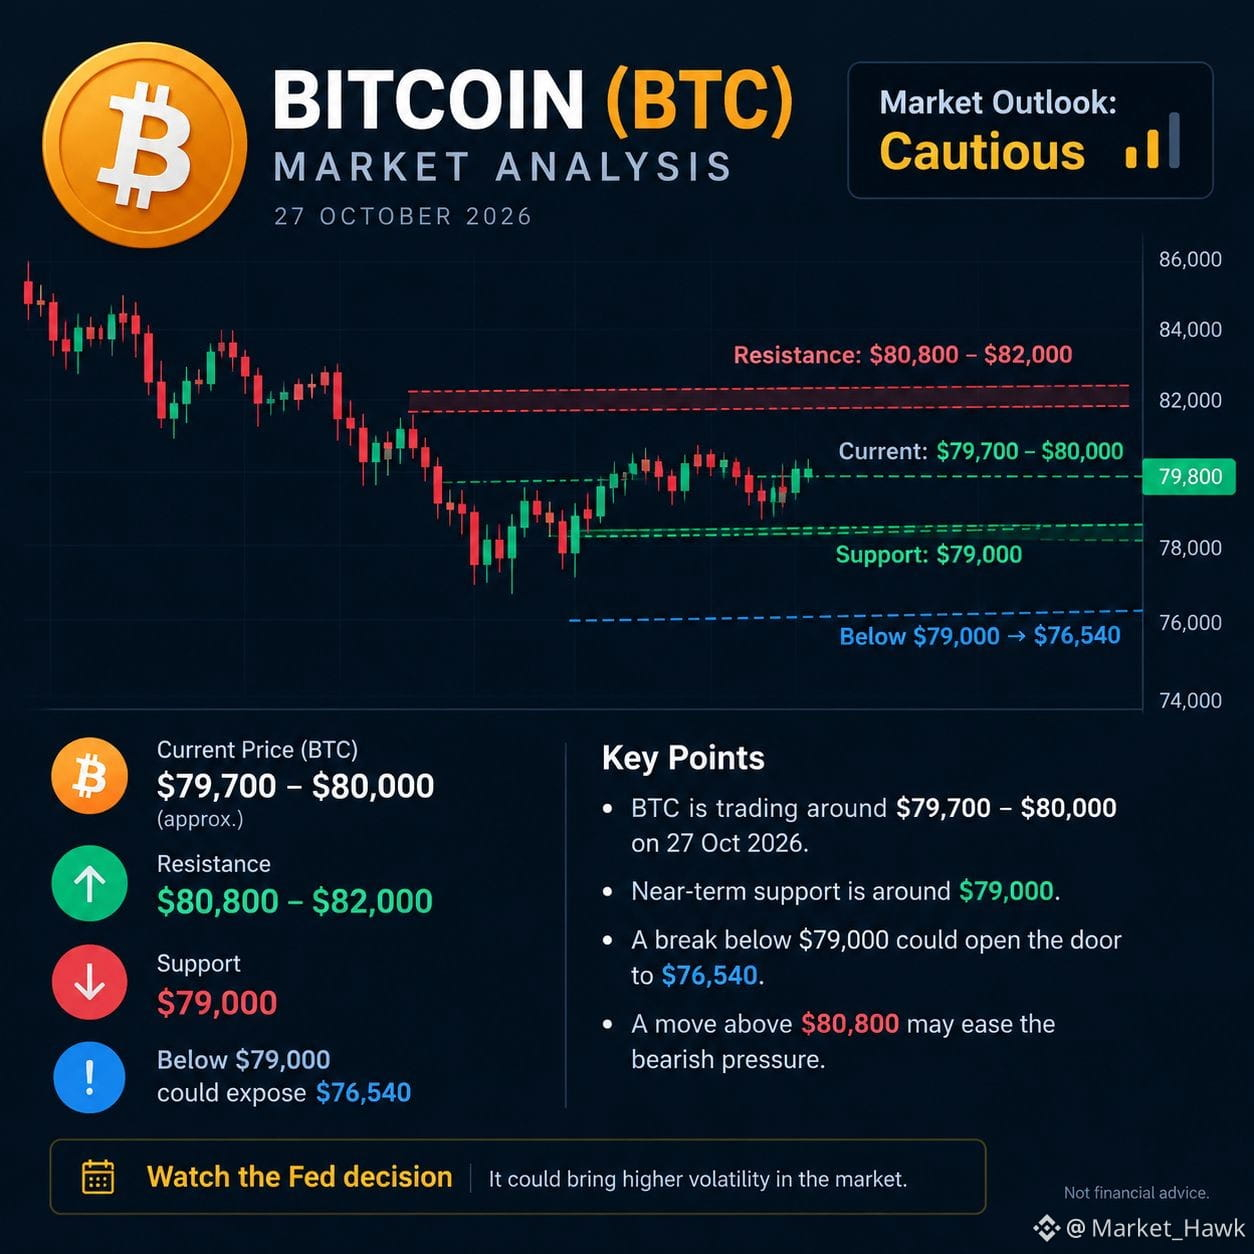
$BTC is facing short-term pressure, with traders watching the $79,000 support level. The upcoming US Federal Reserve decision could trigger sharp price movements.
📊 Technical outlook
Current price: Around $80,661 at the latest chart reading.
Support: $79,000.
Resistance: $80,800–$82,000.
Bullish scenario: A sustained move above $82,000 could improve momentum.
Bearish scenario: A break below $79,000 could expose the $76,540 support zone.
My view: Cautious until BTC confirms a breakout. Watch the Fed announcement and avoid entering trades without confirmation.#CanMicrosoftDeliverOnAI #CanGoogleDefindItsCore #FOMCWatch #ThailandLaunchesWORPTStablecoinToQRPaymentApp
{spot}(BTCUSDT)
$BTC is facing short-term pressure, with traders watching the $79,000 support level. The upcoming US Federal Reserve decision could trigger sharp price movements.
📊 Technical outlook
Current price: Around $80,661 at the latest chart reading.
Support: $79,000.
Resistance: $80,800–$82,000.
Bullish scenario: A sustained move above $82,000 could improve momentum.
Bearish scenario: A break below $79,000 could expose the $76,540 support zone.
My view: Cautious until BTC confirms a breakout. Watch the Fed announcement and avoid entering trades without confirmation.#CanMicrosoftDeliverOnAI #CanGoogleDefindItsCore #FOMCWatch #ThailandLaunchesWORPTStablecoinToQRPaymentApp
95
·
--
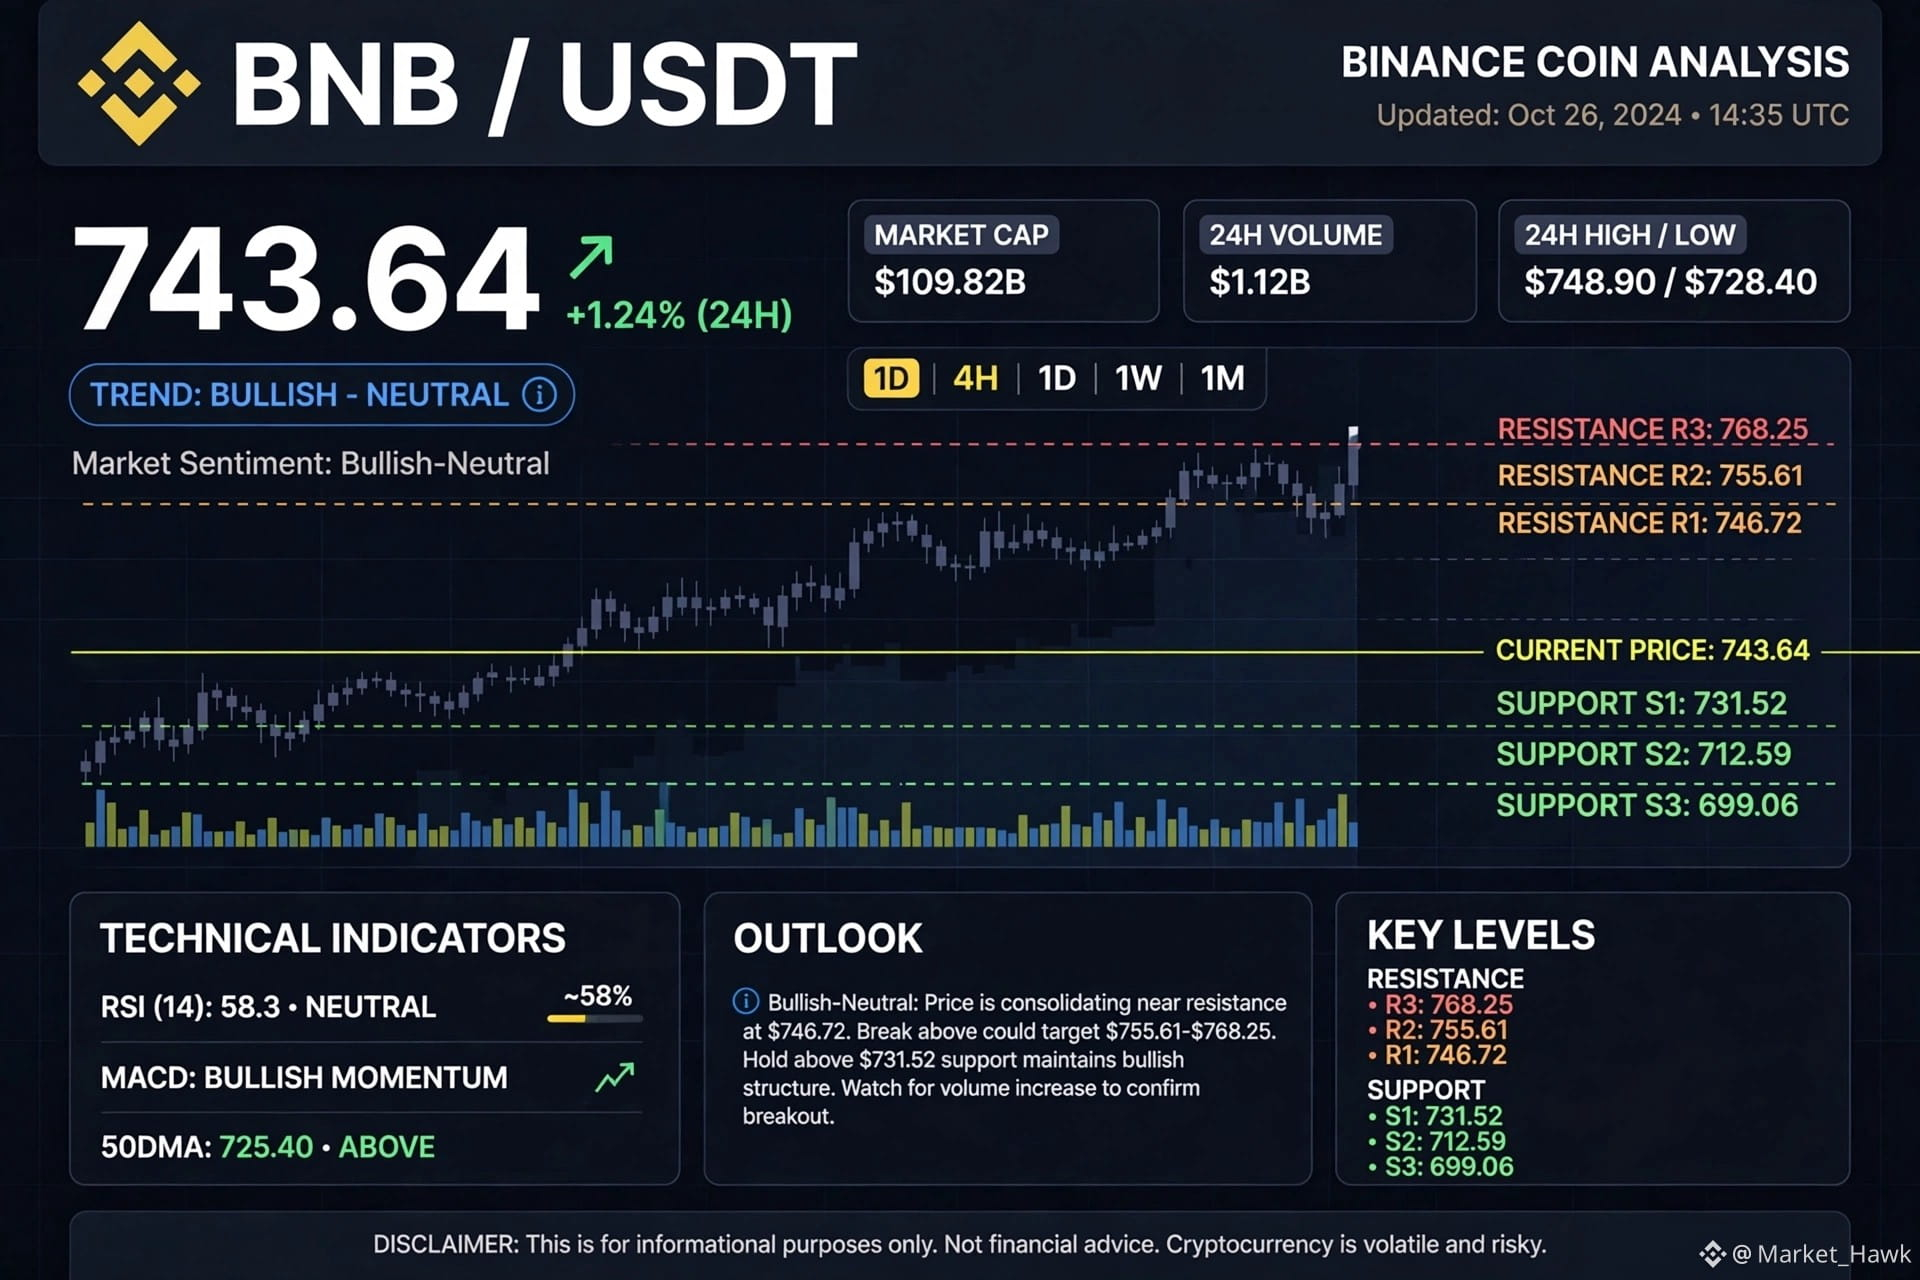
$BNB
*BNB Now: ∼$742 - $750* (+1.7% to +2.5% today)
- *Today:* Open $724.54, High $748.65 / $750.40, Low $723.96 / $739.90
- *Market Cap:* $96.73B - $98.48B, Rank #4, Volume $1.34B-$1.41B
- *ATH distance:* -38% from ∼$1,200 ATH
*Technical Snapshot:*
- *Overall Signal: NEUTRAL 66%* but with bullish tilt
- *Trend:* Ranging, but price *above 7 of 8 MAs*, MA50 > MA200 = Golden Cross (+15.3% spread)
- *Momentum:* RSI 44.3 - 50.4 neutral, MACD negative = buyers returning, not overbought
- *Volatility:* 28% 30d, high today, Volume +0.3σ vs average
- *Fear & Greed:* 54 Neutral
*Key Levels:*
- *Support:* S1 $735 (nearest) / $731.52, S2 $712.59, S3 $699.06
- *Resistance:* R1 $746.72 - $738 immediate, R2 $755.61, R3 $768.25
*Catalysts:*
- *Burn:* 37th quarterly Auto-Burn Oct 19: *1,646,196 BNB burned* permanently
- *Chain activity:* Q3 revenue $54.2M (+54% QoQ), 1.51B txs (+7.5%), fees $49.1M
- *Next:* Jenner testnet activation Oct 28 - CAS20 functions
*Quick Outlook (next 30d):*
- *Bull 30%:* RSI breaks 60 + volume -> $788-$863
- *Base 45%:* Consolidation $714-$788 (most likely)
- *Bear 25%:* MA breakdown + risk-off -> $610-$699
Above $731.5 bias holds bullish to $746.7, break above $746.7 confirms upside. Below $731.5 weakens.#BinancePick #EarningsSeason #AnthropicTTMRevenueGrewAbout1200% #AnthropicS1ExpectedToday
{spot}(BNBUSDT)
$BNB
*BNB Now: ∼$742 - $750* (+1.7% to +2.5% today)
- *Today:* Open $724.54, High $748.65 / $750.40, Low $723.96 / $739.90
- *Market Cap:* $96.73B - $98.48B, Rank #4, Volume $1.34B-$1.41B
- *ATH distance:* -38% from ∼$1,200 ATH
*Technical Snapshot:*
- *Overall Signal: NEUTRAL 66%* but with bullish tilt
- *Trend:* Ranging, but price *above 7 of 8 MAs*, MA50 > MA200 = Golden Cross (+15.3% spread)
- *Momentum:* RSI 44.3 - 50.4 neutral, MACD negative = buyers returning, not overbought
- *Volatility:* 28% 30d, high today, Volume +0.3σ vs average
- *Fear & Greed:* 54 Neutral
*Key Levels:*
- *Support:* S1 $735 (nearest) / $731.52, S2 $712.59, S3 $699.06
- *Resistance:* R1 $746.72 - $738 immediate, R2 $755.61, R3 $768.25
*Catalysts:*
- *Burn:* 37th quarterly Auto-Burn Oct 19: *1,646,196 BNB burned* permanently
- *Chain activity:* Q3 revenue $54.2M (+54% QoQ), 1.51B txs (+7.5%), fees $49.1M
- *Next:* Jenner testnet activation Oct 28 - CAS20 functions
*Quick Outlook (next 30d):*
- *Bull 30%:* RSI breaks 60 + volume -> $788-$863
- *Base 45%:* Consolidation $714-$788 (most likely)
- *Bear 25%:* MA breakdown + risk-off -> $610-$699
Above $731.5 bias holds bullish to $746.7, break above $746.7 confirms upside. Below $731.5 weakens.#BinancePick #EarningsSeason #AnthropicTTMRevenueGrewAbout1200% #AnthropicS1ExpectedToday
40
·
--
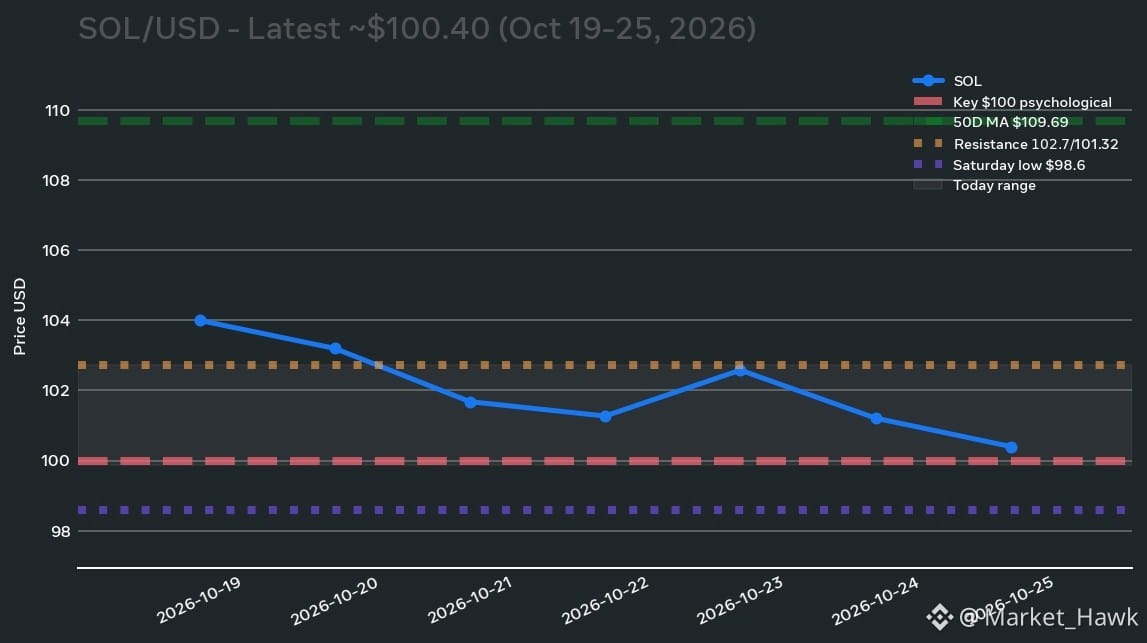
$SOL Solana (SOL) Short Analysis - Oct 25, 2026*
*Price Now:* ~ *$100.40* (-1.34% day)
- *Open:* $101.76 | *High:* $102.73 | *Low:* $99.88 | *Range:* $99.88-102.73
- *Market Cap:* $59.9B (#7), 65.3% below ATH $293.31
- *Weekly:* -3.5% | Monthly -17.3% | Yearly -49.6%
*Why weak today:*
1. *Market-wide liquidation:* BTC fell under $80k, $800M+ longs liquidated Saturday, SOL dipped to *$98.6* intraday - 3rd test of $100 this month, first breach
2. *ETF outflows:* US spot SOL ETFs lost $2.6M Oct 20, $6.7M Oct 19, total ∼$30M in October, 11 straight outflow sessions. Cumulative still $1.55B but trending down
3. *Below MAs:* Trading below 7D, 20D and 50D MA ($109.69) = bearish structure, RSI ∼42 bearish momentum
*The Good News - Network stronger than price:*
- *Alpenglow upgrade live Oct 21* - No outage, finality cut from 12.8 sec to *150ms* - huge for high-frequency trading
- *RWA leader:* $453.5M inflows last week = *73%* of all top-10 chains, JPMorgan launched 2 tokenized money funds on Solana, Samsung enabled USDC on Solana for *82M Galaxy devices*
*Levels to watch:*
- *Support:* $100 psychological (held Oct 13,15,18), then $98.6 low, then $96.50 (100D MA) and $95 zone
- *Resistance:* $101.32 / $102.73 immediate, then $106, reclaim of $106 (50D EMA) would flip to recovery, then $129.70
- *Forecast next 2-3 days:* Range $98.7 - $103.44 expected
*Outlook:* Sell-the-news after Alpenglow + ETF drag, but $100 holding for now. Hold above $98.8 could bounce to $102, break below opens $95-97, especially with Fed meeting Oct 27-28 coming.#BinancePick #EarningsSeason #AnthropicTTMRevenueGrewAbout1200% #AnthropicS1ExpectedToday
{spot}(SOLUSDT)
$SOL Solana (SOL) Short Analysis - Oct 25, 2026*
*Price Now:* ~ *$100.40* (-1.34% day)
- *Open:* $101.76 | *High:* $102.73 | *Low:* $99.88 | *Range:* $99.88-102.73
- *Market Cap:* $59.9B (#7), 65.3% below ATH $293.31
- *Weekly:* -3.5% | Monthly -17.3% | Yearly -49.6%
*Why weak today:*
1. *Market-wide liquidation:* BTC fell under $80k, $800M+ longs liquidated Saturday, SOL dipped to *$98.6* intraday - 3rd test of $100 this month, first breach
2. *ETF outflows:* US spot SOL ETFs lost $2.6M Oct 20, $6.7M Oct 19, total ∼$30M in October, 11 straight outflow sessions. Cumulative still $1.55B but trending down
3. *Below MAs:* Trading below 7D, 20D and 50D MA ($109.69) = bearish structure, RSI ∼42 bearish momentum
*The Good News - Network stronger than price:*
- *Alpenglow upgrade live Oct 21* - No outage, finality cut from 12.8 sec to *150ms* - huge for high-frequency trading
- *RWA leader:* $453.5M inflows last week = *73%* of all top-10 chains, JPMorgan launched 2 tokenized money funds on Solana, Samsung enabled USDC on Solana for *82M Galaxy devices*
*Levels to watch:*
- *Support:* $100 psychological (held Oct 13,15,18), then $98.6 low, then $96.50 (100D MA) and $95 zone
- *Resistance:* $101.32 / $102.73 immediate, then $106, reclaim of $106 (50D EMA) would flip to recovery, then $129.70
- *Forecast next 2-3 days:* Range $98.7 - $103.44 expected
*Outlook:* Sell-the-news after Alpenglow + ETF drag, but $100 holding for now. Hold above $98.8 could bounce to $102, break below opens $95-97, especially with Fed meeting Oct 27-28 coming.#BinancePick #EarningsSeason #AnthropicTTMRevenueGrewAbout1200% #AnthropicS1ExpectedToday
100
·
--
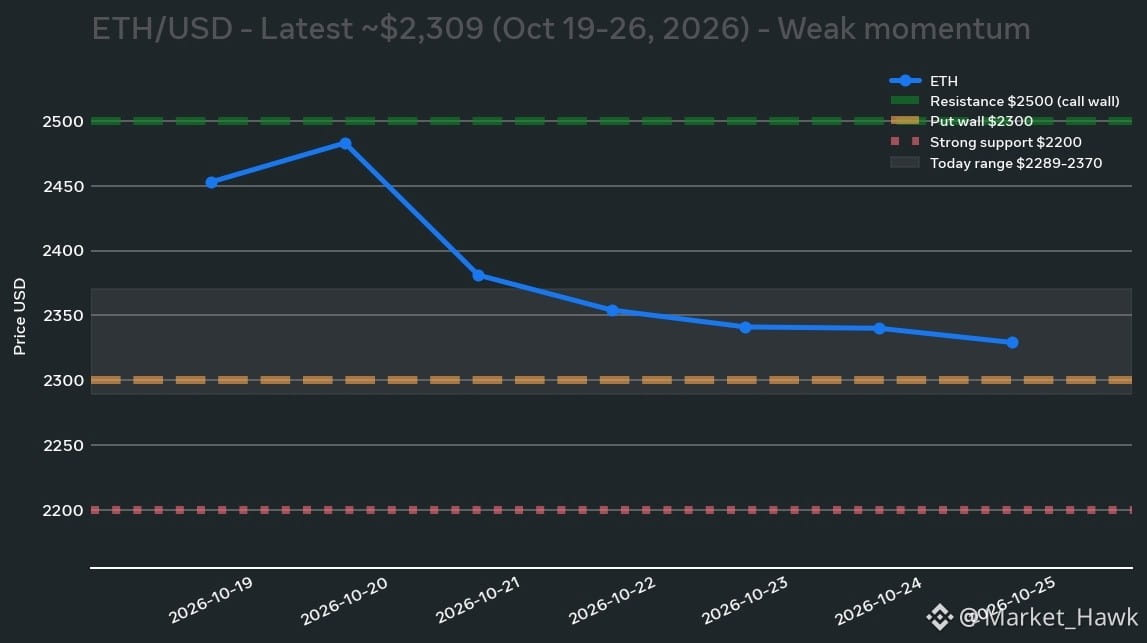
$ETH Ethereum (ETH) Short Analysis - Oct 25, 2026*
*Price Now:* ~ *$2,309.57* (-1.28% day)
- *Open:* $2,339.66 | *High:* $2,349.74 | *Low:* $2,293.09 | *Close:* $2,328.6
- *Range Today:* $2,307 - $2,371, Volume ∼2.05M ETH
- *Market Cap:* $286.42B | -52.5% from ATH $4,946
*What's driving it:*
1. *ETF Outflows:* US spot ETH ETFs lost $220.7M this week, $1.18B in Oct alone. BlackRock ETHA led outflows. Only $4.4M inflow on Friday.
2. *Tech delay:* Glamsterdam upgrade Hoodi testnet postponed again - security issue flagged in EIP-8037 (13 contracts could fail permanently).
3. *Weak on-chain:* Burned <10 ETH in fees in 24h, supply grew +3,000 ETH as activity moves to L2s. ETH/BTC ratio near 0.029 low.
4. *Sentiment:* Fear & Greed Index 31 = Fear (down from 49 neutral last month). 76-81% social sentiment still bullish but traders bearish, spot buyers absent.
*Technicals:*
- *Options walls:* Call wall at $2,500, Put wall at $2,300. Dealer long gamma = moves dampened, range-bound.
- *Key Levels:* Immediate bid wall $2,289, ask wall $2,370. Next strong buyers expected ∼$2,200 (Ted Pillows analysis). Need close above $2,500 to confirm bullish reversal, below $2,300 opens $2,200.
- *Momentum:* Down -3.74% in 5 days, -12.56% in 30 days, -21.5% YTD
*Outlook:* Consolidation / weak. Staking at record 43.8M ETH (35.9% supply) but yield down to 2.63%. Big whale opened $63.88M long at dip (up $842k). If $2,289 holds, bounce to $2,500 possible, if breaks, $2,200 next.#BinancePick #EarningsSeason #AnthropicTTMRevenueGrewAbout1200% #AnthropicS1ExpectedToday
{spot}(ETHUSDT)
$ETH Ethereum (ETH) Short Analysis - Oct 25, 2026*
*Price Now:* ~ *$2,309.57* (-1.28% day)
- *Open:* $2,339.66 | *High:* $2,349.74 | *Low:* $2,293.09 | *Close:* $2,328.6
- *Range Today:* $2,307 - $2,371, Volume ∼2.05M ETH
- *Market Cap:* $286.42B | -52.5% from ATH $4,946
*What's driving it:*
1. *ETF Outflows:* US spot ETH ETFs lost $220.7M this week, $1.18B in Oct alone. BlackRock ETHA led outflows. Only $4.4M inflow on Friday.
2. *Tech delay:* Glamsterdam upgrade Hoodi testnet postponed again - security issue flagged in EIP-8037 (13 contracts could fail permanently).
3. *Weak on-chain:* Burned <10 ETH in fees in 24h, supply grew +3,000 ETH as activity moves to L2s. ETH/BTC ratio near 0.029 low.
4. *Sentiment:* Fear & Greed Index 31 = Fear (down from 49 neutral last month). 76-81% social sentiment still bullish but traders bearish, spot buyers absent.
*Technicals:*
- *Options walls:* Call wall at $2,500, Put wall at $2,300. Dealer long gamma = moves dampened, range-bound.
- *Key Levels:* Immediate bid wall $2,289, ask wall $2,370. Next strong buyers expected ∼$2,200 (Ted Pillows analysis). Need close above $2,500 to confirm bullish reversal, below $2,300 opens $2,200.
- *Momentum:* Down -3.74% in 5 days, -12.56% in 30 days, -21.5% YTD
*Outlook:* Consolidation / weak. Staking at record 43.8M ETH (35.9% supply) but yield down to 2.63%. Big whale opened $63.88M long at dip (up $842k). If $2,289 holds, bounce to $2,500 possible, if breaks, $2,200 next.#BinancePick #EarningsSeason #AnthropicTTMRevenueGrewAbout1200% #AnthropicS1ExpectedToday
80
Войдите, чтобы посмотреть больше материала
Присоединяйтесь к пользователям криптовалют по всему миру на Binance Square
⚡️ Получайте новейшую и полезную информацию о криптоактивах.
💬 Нам доверяет крупнейшая в мире криптобиржа.
👍 Получите достоверные аналитические данные от верифицированных создателей контента.
Эл. почта/номер телефона
В тренде
OpenAICutsFundraisingTargetBy$10B
Просмотров: 13
22 обсуждают
SUI Is Building Fast, but the Price Is Down 64% in a Year. Can $0.90 Hold This Weekend?
Maverick_Alpha
·Лайков: 3
·Просмотров: 857
ASICHasReceivedNoPredictionMarketApplications
Просмотров: 1,489
82 обсуждают
RecallAnnouncesLiquidationPlansToBurn35.86%OfSupply
Просмотров: 149
3 обсуждают