

Shahzad mugheera
1.2k Публикации

Shahzad mugheera
Отправить жалобу
Заблокировать пользователя
Crypto lover 📊 Crypto Market Analyst | 📈 Charts • Trends • Setups🎯 Focused on Discipline, Research & Growth🚀 Learning. Trading. Evolving.
308 подписок(и/а)
4.6K+ подписчиков(а)
621 понравилось
Посты
Все
Цитирования
Активно
PINNED
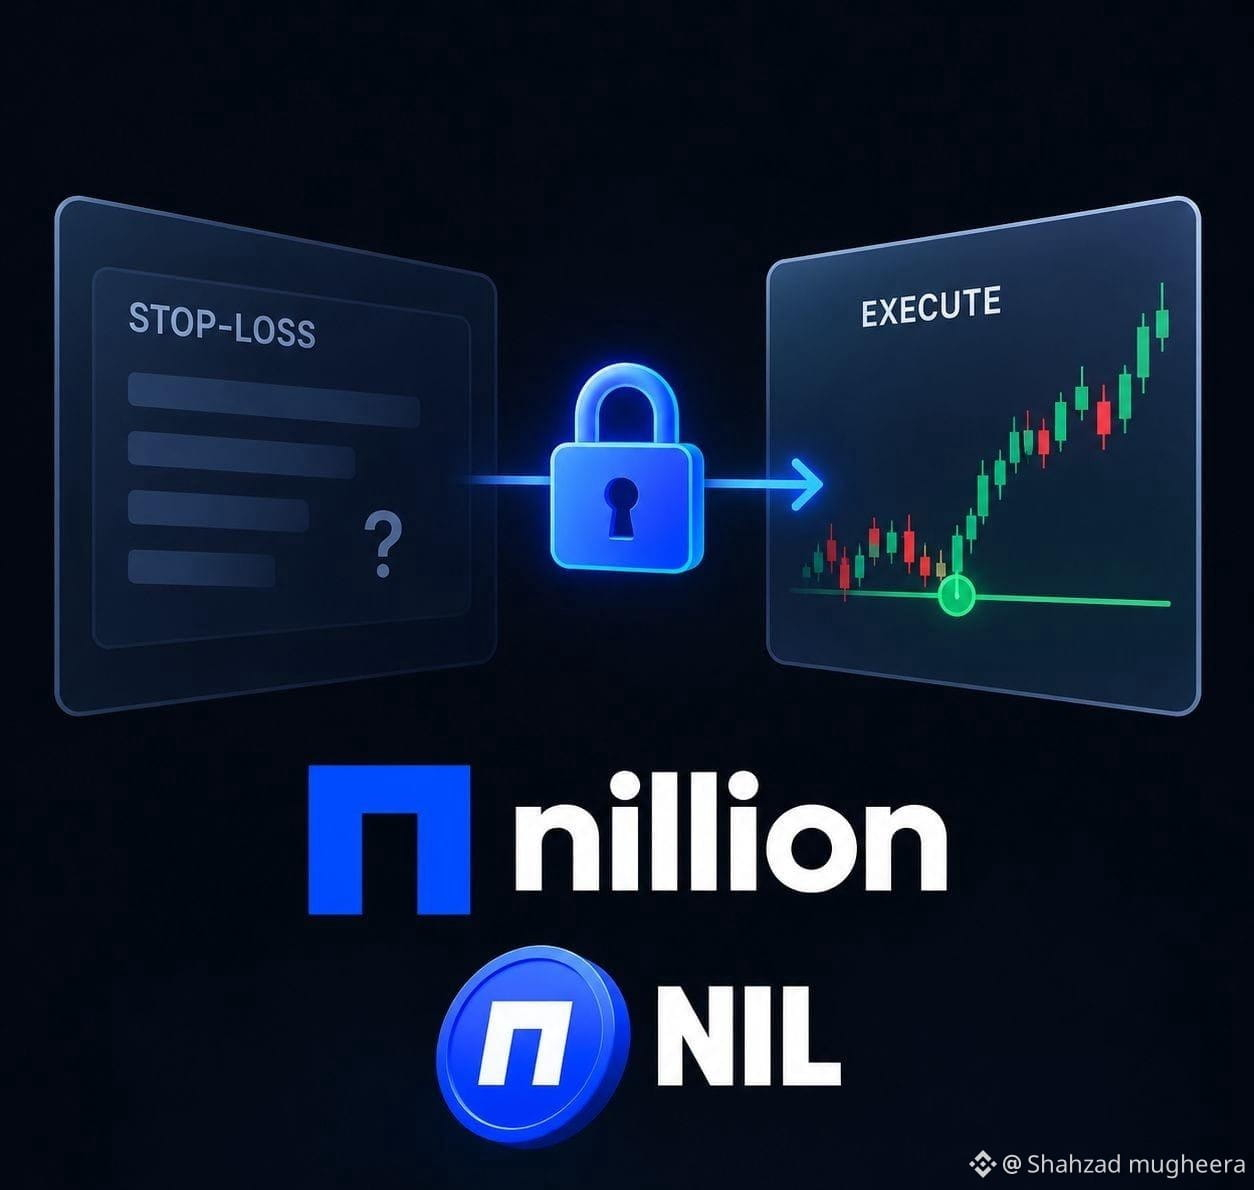
$NIL /USDT — Buyers Are Still Pushing 📈
I’m seeing a steady upward move on NIL/USDT, with price currently at 0.08717, holding above the visible MA60 at 0.08616. Buyers have pushed price toward the recent high near 0.08741, but I want to see whether this momentum can continue.
👀 My key levels: The 0.08702–0.08717 area is worth watching for a hold. If price pushes through 0.08741 and sustains above it, the next visible reference is the 24h high at 0.08903.
📍 Entry: 0.08702–0.08717, only if support holds
🎯 TP1: 0.08741
🎯 TP2: 0.08903
🎯 TP3: Not enough visible chart data to justify another target
🛑 Invalidation: 0.08616 (visible MA60)
If price loses 0.08616, I’d step away from this setup because it would fall below the visible moving average and weaken the bullish idea.
For me, the short-term structure looks constructive, but the latest pullback means chasing here could be risky. I’d rather see price hold its current area and reclaim the recent high before getting more confident. Confirmation matters more than rushing into a trade.
#NIL $NIL @nillionnetwork
$NIL /USDT — Buyers Are Still Pushing 📈
I’m seeing a steady upward move on NIL/USDT, with price currently at 0.08717, holding above the visible MA60 at 0.08616. Buyers have pushed price toward the recent high near 0.08741, but I want to see whether this momentum can continue.
👀 My key levels: The 0.08702–0.08717 area is worth watching for a hold. If price pushes through 0.08741 and sustains above it, the next visible reference is the 24h high at 0.08903.
📍 Entry: 0.08702–0.08717, only if support holds
🎯 TP1: 0.08741
🎯 TP2: 0.08903
🎯 TP3: Not enough visible chart data to justify another target
🛑 Invalidation: 0.08616 (visible MA60)
If price loses 0.08616, I’d step away from this setup because it would fall below the visible moving average and weaken the bullish idea.
For me, the short-term structure looks constructive, but the latest pullback means chasing here could be risky. I’d rather see price hold its current area and reclaim the recent high before getting more confident. Confirmation matters more than rushing into a trade.
#NIL $NIL @Nillion
515
10
30
515
PINNED
⚡ $ZEC is showing a small bounce, but the chart is still fighting resistance.
I’m watching ZEC/USDT around 1,147.40 after price pushed up from the 1,143.86–1,145.27 area and reached near 1,148.09. The move looked constructive, but price pulled back and is now trying to stabilize around 1,147.40.
For me, the first level that matters is 1,148.09. A clean move above that area would make the short-term structure more interesting. Above it, the visible MA60 at 1,149.97 is another important hurdle.
On the downside, 1,146.68 is the nearest visible area I’m watching, with 1,145.27 providing another reference if selling pressure increases.
📊 Volume is visible but appears relatively light on the latest candles, so I’m not chasing the move yet.
I’d want to see price reclaim and hold 1,148.09, preferably with stronger participation, before considering the setup more seriously.
If price loses 1,146.68 and continues lower, the bullish idea weakens and I’d stay patient.
My view: interesting bounce, but confirmation above resistance is still needed. 👀
{future}(ZECUSDT)
⚡ $ZEC is showing a small bounce, but the chart is still fighting resistance.
I’m watching ZEC/USDT around 1,147.40 after price pushed up from the 1,143.86–1,145.27 area and reached near 1,148.09. The move looked constructive, but price pulled back and is now trying to stabilize around 1,147.40.
For me, the first level that matters is 1,148.09. A clean move above that area would make the short-term structure more interesting. Above it, the visible MA60 at 1,149.97 is another important hurdle.
On the downside, 1,146.68 is the nearest visible area I’m watching, with 1,145.27 providing another reference if selling pressure increases.
📊 Volume is visible but appears relatively light on the latest candles, so I’m not chasing the move yet.
I’d want to see price reclaim and hold 1,148.09, preferably with stronger participation, before considering the setup more seriously.
If price loses 1,146.68 and continues lower, the bullish idea weakens and I’d stay patient.
My view: interesting bounce, but confirmation above resistance is still needed. 👀

860
10
52
860
$PEPE holders, let's talk about price targets.
Could PEPE reach $0.0001 next month, or is $0.001 even possible?
At the current price of $0.00000436, reaching $0.0001 would require roughly a 23x move. Reaching $0.001 would require around 229x.
If you had to choose ONE target for next month.. which would you pick.. $0.0001 or $0.001?
NFA. Manage risk.
$PEPE #PEPE #MEME
211
$DOGE $0.10 OR $0.07 NEXT?
Dogecoin is trading near $0.077 after dropping from $0.10
If buyers hold this level, DOGE could bounce towards $0.085 and then $0.10.
But if $0.075 breaks, we could see another drop towards $0.070.
For now, sellers are still strong, and bulls need to wake up!
Do you think DOGE will hit $0.10 or $0.07 first?
Trade on $DOGE
{future}(DOGEUSDT)
$DOGE $0.10 OR $0.07 NEXT?
Dogecoin is trading near $0.077 after dropping from $0.10
If buyers hold this level, DOGE could bounce towards $0.085 and then $0.10.
But if $0.075 breaks, we could see another drop towards $0.070.
For now, sellers are still strong, and bulls need to wake up!
Do you think DOGE will hit $0.10 or $0.07 first?
Trade on $DOGE
1
202
🔥 $IRYS USDT: +244% IN 24 HOURS — WHAT'S NEXT?
$IRYS is showing massive volatility, with the price around $0.09137 after a sharp move. But after such a strong rally, I’m watching the next price reaction carefully.
📊 My Chart Observations:
🔹 Current Price: $0.09137
🔹 24H Change: +244.40%
🔹 MA60: $0.09217
🔹 Near Resistance: $0.09172–$0.09228
🔹 Near Support: $0.09116, then $0.09061
🎯 What I'm Watching:
The price is still below the MA60, which sits near $0.09217. I want to see a clean breakout above this area before considering further upside.
If price gets rejected, I’ll watch whether the nearby support levels can hold.
⚠️ After such an explosive move, volatility can be extreme. I’m avoiding blind entries and waiting for confirmation.
What's your view on $IRYS — another breakout or a short-term pullback? 👇
#IRYS #CryptoTrading #BinanceSquare #Altcoins
{future}(IRYSUSDT)
🔥 $IRYS USDT: +244% IN 24 HOURS — WHAT'S NEXT?
$IRYS is showing massive volatility, with the price around $0.09137 after a sharp move. But after such a strong rally, I’m watching the next price reaction carefully.
📊 My Chart Observations:
🔹 Current Price: $0.09137
🔹 24H Change: +244.40%
🔹 MA60: $0.09217
🔹 Near Resistance: $0.09172–$0.09228
🔹 Near Support: $0.09116, then $0.09061
🎯 What I'm Watching:
The price is still below the MA60, which sits near $0.09217. I want to see a clean breakout above this area before considering further upside.
If price gets rejected, I’ll watch whether the nearby support levels can hold.
⚠️ After such an explosive move, volatility can be extreme. I’m avoiding blind entries and waiting for confirmation.
What's your view on $IRYS — another breakout or a short-term pullback? 👇
#IRYS #CryptoTrading #BinanceSquare #Altcoins
2
559
Bnb
Bnb

哈达Hada-BNB
·
--
我所见证过的最棒的产品发布是在2007年1月,由史蒂夫·乔布斯推出的iPhone。差不多19年后,这一纪录终于被特斯拉所挑战。
飞行汽车不再只是科幻小说。特斯拉Roadster的演示绝对是疯狂的。
史蒂夫·乔布斯用iPhone改变了世界。埃隆·马斯克正在将世界带向下一个层次,我相信他的火星梦想很快就会实现。
🧧———$BNB
飞行汽车不再只是科幻小说。特斯拉Roadster的演示绝对是疯狂的。
史蒂夫·乔布斯用iPhone改变了世界。埃隆·马斯克正在将世界带向下一个层次,我相信他的火星梦想很快就会实现。
🧧———$BNB



1
89


@kyl
@kyl


兰汐kyL
·
--
$BTC $ETH 币圈盯着,美国中期选举,都在超预期,特朗普支持率任职以来,创新低,是他任期里很低的位置。很多人就在猜,如果这次中期选举民主党翻盘、拿下国会控制权,后面市场会怎么走?🚨
简单说,一旦国会被对手拿下来,接下来特朗普很多政策就容易卡住,变成“跛脚”执政。减税、财政刺激这类利好风险资产的政策,想要落地难度直接变大。市场最怕的就是政策来回拉扯、不确定性增加。🚨
大家重点盯两个方向:一个是美股,尤其是受益财政政策的板块,预期会先承压;第二个是原油,中东局势叠加选举预期,波动会被放大。🚨
但也要提醒一句:民调只是参考,投票率、摇摆州变数很大,民调领先不等于最后一定赢。不要提前重仓赌结果,消息面博弈节奏很快,等落地再看资金真实选择,别被预期行情给套进去。🚨#Pepe上涨14%领涨山寨币反弹 #比特币算力创七个月新高
简单说,一旦国会被对手拿下来,接下来特朗普很多政策就容易卡住,变成“跛脚”执政。减税、财政刺激这类利好风险资产的政策,想要落地难度直接变大。市场最怕的就是政策来回拉扯、不确定性增加。🚨
大家重点盯两个方向:一个是美股,尤其是受益财政政策的板块,预期会先承压;第二个是原油,中东局势叠加选举预期,波动会被放大。🚨
但也要提醒一句:民调只是参考,投票率、摇摆州变数很大,民调领先不等于最后一定赢。不要提前重仓赌结果,消息面博弈节奏很快,等落地再看资金真实选择,别被预期行情给套进去。🚨#Pepe上涨14%领涨山寨币反弹 #比特币算力创七个月新高

124



🚀
🚀

Ahmed Ali Nizamani
·
--
🎁🎁 LETS DO IT TOGATHER 🎁🎁🎁
GO TO 👉 MY PROFILE and Click VOTE Button
and THEN Repost THIS POST
and write “ repost and vote done 🎁🎁🎁🎁
GO TO 👉 MY PROFILE and Click VOTE Button
and THEN Repost THIS POST
and write “ repost and vote done 🎁🎁🎁🎁


69
🔥 $BNB /USDT: Bulls Are Pushing Higher! 🚀
BNB is trading around $740.80, up 0.86%, after a sharp move toward the $741 area.
📊 What I'm Watching:
- Resistance: $741–$741.25
- Support: $740.50, then $739.90
- MA60: $738.75
Buyers have stepped in with a noticeable volume spike, but can they maintain the momentum?
👀 My Take: A clean break above $741.25 could strengthen the bullish setup. If BNB gets rejected, I’ll watch how price reacts around $740.50 and $739.90.
No chasing green candles. I want confirmation first.
What’s your view? Can BNB break above $741, or are we heading for a pullback? 👇
#BNB #BNBUSDT #BinanceSquare #CryptoTrading #TechnicalAnalysis
{future}(BNBUSDT)
🔥 $BNB /USDT: Bulls Are Pushing Higher! 🚀
BNB is trading around $740.80, up 0.86%, after a sharp move toward the $741 area.
📊 What I'm Watching:
- Resistance: $741–$741.25
- Support: $740.50, then $739.90
- MA60: $738.75
Buyers have stepped in with a noticeable volume spike, but can they maintain the momentum?
👀 My Take: A clean break above $741.25 could strengthen the bullish setup. If BNB gets rejected, I’ll watch how price reacts around $740.50 and $739.90.
No chasing green candles. I want confirmation first.
What’s your view? Can BNB break above $741, or are we heading for a pullback? 👇
#BNB #BNBUSDT #BinanceSquare #CryptoTrading #TechnicalAnalysis
130
$ETH is testing whether the $2,300–$2,350 region can hold after October’s selloff. Ethereum has lost ground from its September highs near $2,800, and the latest weakness reflects more than technical profit-taking. The key question is whether buyers can defend support while institutional demand remains under pressure.
Context: ETH recently traded around $2,384, with the $2,500 level still acting as a major recovery barrier. The latest technical picture remains mixed: short-term momentum has weakened, while a sustained reclaim of $2,500 would be the first meaningful sign that buyers are regaining control.
The central tension: leveraged positioning is resetting, but ETF demand remains weak. U.S. spot Ethereum ETFs recorded a $20.3M net outflow on October 22, extending the recent withdrawal trend. Futures open interest was reported around $31.25B, down 13.37% over 30 days, suggesting leverage has been reduced even as spot demand struggles to recover. Trade plan: A confirmed close above $2,500 favors $2,550, with $2,600 as the next stretch target. If ETH retests $2,325–$2,350 and holds, a relief bounce remains possible. A daily close below $2,325 would weaken the setup and expose the $2,250 area.
Risk note: NFT losses and sales to fund derivatives trading may reflect broader speculative-risk rotation, but one trader’s decision does not prove ETH demand is improving. Persistent ETF outflows remain a headwind, and ETH needs sustained spot buying to validate any rebound.
{future}(ETHUSDT)
$ETH is testing whether the $2,300–$2,350 region can hold after October’s selloff. Ethereum has lost ground from its September highs near $2,800, and the latest weakness reflects more than technical profit-taking. The key question is whether buyers can defend support while institutional demand remains under pressure.
Context: ETH recently traded around $2,384, with the $2,500 level still acting as a major recovery barrier. The latest technical picture remains mixed: short-term momentum has weakened, while a sustained reclaim of $2,500 would be the first meaningful sign that buyers are regaining control.
The central tension: leveraged positioning is resetting, but ETF demand remains weak. U.S. spot Ethereum ETFs recorded a $20.3M net outflow on October 22, extending the recent withdrawal trend. Futures open interest was reported around $31.25B, down 13.37% over 30 days, suggesting leverage has been reduced even as spot demand struggles to recover. Trade plan: A confirmed close above $2,500 favors $2,550, with $2,600 as the next stretch target. If ETH retests $2,325–$2,350 and holds, a relief bounce remains possible. A daily close below $2,325 would weaken the setup and expose the $2,250 area.
Risk note: NFT losses and sales to fund derivatives trading may reflect broader speculative-risk rotation, but one trader’s decision does not prove ETH demand is improving. Persistent ETF outflows remain a headwind, and ETH needs sustained spot buying to validate any rebound.
80
🔥 $SHIB /USDT: Bulls Are Fighting Back — Can SHIB Break Higher? 🐕
SHIB is trading around $0.00000510, up 1.59%, and the chart is showing a short-term recovery.
📊 What I'm watching:
• Current price: $0.00000510
• 24H high: $0.00000512
• 24H low: $0.00000491
• MA60: $0.00000508
SHIB has climbed from the $0.00000506 area and moved above its MA60, but price has pulled back after testing higher levels.
🎯 Key levels to watch:
🔹 Resistance: $0.00000511–$0.00000512
🔹 Support: $0.00000508–$0.00000509
🔹 Lower support: $0.00000506
My trading view: I'm watching whether SHIB can hold above the MA60 and retest the $0.00000512 resistance. A clean break above that area could strengthen the short-term setup. If price loses $0.00000508, the recovery may weaken.
No blind entries — I want to see confirmation before making a move. 📈
💬 Your view: Can SHIB break $0.00000512, or will sellers push it lower?
#SHIB #SHIBUSDT #ShibaInu #CryptoAnalysis #BinanceSquare
{spot}(SHIBUSDT)
🔥 $SHIB /USDT: Bulls Are Fighting Back — Can SHIB Break Higher? 🐕
SHIB is trading around $0.00000510, up 1.59%, and the chart is showing a short-term recovery.
📊 What I'm watching:
• Current price: $0.00000510
• 24H high: $0.00000512
• 24H low: $0.00000491
• MA60: $0.00000508
SHIB has climbed from the $0.00000506 area and moved above its MA60, but price has pulled back after testing higher levels.
🎯 Key levels to watch:
🔹 Resistance: $0.00000511–$0.00000512
🔹 Support: $0.00000508–$0.00000509
🔹 Lower support: $0.00000506
My trading view: I'm watching whether SHIB can hold above the MA60 and retest the $0.00000512 resistance. A clean break above that area could strengthen the short-term setup. If price loses $0.00000508, the recovery may weaken.
No blind entries — I want to see confirmation before making a move. 📈
💬 Your view: Can SHIB break $0.00000512, or will sellers push it lower?
#SHIB #SHIBUSDT #ShibaInu #CryptoAnalysis #BinanceSquare
1
221
🐸 $PEPE Is Holding Near 0.00000461 — But Is This Enough for a Move Higher?
I’m watching PEPE/USDT closely because price is sitting right around 0.00000461, up 2.44% on the screen. What caught my attention is how quickly price recovered after dipping toward 0.00000459. Still, I want confirmation before calling this a bullish setup.
📊 Key Levels I’m Watching
🔹 Resistance: 0.00000462–0.00000465
Price is hovering near 0.00000462, while the visible 24-hour high is 0.00000465. Buyers need to push through this area to make the setup more interesting.
🔹 Support: 0.00000459
This is the clearest nearby support shown on the chart. A drop below it would weaken the current short-term picture.
📈 Moving Average: MA60 is around 0.00000461, almost matching the current price. That tells me PEPE is sitting at an important short-term decision area rather than showing a clear directional advantage.
My Trading View 🎯
I’d like to see price break above 0.00000462 and hold, ideally with stronger volume, before considering a bullish continuation.
If price loses 0.00000459, I’d step back and reassess instead of buying blindly.
No confirmed breakout yet, so I’m not chasing this move.
What do you think? 🐸 Can PEPE challenge 0.00000465, or will sellers push it back down?
{alpha}()
🐸 $PEPE Is Holding Near 0.00000461 — But Is This Enough for a Move Higher?
I’m watching PEPE/USDT closely because price is sitting right around 0.00000461, up 2.44% on the screen. What caught my attention is how quickly price recovered after dipping toward 0.00000459. Still, I want confirmation before calling this a bullish setup.
📊 Key Levels I’m Watching
🔹 Resistance: 0.00000462–0.00000465
Price is hovering near 0.00000462, while the visible 24-hour high is 0.00000465. Buyers need to push through this area to make the setup more interesting.
🔹 Support: 0.00000459
This is the clearest nearby support shown on the chart. A drop below it would weaken the current short-term picture.
📈 Moving Average: MA60 is around 0.00000461, almost matching the current price. That tells me PEPE is sitting at an important short-term decision area rather than showing a clear directional advantage.
My Trading View 🎯
I’d like to see price break above 0.00000462 and hold, ideally with stronger volume, before considering a bullish continuation.
If price loses 0.00000459, I’d step back and reassess instead of buying blindly.
No confirmed breakout yet, so I’m not chasing this move.
What do you think? 🐸 Can PEPE challenge 0.00000465, or will sellers push it back down?
222
🚀
🚀

听澜321
·
--
🌺现在就为 听澜321 投票,助力其成为2026年度区块链百强创作者!
立即投票
(投票时间:10月19号-10月28号,一共10天)
朋友们麻烦帮我一直投票到时间结束,一天一票,感谢大家😘🥰🌹🌺
#市场定价美联储下周加息概率仅10%
立即投票
(投票时间:10月19号-10月28号,一共10天)
朋友们麻烦帮我一直投票到时间结束,一天一票,感谢大家😘🥰🌹🌺
#市场定价美联储下周加息概率仅10%

47

2
2

正乾--四条2
·
--
DeepSeekbug
最近广场上都在谈 DeepSeekbug,说它是最火的项目。 可在我眼里,它更像一首写给 "不完美者" 的小词。
────── 夜半青灯陪坐久,一行红字来探。 世间谁惯写平凡。 未圆犹补缀,孤月照更阑。
人人竞逐完美境,我怜微瑕成篇。 山河缝处漏天光。 每回重起步,星火已燎原。 ──────
那行 "红字",是深夜报错的代码;是复盘后的交易计划;是普通人痛定思痛的成长;是创业者波折后重新出发; 那轮 "孤月",是独自重来的你; 而那束从缝隙漏进来的天光 —— 是我们相信,每一个不完美的你,都还有继续变好的权利。
人生没有最终版本。 每一次修复,都是一次更新。 我们不想承诺一夜暴富,只想陪你把 Bug 修成勋章。
Fix the Bug. Evolve Yourself.Record Your Journey. 修复 Bug,进化自己,记录人生。 我们在 DeepSeekbug,等每一个还愿意重来的人,回家。🐛
温馨提示:以上仅为个人对DeepSeekbug的解读,不构成任何投资建议。
如果你也对交易感兴趣,欢迎评论区留言或加入聊天室一起交流,一起学习,一起成长。
欢迎加入正乾商学研习社
#美国比特币ETF净流入5.27亿美元

53
🚀 🎰
🚀 🎰
Ahmed Ali Nizamani
·
--
🎁 MY RESPECTED FRIENDS 🎁🎁🎁
Go To 👉 MY PROFILE and click VOTE button
VOTE FOR RAISING STAR 🌟 2926 Awards 🏆
and Write “ Vote done for you 🎁🎁🎁🎁🎁
Go To 👉 MY PROFILE and click VOTE button
VOTE FOR RAISING STAR 🌟 2926 Awards 🏆
and Write “ Vote done for you 🎁🎁🎁🎁🎁


53
Войдите, чтобы посмотреть больше материала
Присоединяйтесь к пользователям криптовалют по всему миру на Binance Square
⚡️ Получайте новейшую и полезную информацию о криптоактивах.
💬 Нам доверяет крупнейшая в мире криптобиржа.
👍 Получите достоверные аналитические данные от верифицированных создателей контента.
Эл. почта/номер телефона
В тренде
BinancePick
Просмотров: 3M
152,454 обсуждают
Join #EarningsSeason: Predict Earnings on Binance Pick, Share Your Take on Binance Square!
Binance Square Official
·Лайков: 409
·Просмотров: 342.8k
EarningsSeason
Просмотров: 5.3M
25,920 обсуждают
AnthropicTTMRevenueGrewAbout1200%
Просмотров: 25,481
380 обсуждают