

SnEmroz
1.8k Публикации

SnEmroz
Отправить жалобу
Заблокировать пользователя
Crypto Trader | Scalper | Challenge Master Sharing smart setups & Trade Psychology | Quality - Quantity I DYOR I (X- Marks_BTC )
30 подписок(и/а)
8.4K+ подписчиков(а)
9.4K+ понравилось
Посты
Все
Цитирования
·
--
Статья
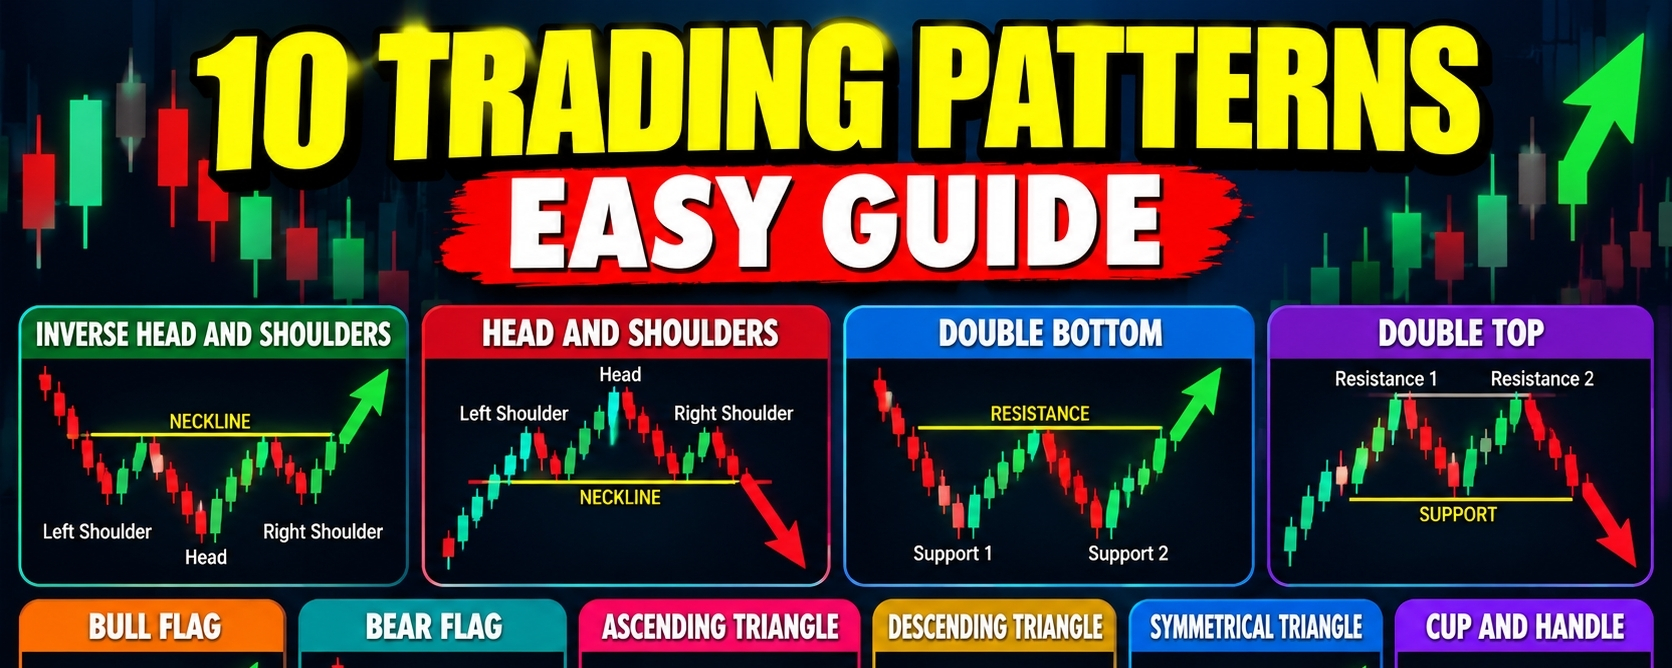
The 10 Most Important Trading Chart Patterns.Trading chart patterns are shapes that form when prices move up and down on a chart. Traders study these patterns to understand the possible direction of the market. Some patterns suggest that a trend may reverse while others suggest that the existing trend may continue. However these patterns do not guarantee future price movements.
1. Inverse Head and Shoulders.
The inverse head and shoulders is a bullish reversal pattern that can appear after a downtrend. It contains three lows. The middle low is the deepest and is called the head. The two outer lows are called the shoulders. A neckline connects the highs between these lows. When the price breaks above the neckline the pattern may indicate that buyers are gaining control and an upward move could begin.
2. Head and Shoulders.
The head and shoulders pattern is a bearish reversal pattern that often appears after an uptrend. It contains three peaks. The middle peak is the highest and is called the head. The two outer peaks are the shoulders. A neckline connects the lows between the peaks. When the price breaks below the neckline the pattern may indicate that buying pressure is weakening and the market could move downward.
3. Double Bottom.
The double bottom is a bullish reversal pattern that looks like the letter W. It forms when the price falls to a similar support area twice and rises after each attempt. This suggests that sellers are struggling to push the price lower. The pattern becomes more meaningful when the price breaks above the resistance level formed between the two lows. This breakout may signal the beginning of an upward move.
4. Double Top.
The double top is a bearish reversal pattern that looks like the letter M. It forms when the price reaches a similar resistance area twice and falls after each attempt. This suggests that buyers are struggling to push the price higher. The pattern is confirmed when the price breaks below the support level between the two peaks. This breakdown may indicate the beginning of a downward move.
5. Bull Flag.
The bull flag is a bullish continuation pattern that usually forms after a strong upward price movement. The sharp rise creates the flagpole. A short period of consolidation forms the flag as the price moves sideways or slightly downward. When the price breaks above the flag the previous upward trend may continue. Traders often look for this pattern when a strong rally pauses before potentially moving higher again.
6. Bear Flag.
The bear flag is a bearish continuation pattern that usually forms after a strong downward price movement. The sharp decline creates the flagpole. A short recovery or sideways movement forms the flag. When the price breaks below the flag the previous downward trend may continue. Traders watch this pattern because a temporary recovery does not always mean that the market has changed direction.
7. Ascending Triangle.
The ascending triangle is a pattern with a relatively flat resistance level and rising support levels. The price repeatedly approaches the same resistance area while each pullback stops at a higher level. This suggests that buyers are gradually pushing the price upward. A breakout above resistance may signal a bullish move. However the price can also fail to break resistance and move downward instead.
8. Descending Triangle.
The descending triangle is a pattern with a relatively flat support level and falling resistance levels. The price repeatedly approaches the same support area while each recovery reaches a lower high. This suggests that sellers are applying increasing pressure. A breakdown below support may signal a bearish move. However the support level can hold and the price may break upward instead.
9. Symmetrical Triangle.
The symmetrical triangle forms when the price creates lower highs and higher lows. These movements bring the resistance and support lines closer together. This shows that the trading range is narrowing as buyers and sellers compete for control. The pattern does not provide a reliable direction before a breakout. A move above resistance may signal an upward move while a break below support may signal a downward move.
10. Cup and Handle.
The cup and handle is generally considered a bullish continuation pattern. The cup forms when the price declines and then gradually recovers to create a rounded shape. The handle forms when the price experiences a smaller pullback or sideways movement near the previous resistance area. A breakout above the handle resistance may indicate that the upward trend is resuming. A deep or prolonged decline in the handle can weaken the pattern.
Trading chart patterns can help us identify possible market reversals and trend continuations. The inverse head and shoulders and double bottom may indicate bullish reversals. The head and shoulders and double top may indicate bearish reversals. Bull flags and bear flags often suggest that an existing trend may continue. Triangles show a narrowing trading range while the cup and handle can indicate a potential continuation of an upward trend.
A pattern should not be treated as a guaranteed signal. We are generally look for a confirmed breakout and consider the broader trend and trading volume before making a decision. Risk management remains important because even well formed chart patterns can fail.
If you think this post informative for you! I think you forget to Follow me!
The 10 Most Important Trading Chart Patterns.
Trading chart patterns are shapes that form when prices move up and down on a chart. Traders study these patterns to understand the possible direction of the market. Some patterns suggest that a trend may reverse while others suggest that the existing trend may continue. However these patterns do not guarantee future price movements.
1. Inverse Head and Shoulders.
The inverse head and shoulders is a bullish reversal pattern that can appear after a downtrend. It contains three lows. The middle low is the deepest and is called the head. The two outer lows are called the shoulders. A neckline connects the highs between these lows. When the price breaks above the neckline the pattern may indicate that buyers are gaining control and an upward move could begin.
2. Head and Shoulders.
The head and shoulders pattern is a bearish reversal pattern that often appears after an uptrend. It contains three peaks. The middle peak is the highest and is called the head. The two outer peaks are the shoulders. A neckline connects the lows between the peaks. When the price breaks below the neckline the pattern may indicate that buying pressure is weakening and the market could move downward.
3. Double Bottom.
The double bottom is a bullish reversal pattern that looks like the letter W. It forms when the price falls to a similar support area twice and rises after each attempt. This suggests that sellers are struggling to push the price lower. The pattern becomes more meaningful when the price breaks above the resistance level formed between the two lows. This breakout may signal the beginning of an upward move.
4. Double Top.
The double top is a bearish reversal pattern that looks like the letter M. It forms when the price reaches a similar resistance area twice and falls after each attempt. This suggests that buyers are struggling to push the price higher. The pattern is confirmed when the price breaks below the support level between the two peaks. This breakdown may indicate the beginning of a downward move.
5. Bull Flag.
The bull flag is a bullish continuation pattern that usually forms after a strong upward price movement. The sharp rise creates the flagpole. A short period of consolidation forms the flag as the price moves sideways or slightly downward. When the price breaks above the flag the previous upward trend may continue. Traders often look for this pattern when a strong rally pauses before potentially moving higher again.
6. Bear Flag.
The bear flag is a bearish continuation pattern that usually forms after a strong downward price movement. The sharp decline creates the flagpole. A short recovery or sideways movement forms the flag. When the price breaks below the flag the previous downward trend may continue. Traders watch this pattern because a temporary recovery does not always mean that the market has changed direction.
7. Ascending Triangle.
The ascending triangle is a pattern with a relatively flat resistance level and rising support levels. The price repeatedly approaches the same resistance area while each pullback stops at a higher level. This suggests that buyers are gradually pushing the price upward. A breakout above resistance may signal a bullish move. However the price can also fail to break resistance and move downward instead.
8. Descending Triangle.
The descending triangle is a pattern with a relatively flat support level and falling resistance levels. The price repeatedly approaches the same support area while each recovery reaches a lower high. This suggests that sellers are applying increasing pressure. A breakdown below support may signal a bearish move. However the support level can hold and the price may break upward instead.
9. Symmetrical Triangle.
The symmetrical triangle forms when the price creates lower highs and higher lows. These movements bring the resistance and support lines closer together. This shows that the trading range is narrowing as buyers and sellers compete for control. The pattern does not provide a reliable direction before a breakout. A move above resistance may signal an upward move while a break below support may signal a downward move.
10. Cup and Handle.
The cup and handle is generally considered a bullish continuation pattern. The cup forms when the price declines and then gradually recovers to create a rounded shape. The handle forms when the price experiences a smaller pullback or sideways movement near the previous resistance area. A breakout above the handle resistance may indicate that the upward trend is resuming. A deep or prolonged decline in the handle can weaken the pattern.
Trading chart patterns can help us identify possible market reversals and trend continuations. The inverse head and shoulders and double bottom may indicate bullish reversals. The head and shoulders and double top may indicate bearish reversals. Bull flags and bear flags often suggest that an existing trend may continue. Triangles show a narrowing trading range while the cup and handle can indicate a potential continuation of an upward trend.
A pattern should not be treated as a guaranteed signal. We are generally look for a confirmed breakout and consider the broader trend and trading volume before making a decision. Risk management remains important because even well formed chart patterns can fail.
If you think this post informative for you! I think you forget to Follow me!
120
·
--
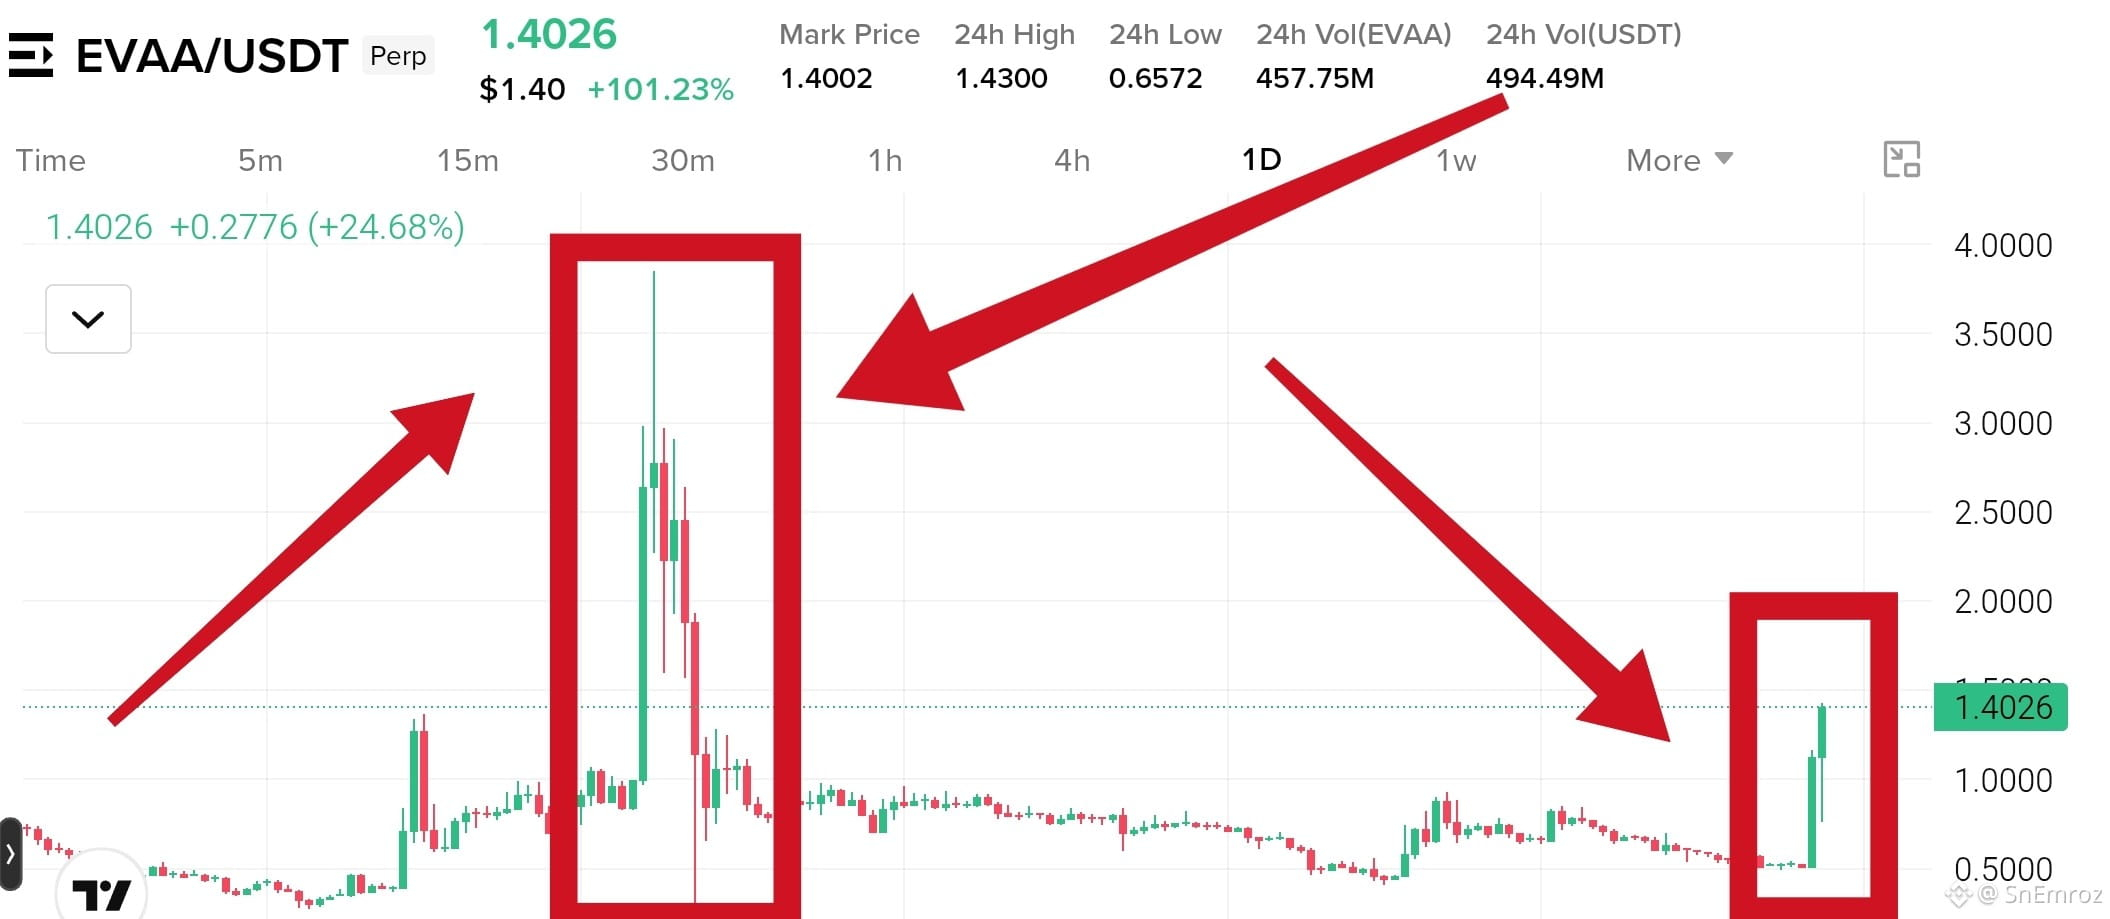
Look at $EVAA on the 1D chart.
The first pump ran from under 1.00 to about 3.85. Then it fell almost all the way back in a few days. Now a new green candle is up 101% today. Many people see this and think it will go to the moon again. This is exactly where money gets lost.
{future}(EVAAUSDT)
How people lose.
They buy because the candle is already green and everyone is talking about it.
They think last time it hit 3.85 so it will do it again.
They enter with big size and high leverage.
They have no stop loss.
They hold when price drops and hope it comes back.
What smart traders do.
Never chase a candle that is already up 100%.
Wait for a pullback and a clear level to hold.
Keep size small on wild coins.
Set the stop loss before the entry.
Take profit while price is up and do not wait for the top.
The first pump gave back almost everything. A big green candle is not a promise. Many times it is the exit for early buyers.
#evva
Look at $EVAA on the 1D chart.
The first pump ran from under 1.00 to about 3.85. Then it fell almost all the way back in a few days. Now a new green candle is up 101% today. Many people see this and think it will go to the moon again. This is exactly where money gets lost.
How people lose.
They buy because the candle is already green and everyone is talking about it.
They think last time it hit 3.85 so it will do it again.
They enter with big size and high leverage.
They have no stop loss.
They hold when price drops and hope it comes back.
What smart traders do.
Never chase a candle that is already up 100%.
Wait for a pullback and a clear level to hold.
Keep size small on wild coins.
Set the stop loss before the entry.
Take profit while price is up and do not wait for the top.
The first pump gave back almost everything. A big green candle is not a promise. Many times it is the exit for early buyers.
#evva
557
·
--
Рост
$BTW
{future}(BTWUSDT)
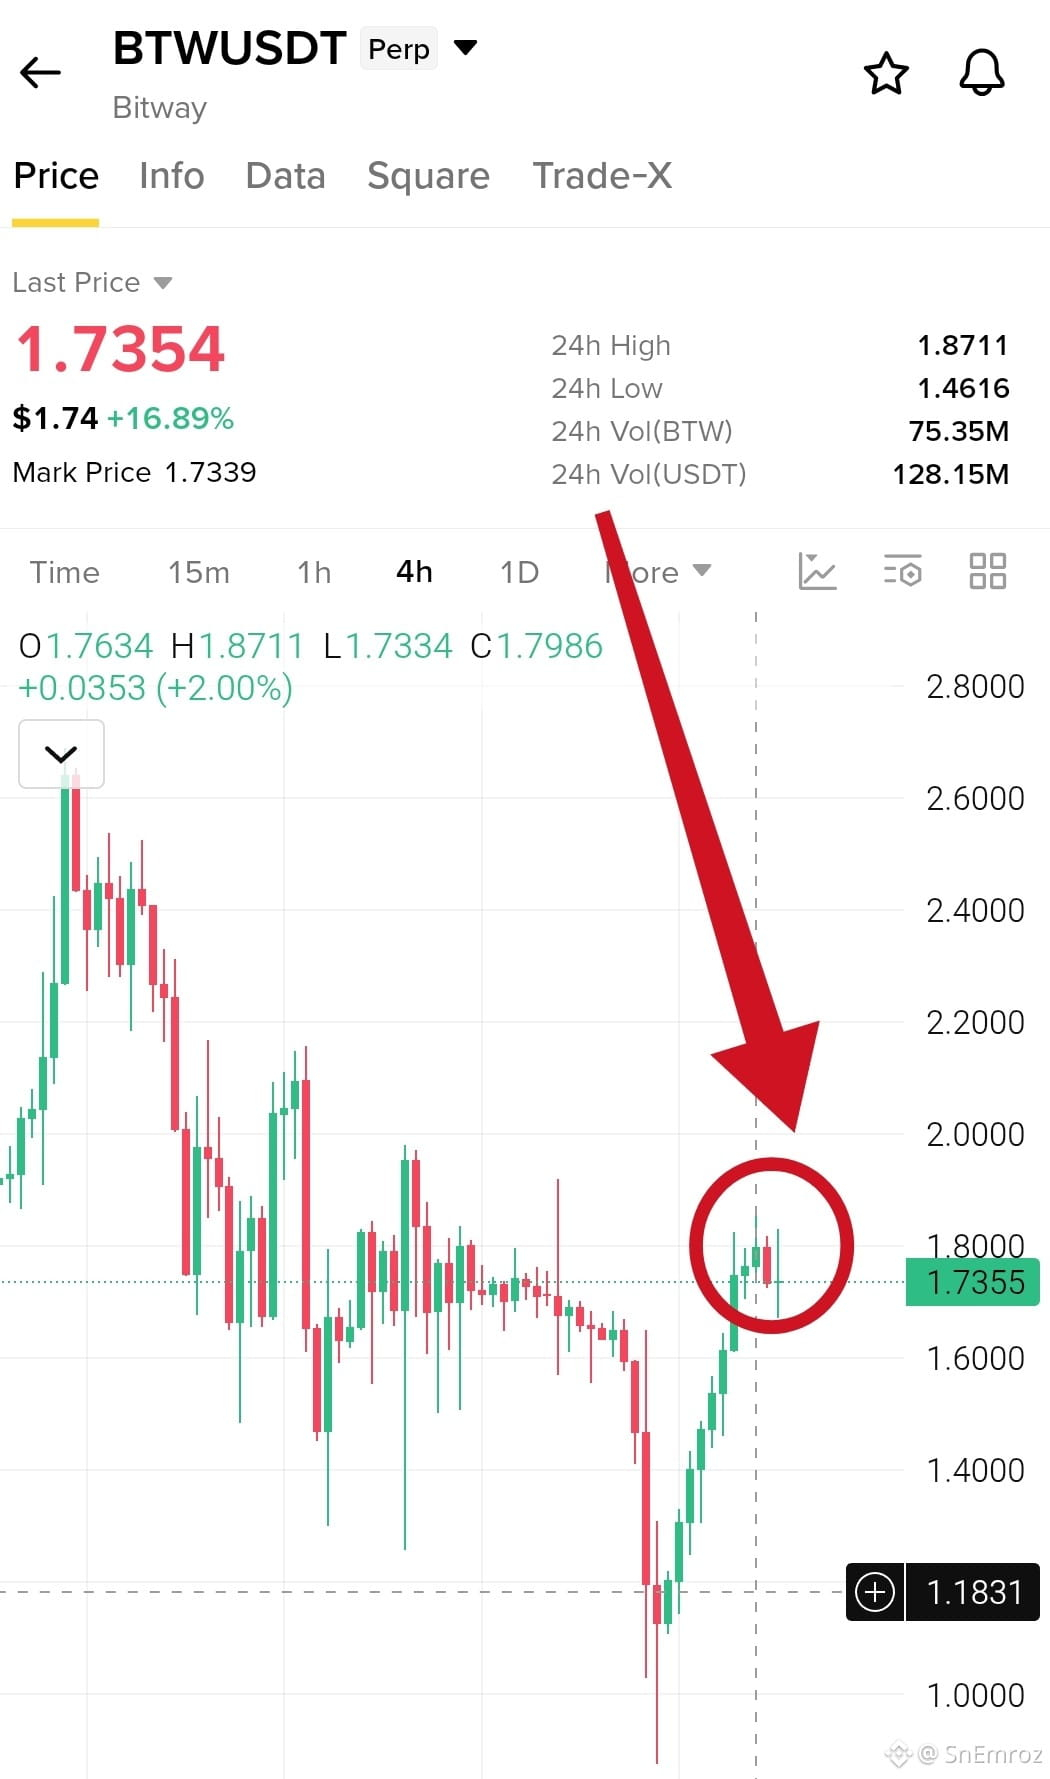
update, target zone touched 🎯
In my last update the price was 1.52 and I named 1.8581 to 1.8711 as the main target. Today's high is 1.8711, so price tapped the top of that zone.
It has pulled back to 1.7354 and the candles show long upper wicks. Sellers are defending the top.
First support to watch is 1.6492. A close below it can drop price toward 1.4616. A clean 4h close above 1.8711 can start a new leg up.
$BTW
update, target zone touched 🎯
In my last update the price was 1.52 and I named 1.8581 to 1.8711 as the main target. Today's high is 1.8711, so price tapped the top of that zone.
It has pulled back to 1.7354 and the candles show long upper wicks. Sellers are defending the top.
First support to watch is 1.6492. A close below it can drop price toward 1.4616. A clean 4h close above 1.8711 can start a new leg up.
SnEmroz
·
--
Рост$BTW is now at 1.52 and up 37% today
Momentum is strong on the 4h chart and buyers are in full control.
Price swept down to 0.8688 and bounced hard from there.
First resistance is 1.6492, the 24h high. The main target is the last high zone at 1.8581 to 1.8711.
After a pump this fast a pullback is normal, so do not chase. Wait for a retest or a clean close above 1.6492.
If buyers lose power, price can give back a big part of the pump.
1
470
·
--
Падение
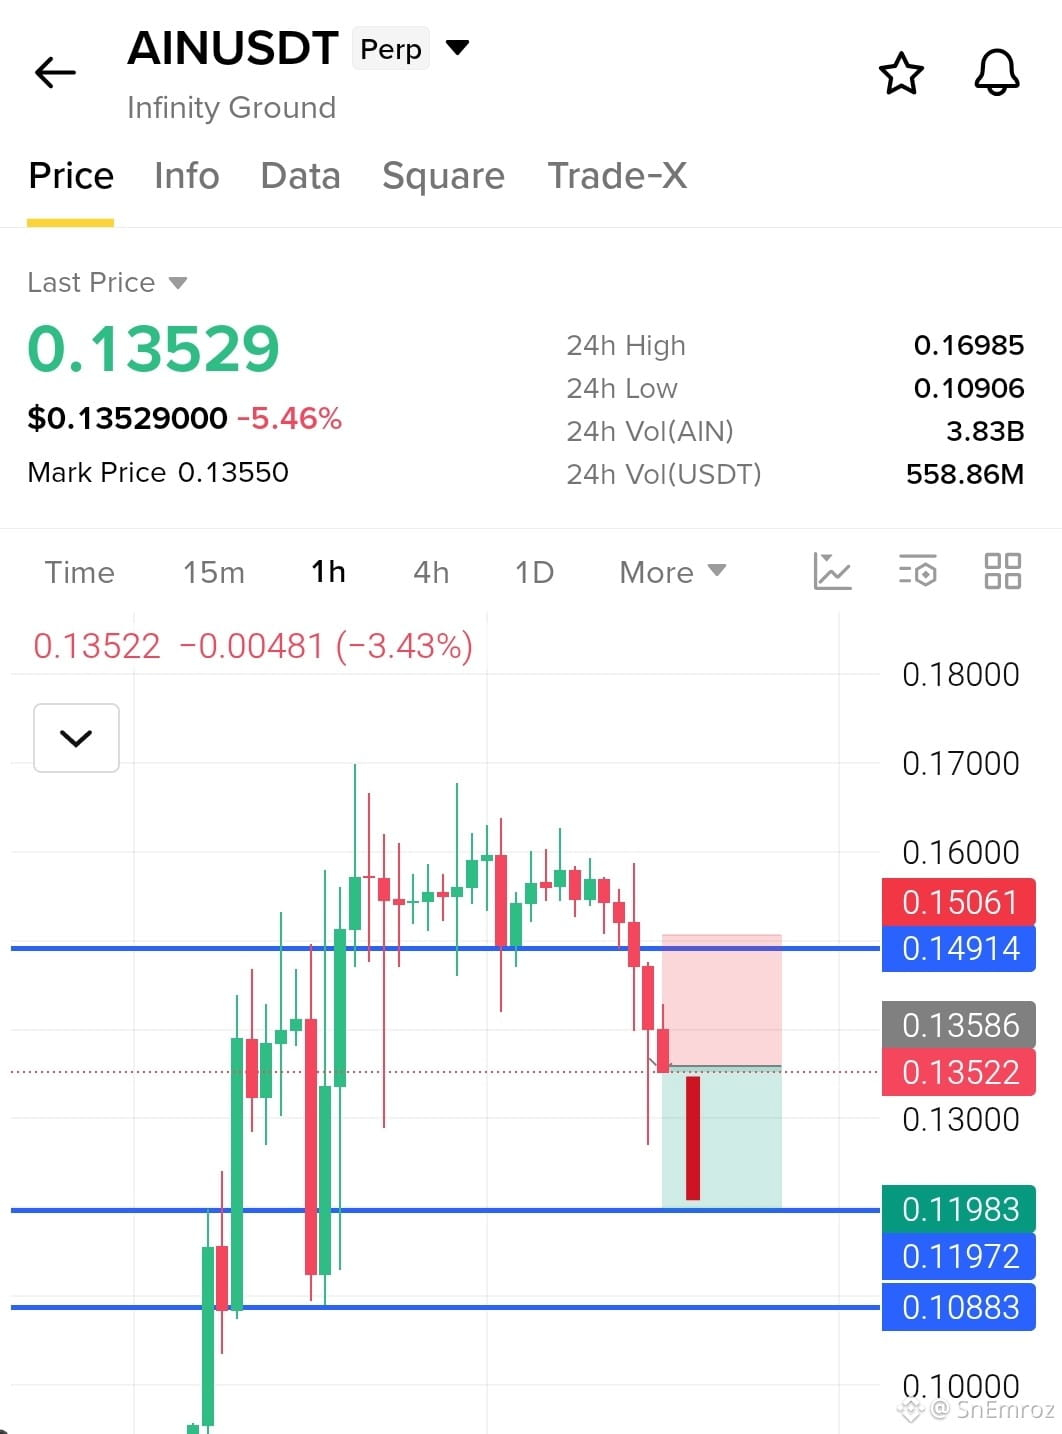
$AIN Short Setup 1h Chart🔴
Breakdown and retest pattern
Price pumped hard to the 0.1698 high and then failed to hold. It made a lower high, broke below the 0.14914 support and is now sitting under it with strong red candles. That level is now resistance, and sellers are pressing price down from there. If price stays below 0.14914, a drop toward the 0.1198 support is likely. This coin is very volatile with a 24h range from 0.1091 to 0.1698, so keep your size small and respect the stop loss
Entry 0.13522
{future}(AINUSDT)
Take Profits
TP1 0.13156
TP2 0.12670
TP3 0.11983
Stop Loss 0.15061
#AIN
$AIN Short Setup 1h Chart🔴
Breakdown and retest pattern
Price pumped hard to the 0.1698 high and then failed to hold. It made a lower high, broke below the 0.14914 support and is now sitting under it with strong red candles. That level is now resistance, and sellers are pressing price down from there. If price stays below 0.14914, a drop toward the 0.1198 support is likely. This coin is very volatile with a 24h range from 0.1091 to 0.1698, so keep your size small and respect the stop loss
Entry 0.13522
Take Profits
TP1 0.13156
TP2 0.12670
TP3 0.11983
Stop Loss 0.15061
#AIN
831
·
--
Рост
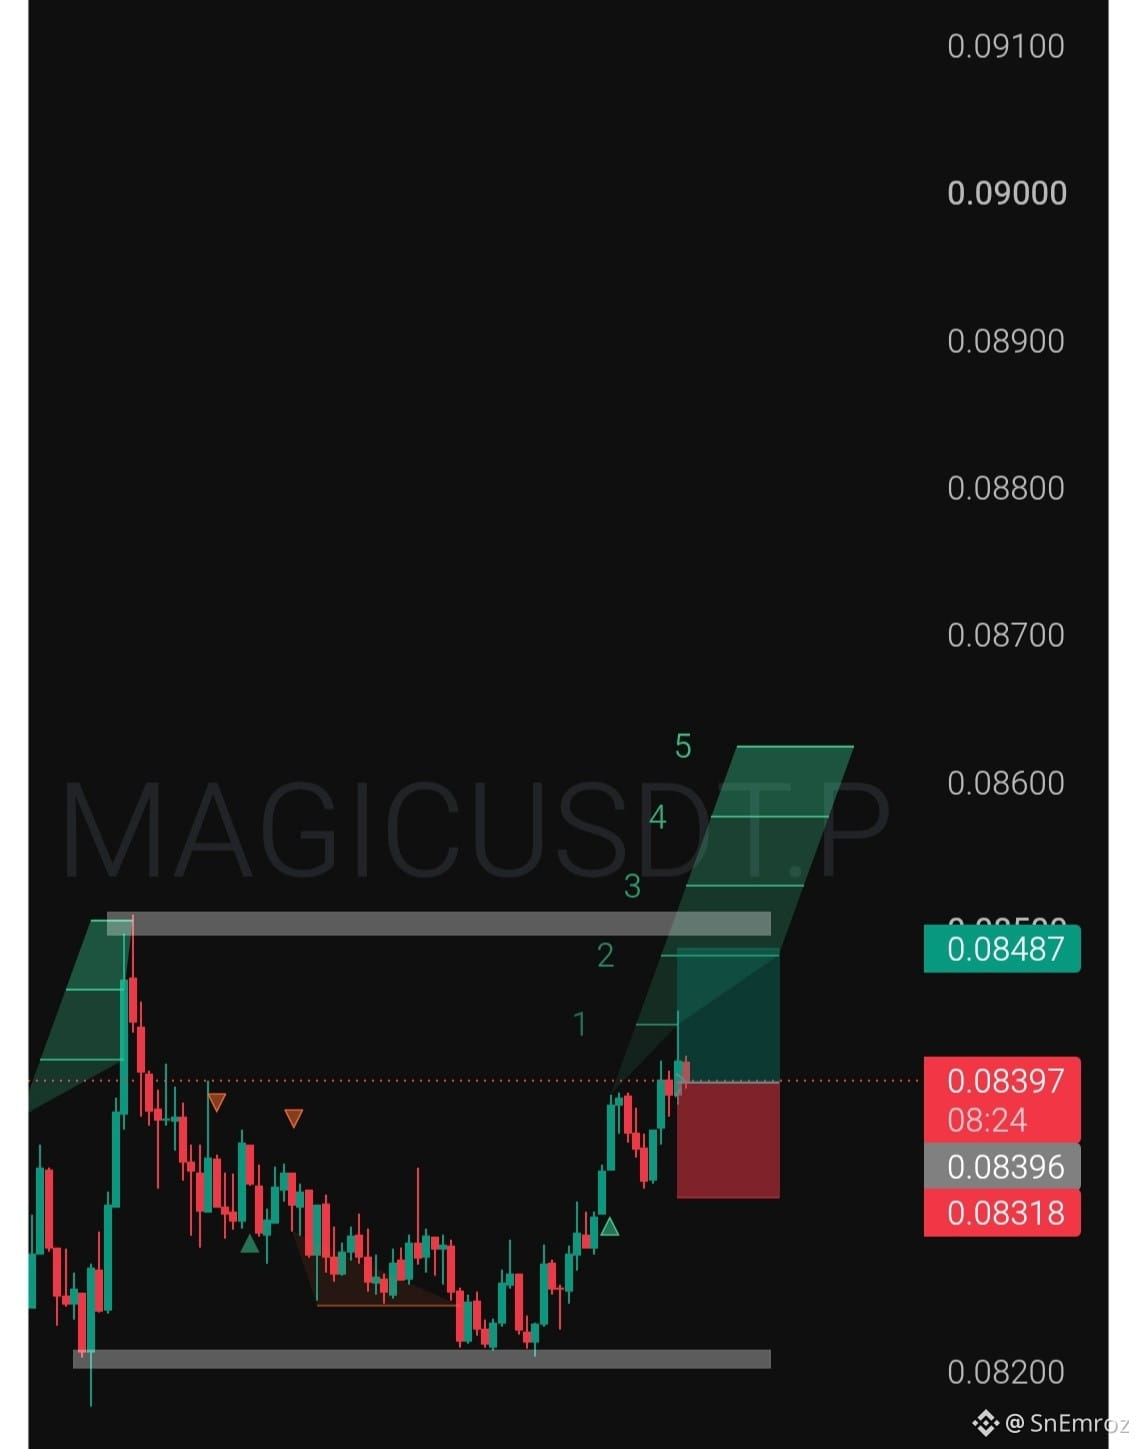
$MAGIC Long Setup🟢
Double bottom range bounce
Price tapped the 0.0821 to 0.0823 support twice and buyers defended it both times. It has now made a higher low and pushed up with strong green candles toward the top of the range. The last time price reached the 0.0850 resistance it got rejected with a long wick, so the final target sits just under that wall. If price falls back under the higher low, the setup is gone
Entry 0.08398
{future}(MAGICUSDT)
Take Profits
TP1 0.08430
TP2 0.08460
TP3 0.08487
Stop Loss 0.08318
#MAGIC
$MAGIC Long Setup🟢
Double bottom range bounce
Price tapped the 0.0821 to 0.0823 support twice and buyers defended it both times. It has now made a higher low and pushed up with strong green candles toward the top of the range. The last time price reached the 0.0850 resistance it got rejected with a long wick, so the final target sits just under that wall. If price falls back under the higher low, the setup is gone
Entry 0.08398
Take Profits
TP1 0.08430
TP2 0.08460
TP3 0.08487
Stop Loss 0.08318
#MAGIC
534
·
--
Падение
Частичная правда
Violence, violence, violence 🔥
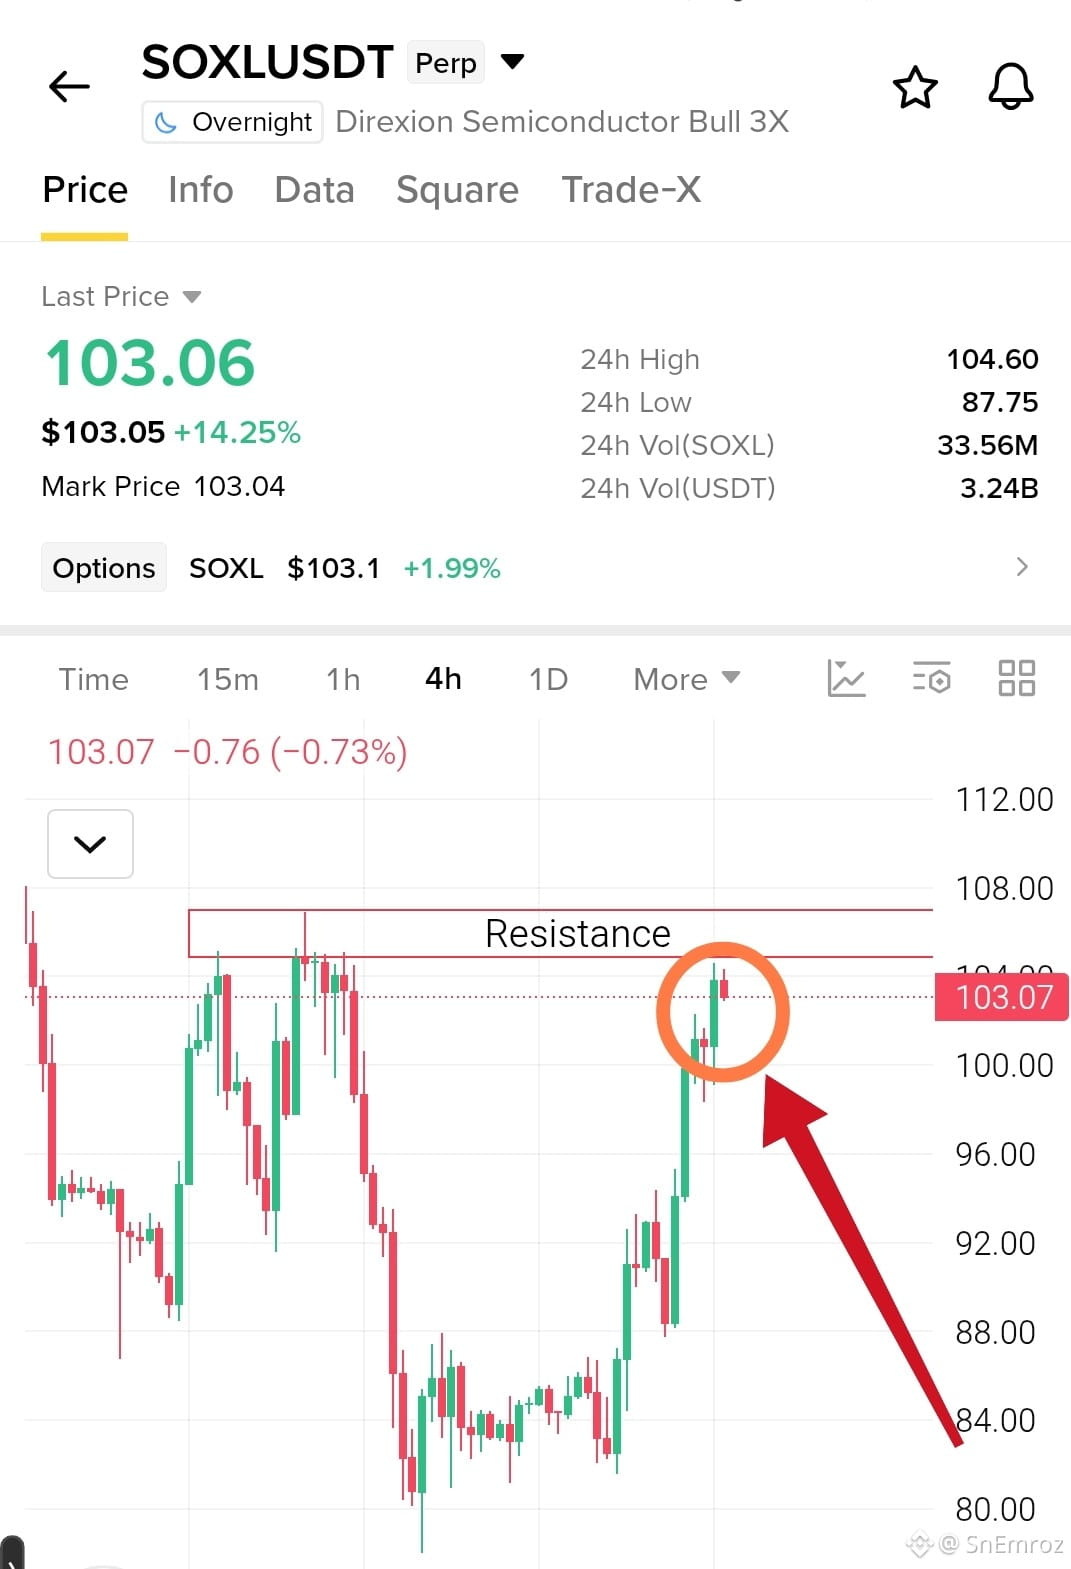
$SOXL
{future}(SOXLUSDT)
is giving salute to its resistance
So kids go away from here
Nobody knows how many hours it will keep giving respect to this resistance
Price ran from 80 to 103 almost in a straight line, up 14% today and
Now it is stuck right under the 105 to 107 zone where sellers are waiting.
A clean 4h close above 107 and buyers can push for 108 to 112
A rejection here can send it back to 96 and then 92
No stop loss means no trade
#soxl
Violence, violence, violence 🔥
$SOXL
is giving salute to its resistance
So kids go away from here
Nobody knows how many hours it will keep giving respect to this resistance
Price ran from 80 to 103 almost in a straight line, up 14% today and
Now it is stuck right under the 105 to 107 zone where sellers are waiting.
A clean 4h close above 107 and buyers can push for 108 to 112
A rejection here can send it back to 96 and then 92
No stop loss means no trade
#soxl
1
751
·
--
Рост
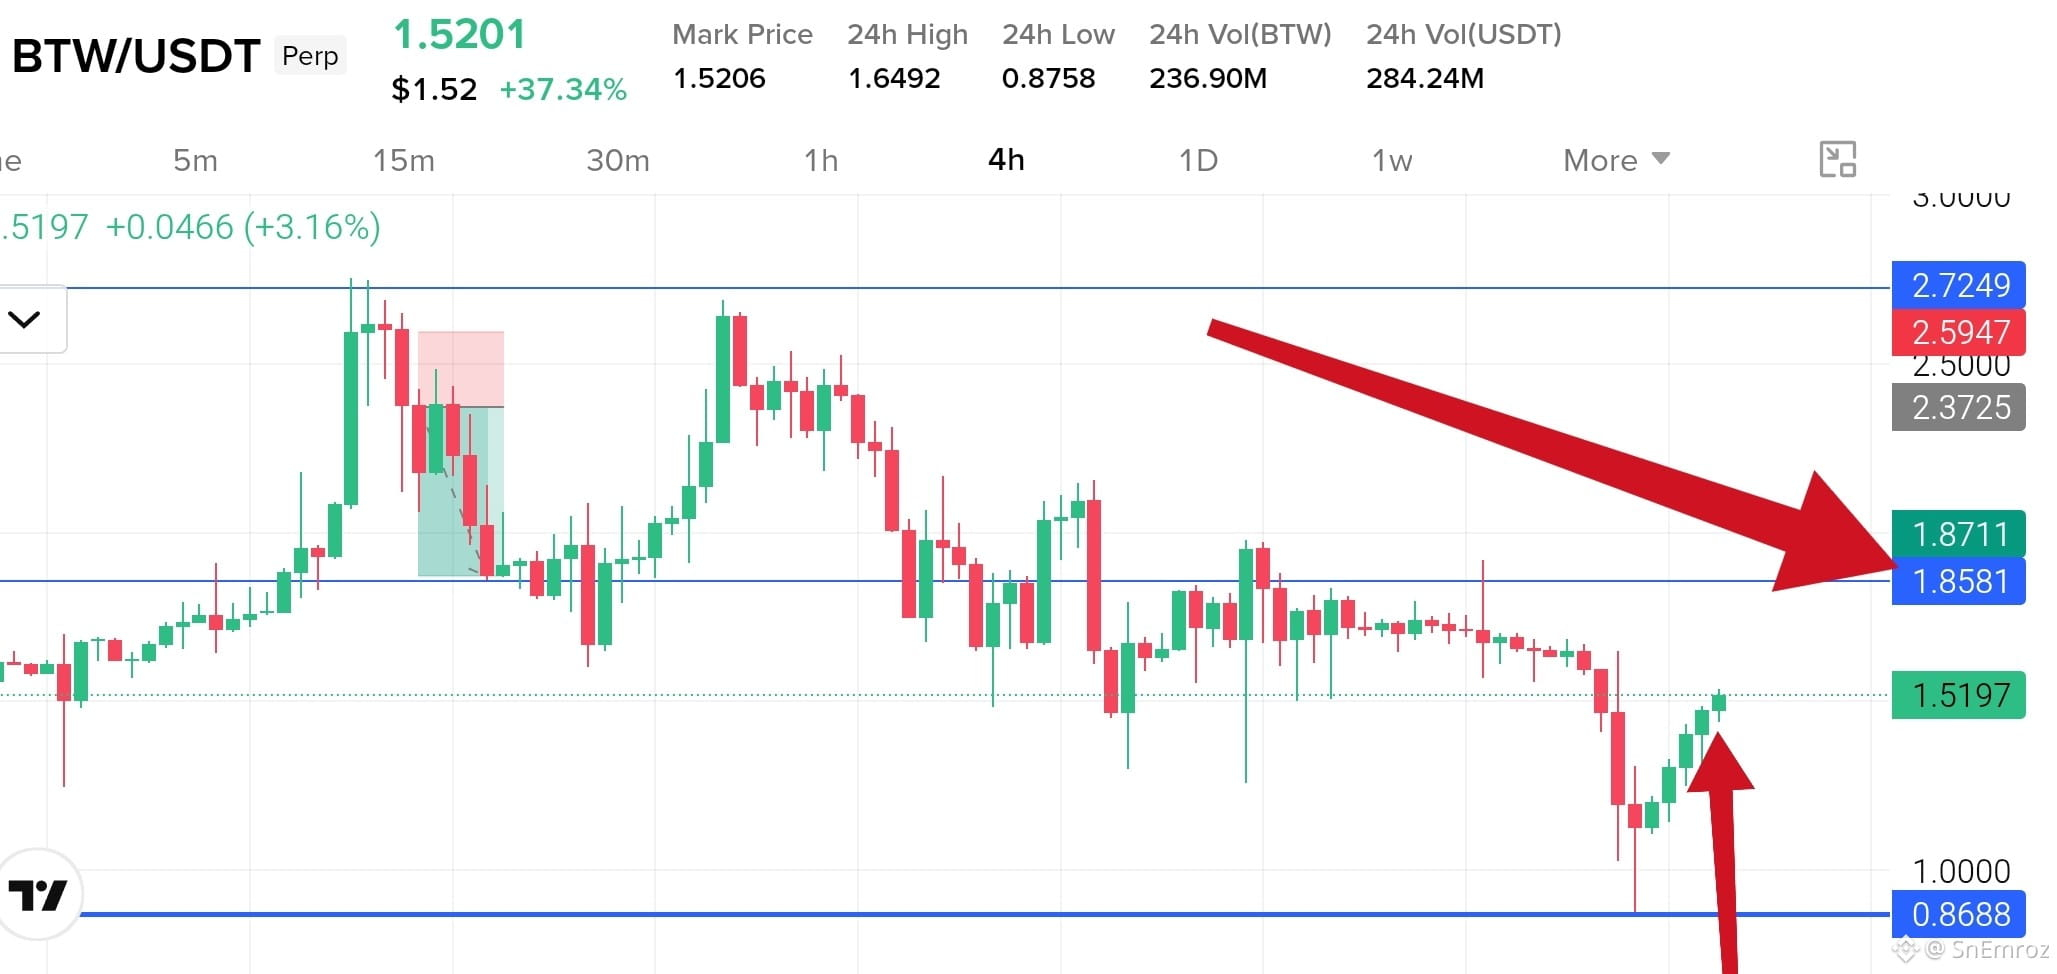
$BTW is now at 1.52 and up 37% today
Momentum is strong on the 4h chart and buyers are in full control.
{future}(BTWUSDT)
Price swept down to 0.8688 and bounced hard from there.
First resistance is 1.6492, the 24h high. The main target is the last high zone at 1.8581 to 1.8711.
After a pump this fast a pullback is normal, so do not chase. Wait for a retest or a clean close above 1.6492.
If buyers lose power, price can give back a big part of the pump.
$BTW is now at 1.52 and up 37% today
Momentum is strong on the 4h chart and buyers are in full control.
Price swept down to 0.8688 and bounced hard from there.
First resistance is 1.6492, the 24h high. The main target is the last high zone at 1.8581 to 1.8711.
After a pump this fast a pullback is normal, so do not chase. Wait for a retest or a clean close above 1.6492.
If buyers lose power, price can give back a big part of the pump.
1
707
·
--
Рост
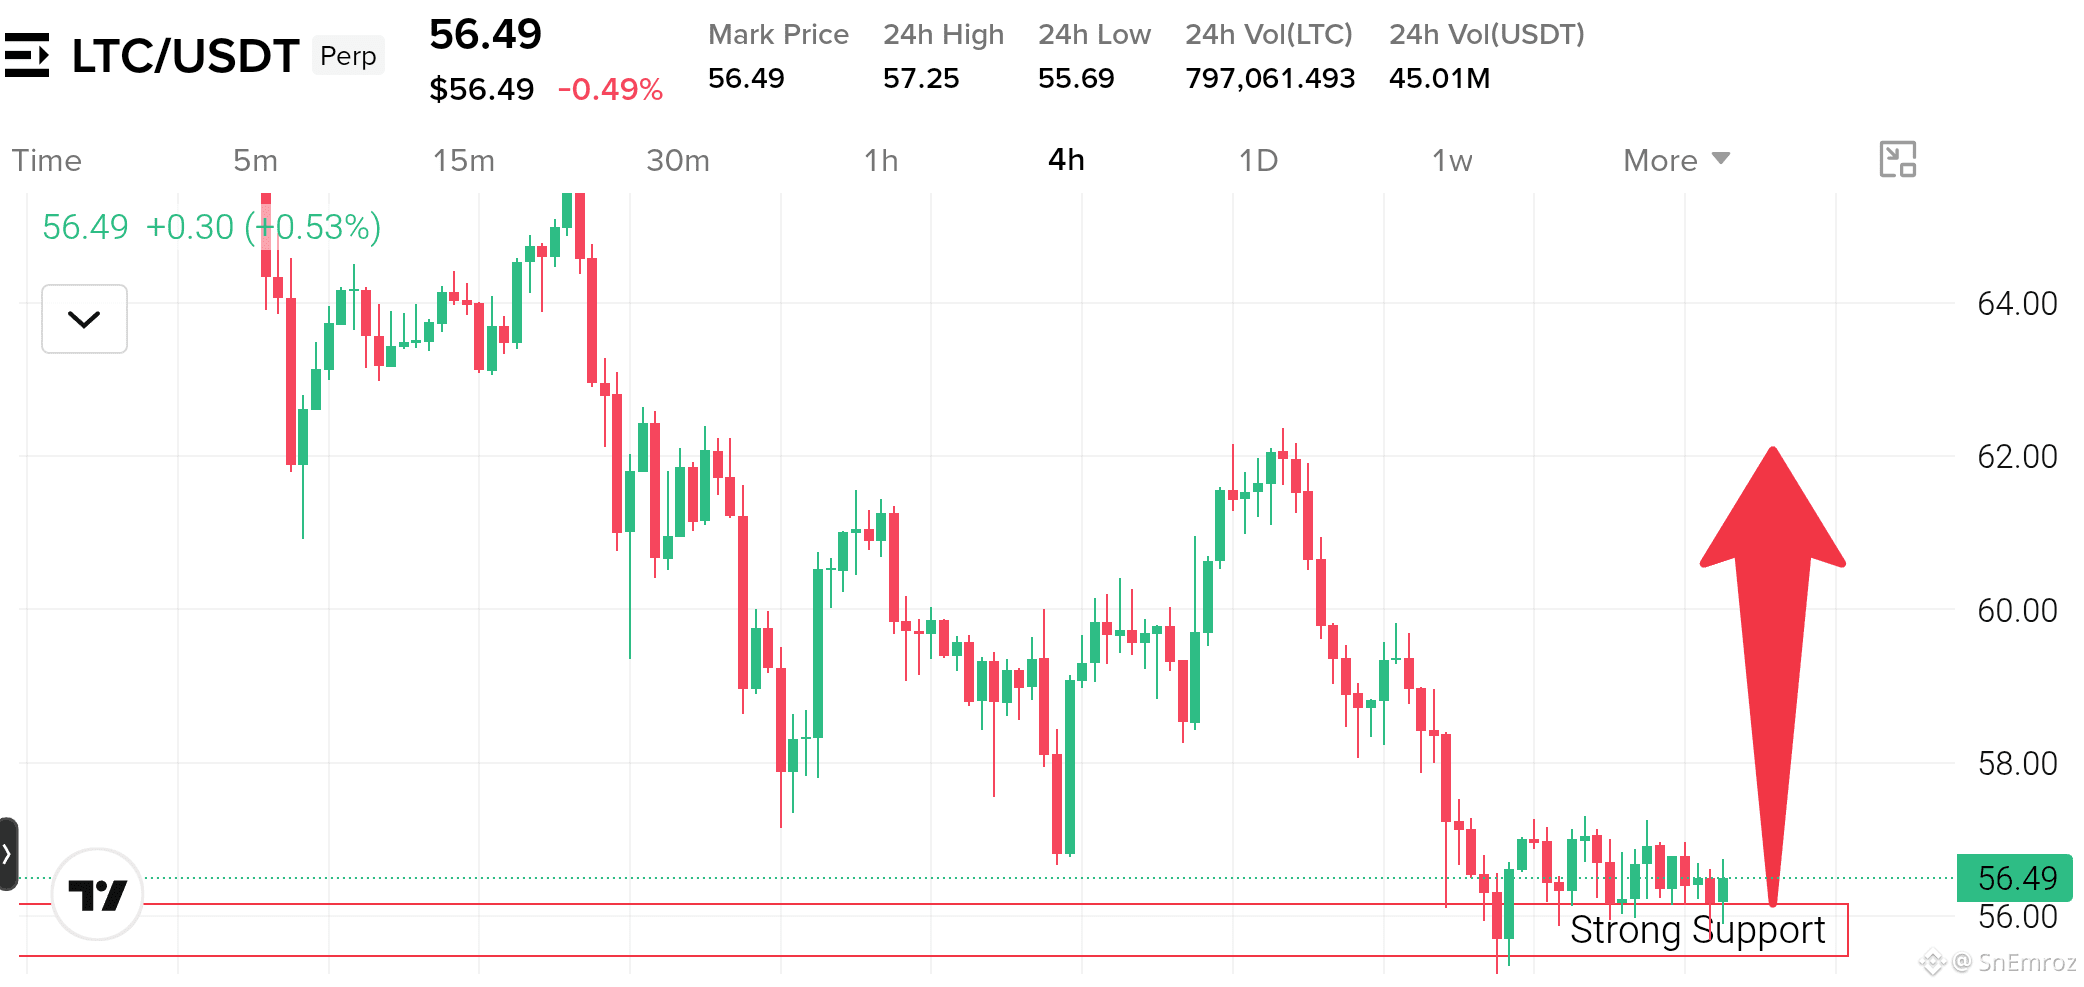
$LTC Support Bounce Watch 4h Chart 🟢
Support base after a sharp drop
{future}(LTCUSDT)
Price fell hard from 62.40 and swept down to 55.30 then buyers took it back above the 55.50 to 56.15 support zone.
Since then it has moved sideways in small candles near 56.50 which shows sellers are losing power.
The trend is still down with lower highs from 65.40 so this is a bounce watch and not a confirmed reversal.
A 4h close above 57.30 can send LTC to 58.00 and then 59.50 to 60.00.
A close below 55.50 breaks the support and opens more downside.
#ltc
$LTC Support Bounce Watch 4h Chart 🟢
Support base after a sharp drop
Price fell hard from 62.40 and swept down to 55.30 then buyers took it back above the 55.50 to 56.15 support zone.
Since then it has moved sideways in small candles near 56.50 which shows sellers are losing power.
The trend is still down with lower highs from 65.40 so this is a bounce watch and not a confirmed reversal.
A 4h close above 57.30 can send LTC to 58.00 and then 59.50 to 60.00.
A close below 55.50 breaks the support and opens more downside.
#ltc
460
·
--
Рост
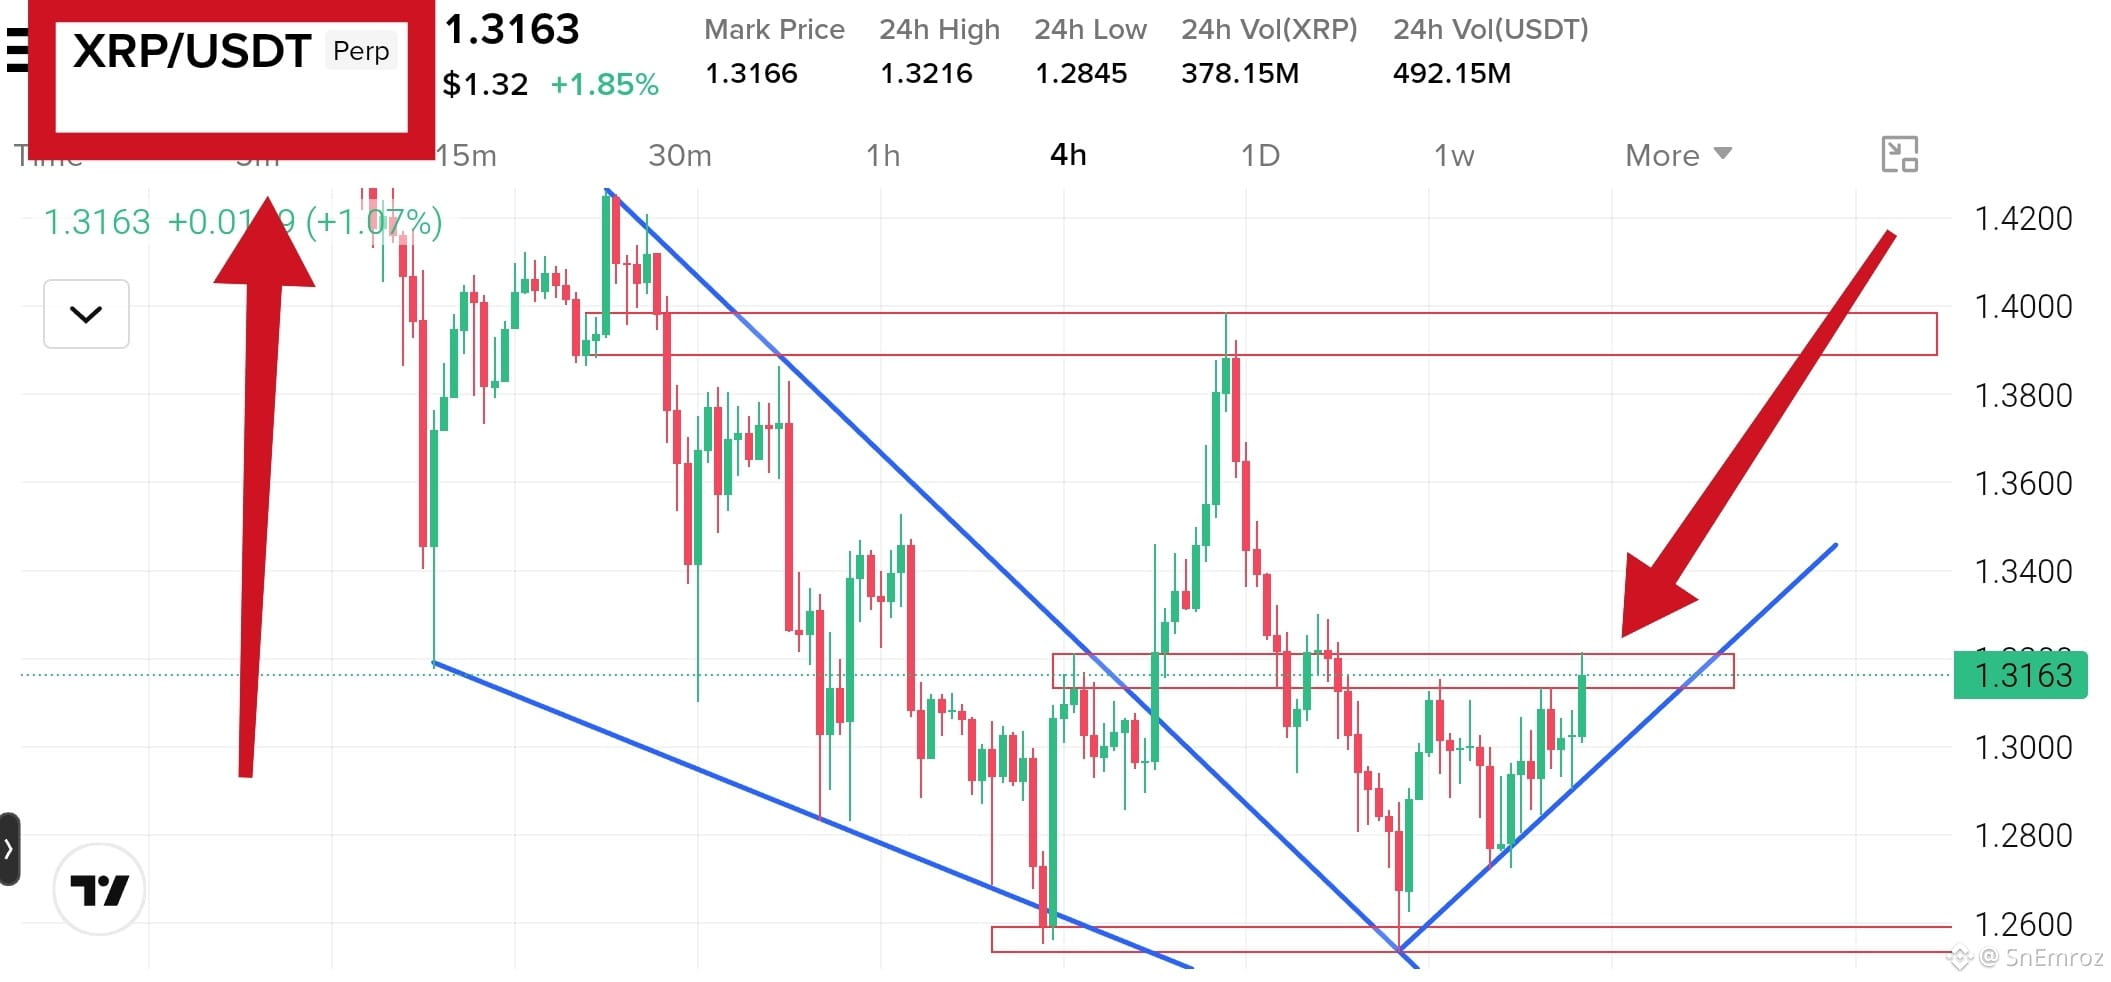
$XRP Bullish Breakout Retest 4h Chart 🟢
Falling wedge breakout and retest
{future}(XRPUSDT)
Price broke out of the falling wedge and ran up to 1.3990, then pulled back and retested the broken line near 1.2560.
Buyers defended the 1.2534 to 1.2591 support right there, and price has made higher lows along a rising trendline since.
Now it is pushing into the 1.3135 to 1.3210 resistance zone with green candles.
so buyers are active, but price needs a clean close to confirm.
A 4h close above 1.3210 can send XRP to 1.3400 and then 1.3600.
The big wall sits at 1.3890 to 1.3990
A 4h close below the rising trendline near 1.2930 can drop price to 1.2800 and then 1.2560
#xrp #EarningsSeason
$XRP Bullish Breakout Retest 4h Chart 🟢
Falling wedge breakout and retest
Price broke out of the falling wedge and ran up to 1.3990, then pulled back and retested the broken line near 1.2560.
Buyers defended the 1.2534 to 1.2591 support right there, and price has made higher lows along a rising trendline since.
Now it is pushing into the 1.3135 to 1.3210 resistance zone with green candles.
so buyers are active, but price needs a clean close to confirm.
A 4h close above 1.3210 can send XRP to 1.3400 and then 1.3600.
The big wall sits at 1.3890 to 1.3990
A 4h close below the rising trendline near 1.2930 can drop price to 1.2800 and then 1.2560
#xrp #EarningsSeason
516
·
--
Падение
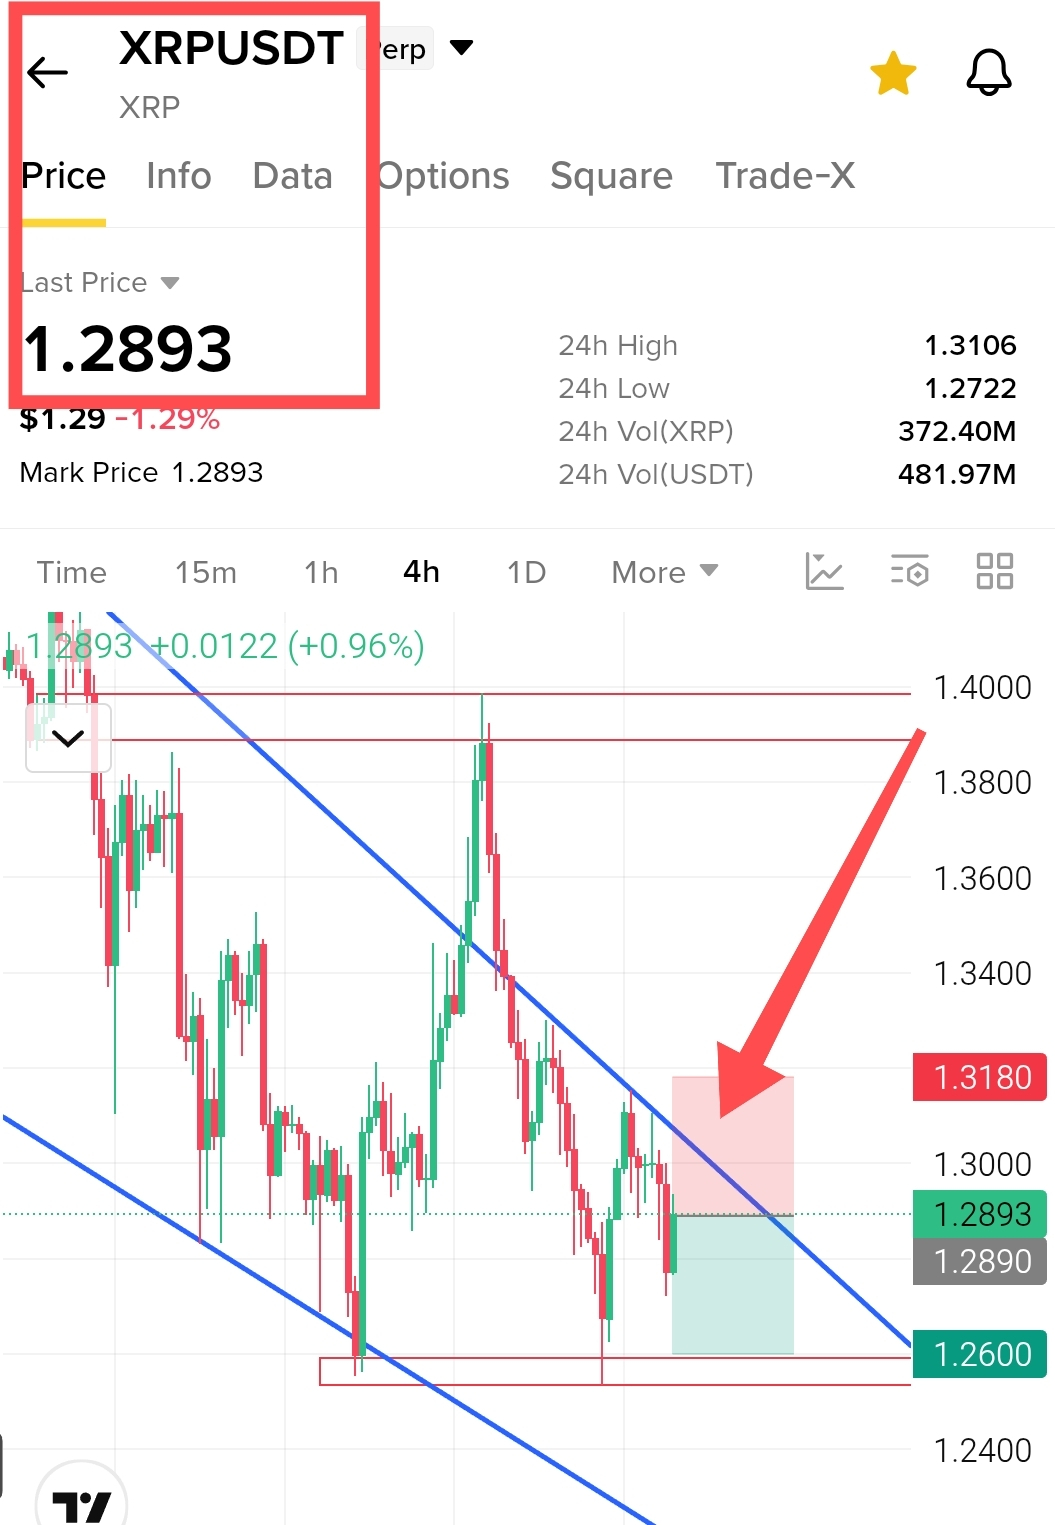
$XRP Short Setup 4h Chart
Falling channel trendline rejection
Price has been moving down inside a falling channel with lower highs, and it is now pushing back into the upper trendline near 1.29. Every bounce into this line has failed so far and the candles are losing strength under it. Buyers defended the 1.2600 support before, so that is the area to watch for the last target. If price stays under the line, a drop back toward 1.2600 is likely
Short Entry 1.293
{future}(XRPUSDT)
Take Profits
TP1 1.2800
TP2 1.2700
TP3 1.2600
Stop Loss 1.3180
#xrp
$XRP Short Setup 4h Chart
Falling channel trendline rejection
Price has been moving down inside a falling channel with lower highs, and it is now pushing back into the upper trendline near 1.29. Every bounce into this line has failed so far and the candles are losing strength under it. Buyers defended the 1.2600 support before, so that is the area to watch for the last target. If price stays under the line, a drop back toward 1.2600 is likely
Short Entry 1.293
Take Profits
TP1 1.2800
TP2 1.2700
TP3 1.2600
Stop Loss 1.3180
#xrp
553
·
--
Рост
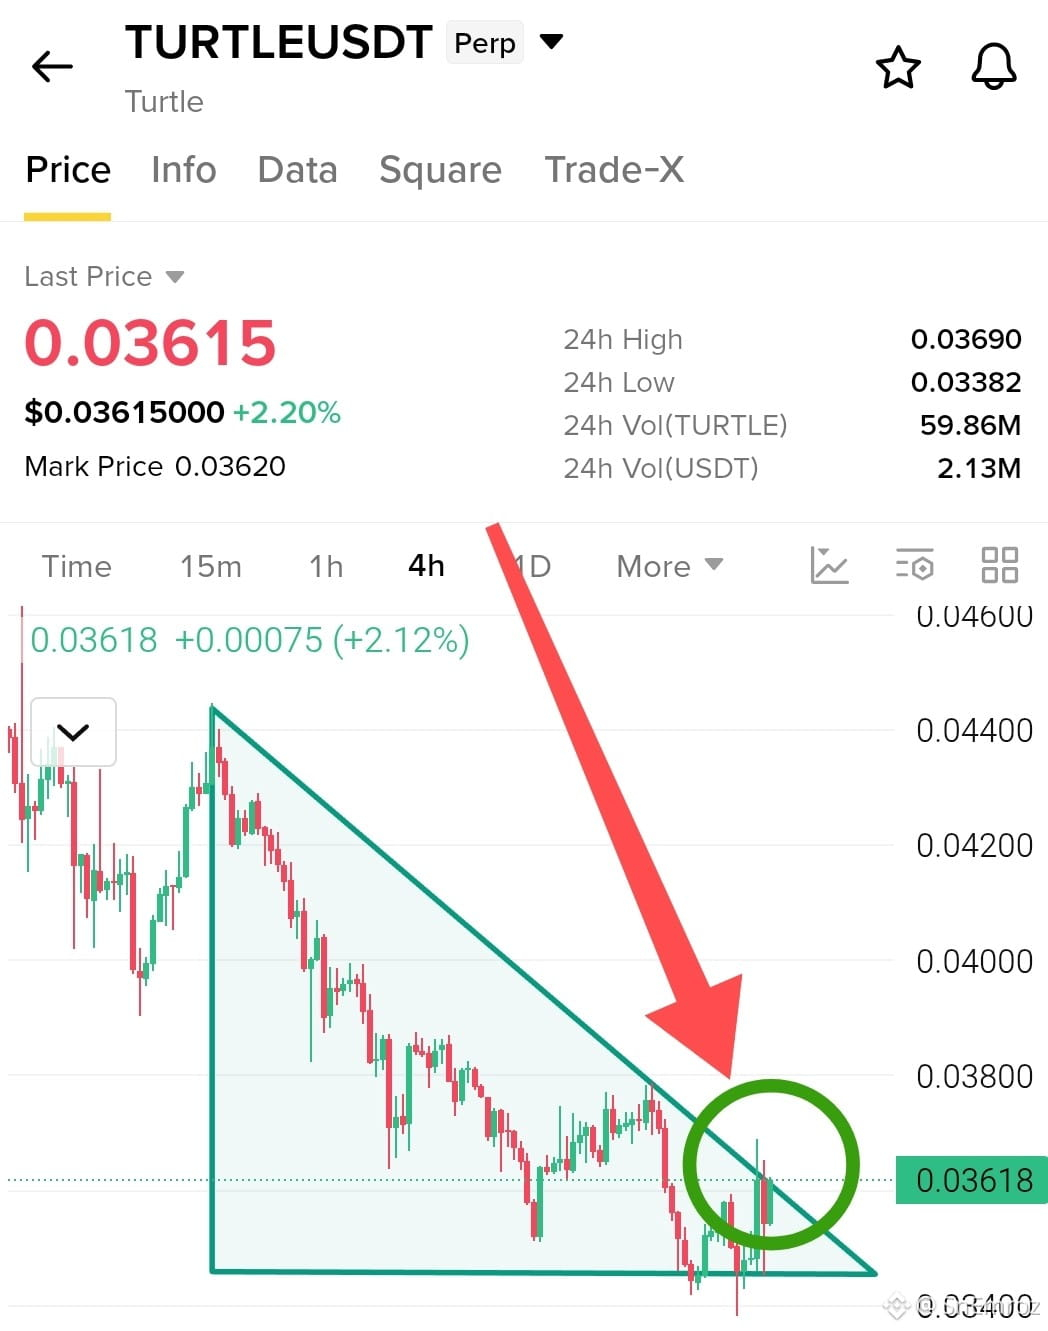
$TURTLE Breakout Watch 4h Chart 🟢
Descending triangle retest
Price has been falling under this trendline since the 0.0444 high, and it is up 2.2% today at 0.0362.
The flat support near 0.0345 held again. Sellers pushed it to a low of 0.0338, but buyers took it straight back to the line with a strong green candle.
Price is now at the tip of the triangle, and the last time it touched this line near 0.0378 it got rejected.
So confirmation matters here. If it breaks this line with a strong 4h close above 0.0370, we can easily see 0.0380 first and then 0.0400.
{future}(TURTLEUSDT)
$TURTLE Breakout Watch 4h Chart 🟢
Descending triangle retest
Price has been falling under this trendline since the 0.0444 high, and it is up 2.2% today at 0.0362.
The flat support near 0.0345 held again. Sellers pushed it to a low of 0.0338, but buyers took it straight back to the line with a strong green candle.
Price is now at the tip of the triangle, and the last time it touched this line near 0.0378 it got rejected.
So confirmation matters here. If it breaks this line with a strong 4h close above 0.0370, we can easily see 0.0380 first and then 0.0400.
1
422
·
--
Падение
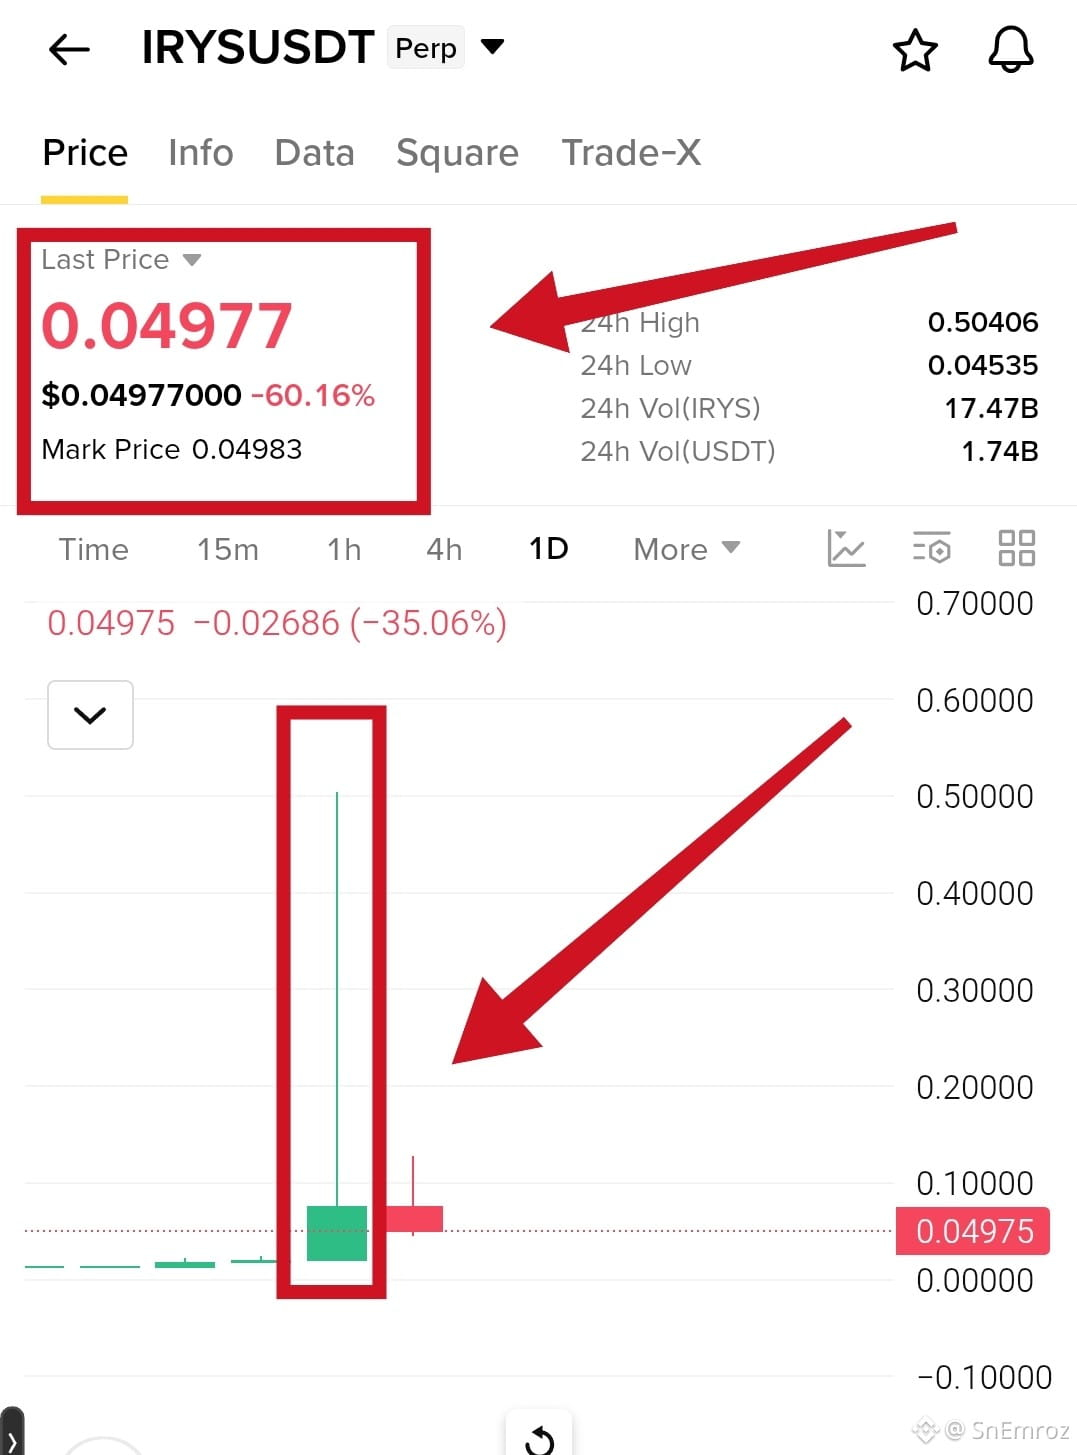
Look at $IRYS on the 1D chart. Price jumped from about 0.02 to 0.50 in one candle, then dropped back near 0.05 and is down almost 60% today. Anyone who bought near the top lost most of their money in hours.
{future}(IRYSUSDT)
How people lose
They see a green rocket and buy because they fear missing out
They buy at the top with no plan
They use high leverage on a coin with only a few candles on the chart
They trade without a stop loss
They hold and hope when price starts to fall
What to do instead
Never chase a vertical candle
Wait for the pump to cool and a clear level to form
Keep size small on new and wild coins
Always set a stop loss before you enter
Decide how much you can lose before the trade, not after
A big green candle does not mean more profit is coming. Many times it is the exit for early buyers.
The lines about leverage and having no plan are general lessons and not facts about this chart. The chart only shows the spike and the crash. Want a shorter version for Facebook or a more hype style?
Look at $IRYS on the 1D chart. Price jumped from about 0.02 to 0.50 in one candle, then dropped back near 0.05 and is down almost 60% today. Anyone who bought near the top lost most of their money in hours.
How people lose
They see a green rocket and buy because they fear missing out
They buy at the top with no plan
They use high leverage on a coin with only a few candles on the chart
They trade without a stop loss
They hold and hope when price starts to fall
What to do instead
Never chase a vertical candle
Wait for the pump to cool and a clear level to form
Keep size small on new and wild coins
Always set a stop loss before you enter
Decide how much you can lose before the trade, not after
A big green candle does not mean more profit is coming. Many times it is the exit for early buyers.
The lines about leverage and having no plan are general lessons and not facts about this chart. The chart only shows the spike and the crash. Want a shorter version for Facebook or a more hype style?
1
1.3k
·
--
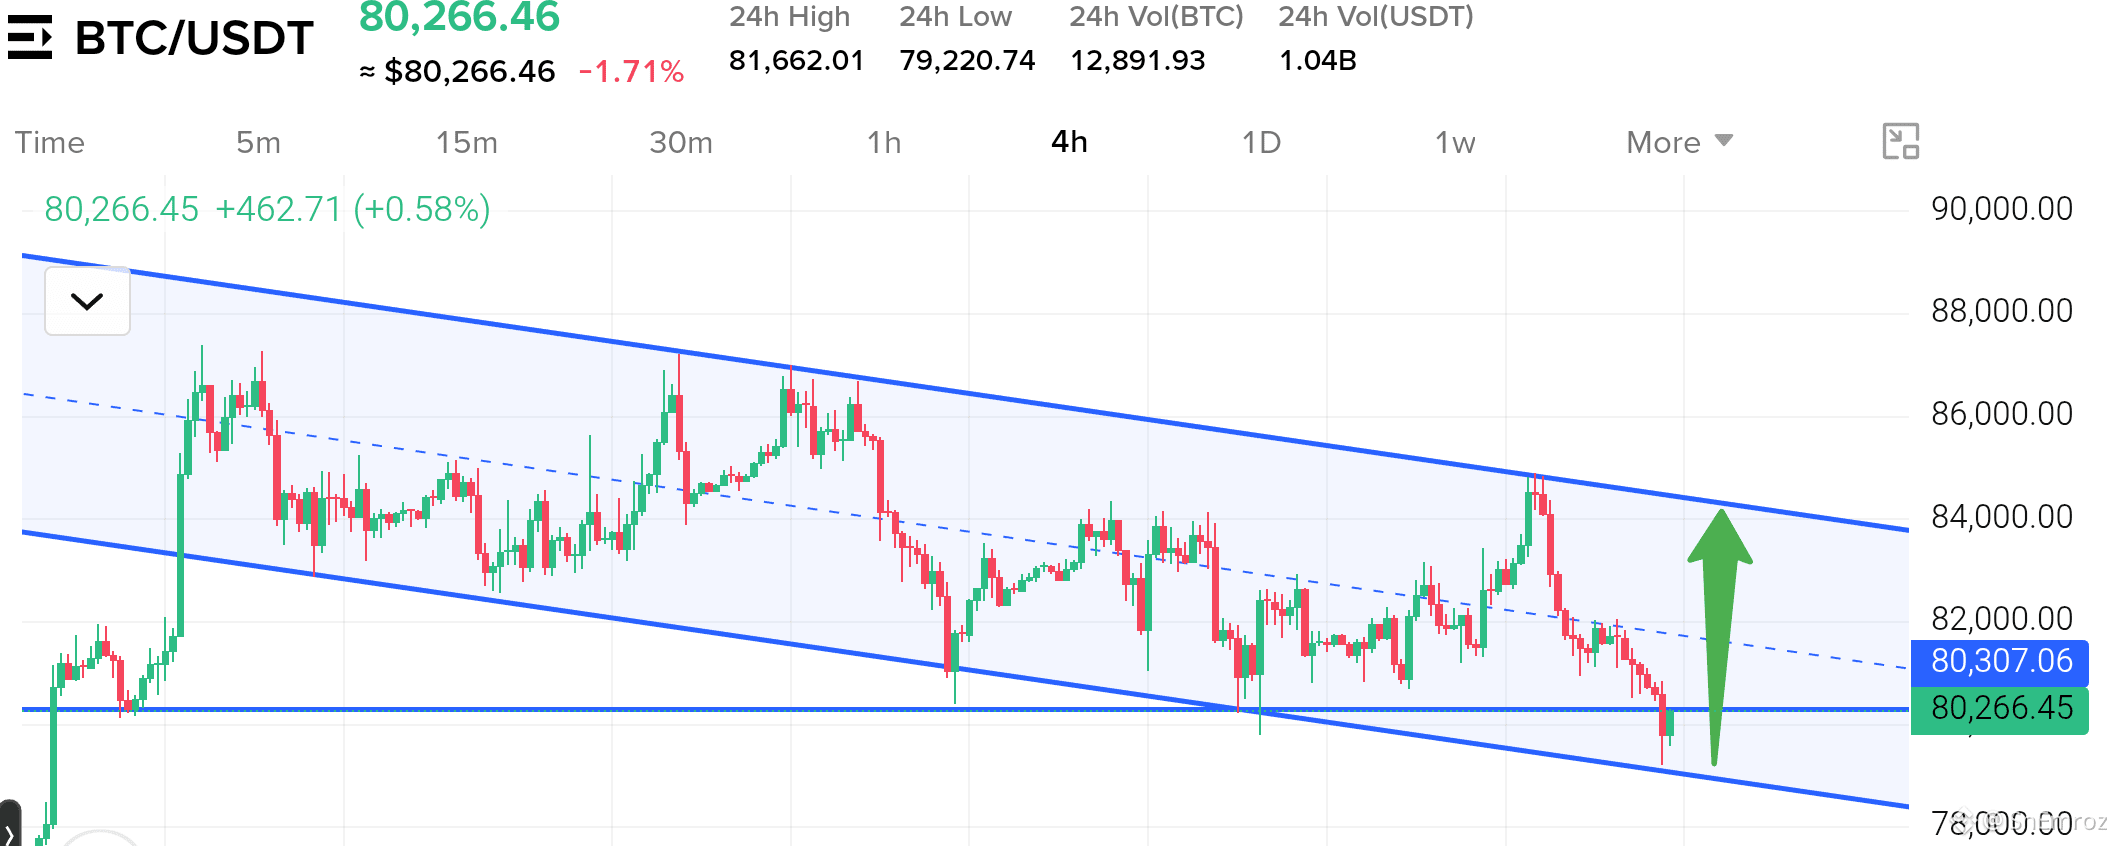
$BTC is stuck in a bearish channel on the 4h chart 🔴
Trend is down inside a falling channel with lower highs and lower lows
Price sits near 80266 right on the 80300 support line and close to the channel bottom around 79100
The last drop swept under 80000 to 79200 and came back with a long lower wick
Momentum is still bearish because price lost the middle line near 81800 and ran down hard from 84800
24h volume is 1.04B so sellers were active on this drop and the bounce candle is still small
Trend still pointing down.buyers trying to defend the channel bottom.
A bounce can reach 81800 to 82000 first but a 4h close below 79100 can send BTC to 78000
#BTC #BTCAnalysi $BTC
{future}(BTCUSDT)
$BTC is stuck in a bearish channel on the 4h chart 🔴
Trend is down inside a falling channel with lower highs and lower lows
Price sits near 80266 right on the 80300 support line and close to the channel bottom around 79100
The last drop swept under 80000 to 79200 and came back with a long lower wick
Momentum is still bearish because price lost the middle line near 81800 and ran down hard from 84800
24h volume is 1.04B so sellers were active on this drop and the bounce candle is still small
Trend still pointing down.buyers trying to defend the channel bottom.
A bounce can reach 81800 to 82000 first but a 4h close below 79100 can send BTC to 78000
#BTC #BTCAnalysi $BTC
1
354
·
--
Падение
My $DOT
{future}(DOTUSDT)
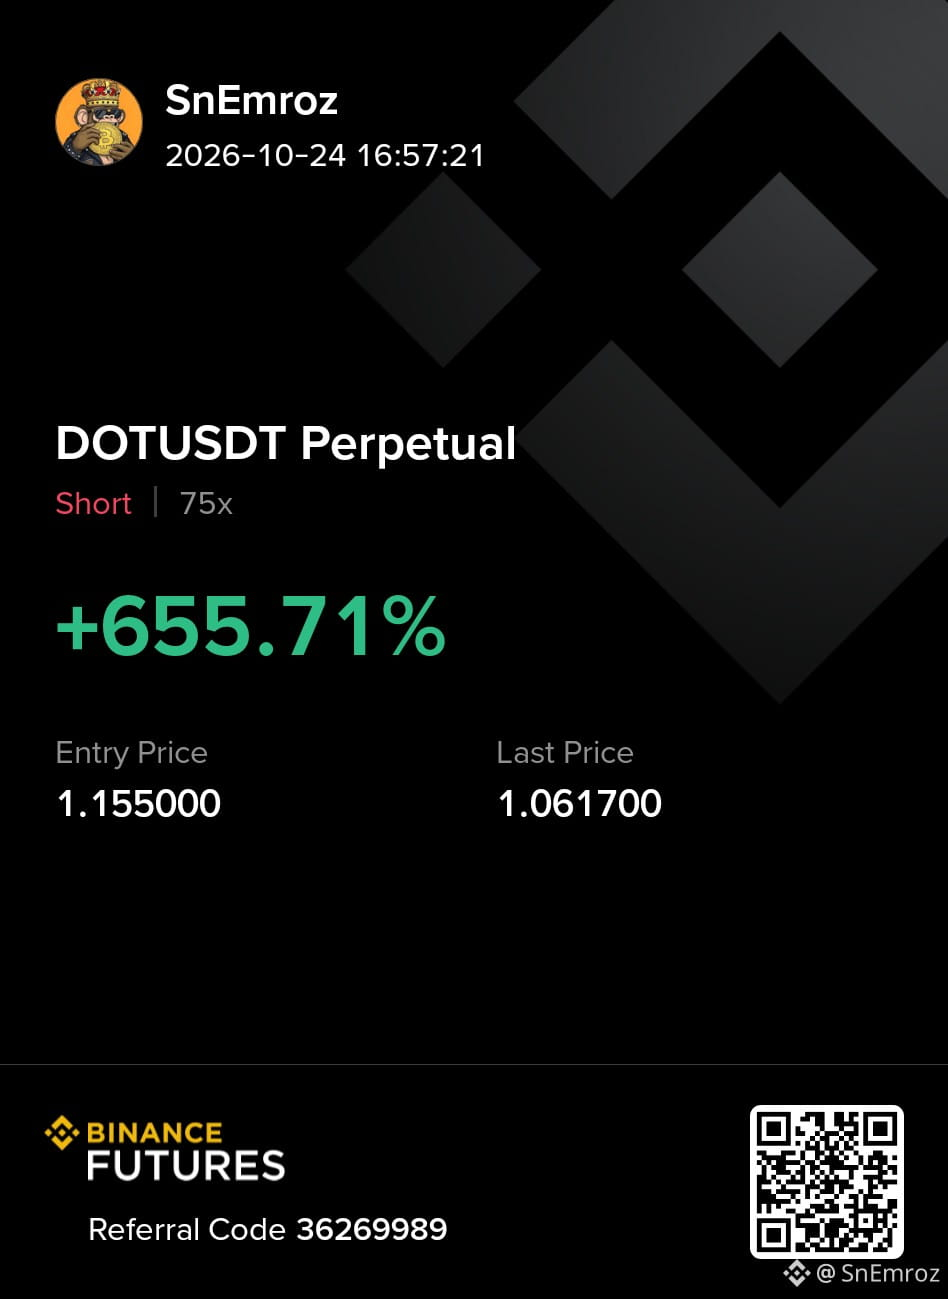
short hit all targets with +655.71% profit 🔥
TP1, TP2 and TP3 all done. Sellers were in control and I stayed with the plan till the end. Clean trade and no stress
Thanks to everyone who stayed with me on this one
More setups coming so follow and stay ready for the next one
My $DOT
short hit all targets with +655.71% profit 🔥
TP1, TP2 and TP3 all done. Sellers were in control and I stayed with the plan till the end. Clean trade and no stress
Thanks to everyone who stayed with me on this one
More setups coming so follow and stay ready for the next one
short hit all targets with +655.71% profit 🔥
TP1, TP2 and TP3 all done. Sellers were in control and I stayed with the plan till the end. Clean trade and no stress
Thanks to everyone who stayed with me on this one
More setups coming so follow and stay ready for the next one
1
335
·
--
Падение
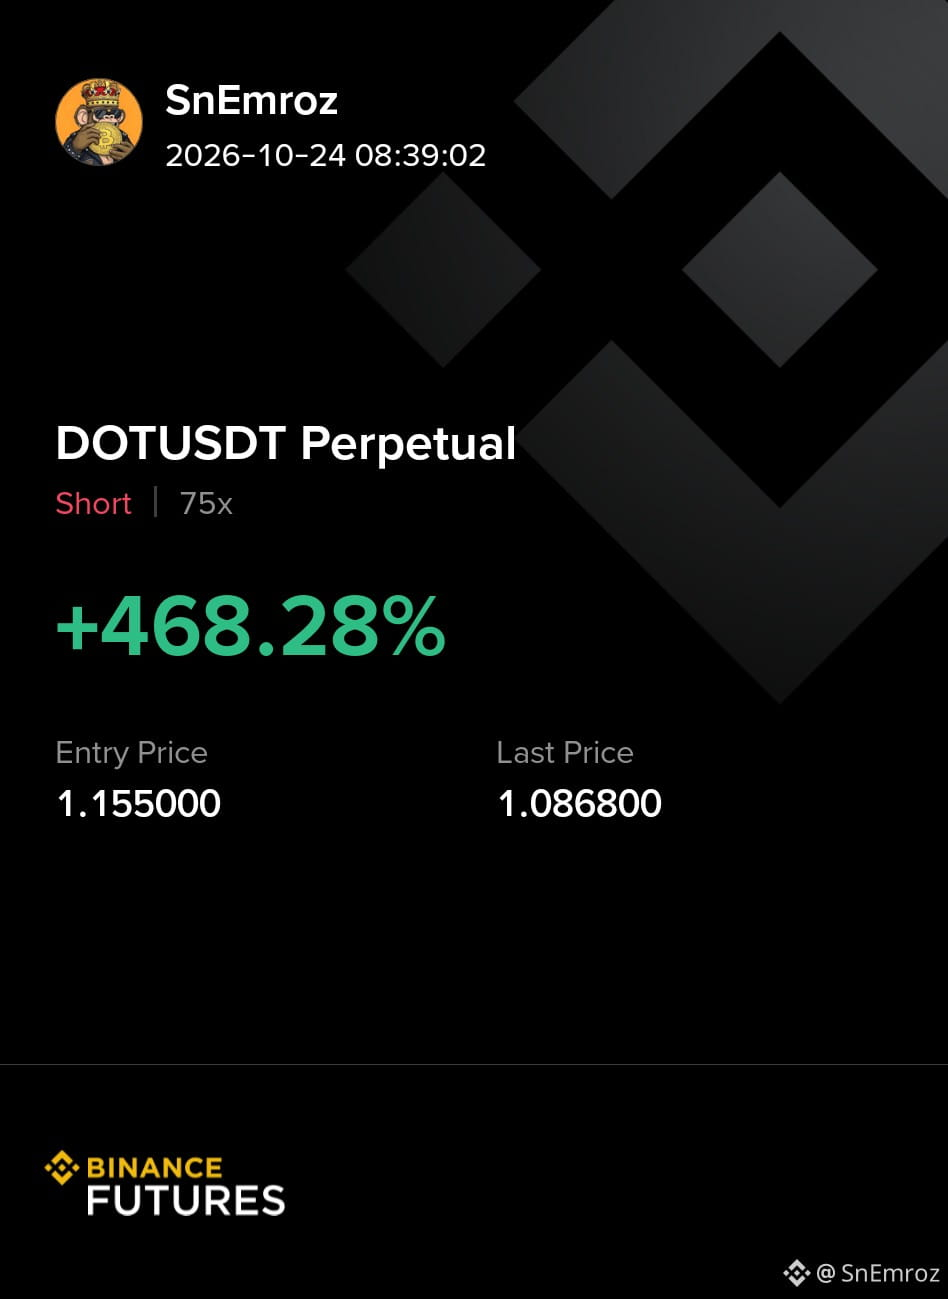
My $DOT short TP2 hit and the trade is still running with +468.28% profit 🔥
{future}(DOTUSDT)
Sellers were in control and I stayed with the plan. Clean trade and no stress
TP3 is still open so stay with me
More setups coming so follow and stay ready for the next one
Leverage multiplies both profit and loss so keep your size small and always use a stop loss
My $DOT short TP2 hit and the trade is still running with +468.28% profit 🔥
Sellers were in control and I stayed with the plan. Clean trade and no stress
TP3 is still open so stay with me
More setups coming so follow and stay ready for the next one
Leverage multiplies both profit and loss so keep your size small and always use a stop loss
Sellers were in control and I stayed with the plan. Clean trade and no stress
TP3 is still open so stay with me
More setups coming so follow and stay ready for the next one
Leverage multiplies both profit and loss so keep your size small and always use a stop loss
380
·
--
Рост
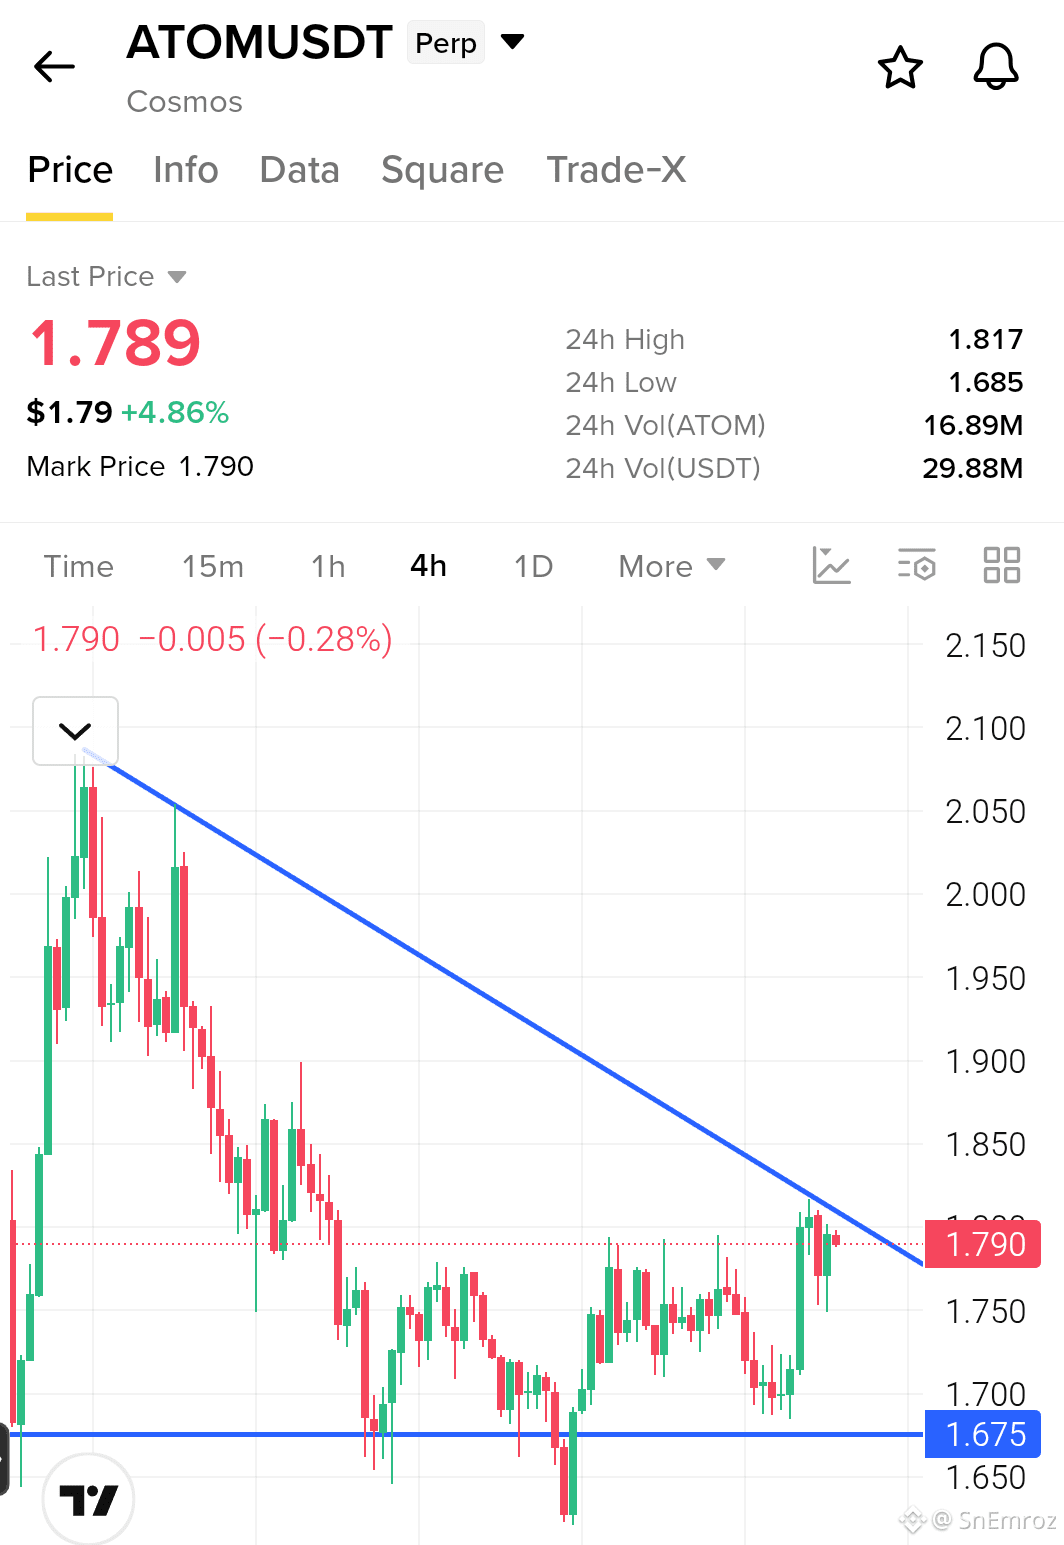
$ATOM 4H Chart
Facing Trend Line Resistance.
{future}(ATOMUSDT)
Atom sitting on $1.79. It's already bounced from major support around $1.675. In 4H Chart showing it’s fight with trend line resistance. If Atom Break the Trend Line with conformation, We can see it around $2
$ATOM 4H Chart
Facing Trend Line Resistance.
Atom sitting on $1.79. It's already bounced from major support around $1.675. In 4H Chart showing it’s fight with trend line resistance. If Atom Break the Trend Line with conformation, We can see it around $2
Facing Trend Line Resistance.
Atom sitting on $1.79. It's already bounced from major support around $1.675. In 4H Chart showing it’s fight with trend line resistance. If Atom Break the Trend Line with conformation, We can see it around $2
1
429
·
--
Рост
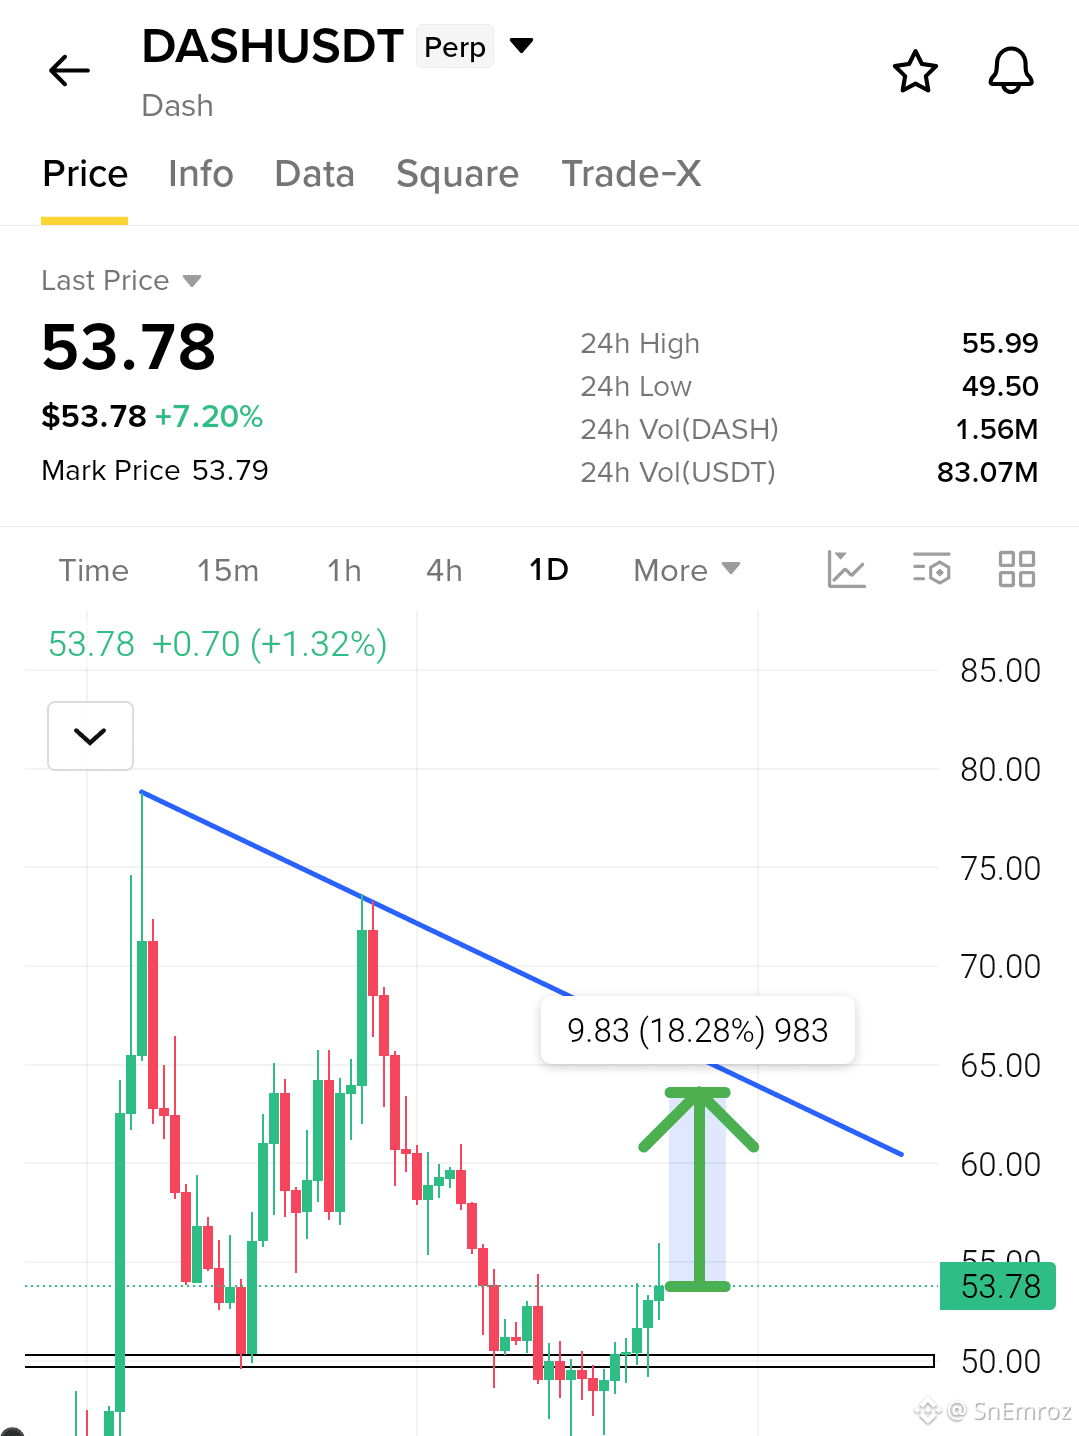
$DASH Analysis 1D Chart
Recovery Rally Moving Toward Descending Trendline Resistance
{future}(DASHUSDT)
DASH has rebounded from the $49.50–$50.00 support zone and climbed to $53.78. The recent candles show buyers regaining momentum after the prolonged decline, with price now approaching the descending trendline.
The immediate upside area is around $55–$56, if buying pressure continues we can easily seen $60–$64. And rejection near resistance could bring price back toward $52 and the $50 support zone.
$DASH Analysis 1D Chart
Recovery Rally Moving Toward Descending Trendline Resistance
DASH has rebounded from the $49.50–$50.00 support zone and climbed to $53.78. The recent candles show buyers regaining momentum after the prolonged decline, with price now approaching the descending trendline.
The immediate upside area is around $55–$56, if buying pressure continues we can easily seen $60–$64. And rejection near resistance could bring price back toward $52 and the $50 support zone.
1
879
·
--
Рост
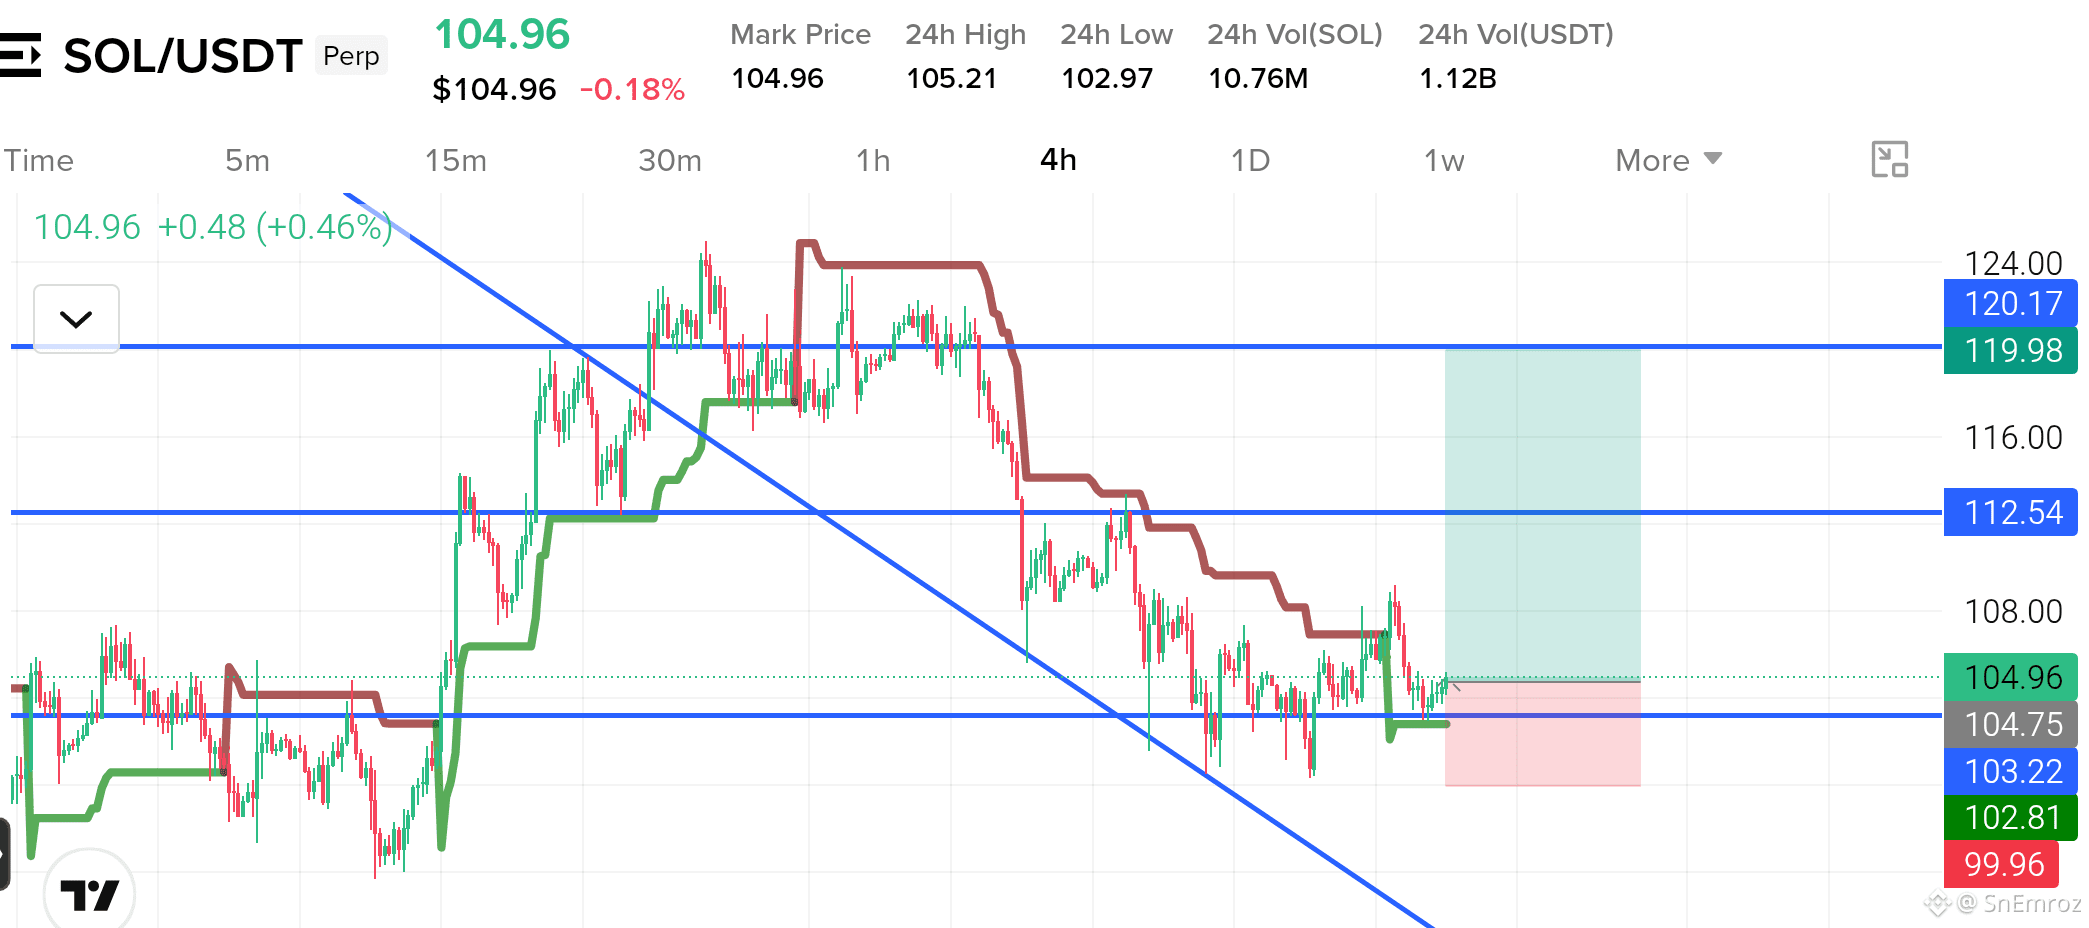
$SOL Long Setup | 4H Chart
Support Retest & Potential Recovery
SOL is holding near the $104 support zone after a prolonged downtrend. Price is attempting to stabilize around this area, while the descending trendline and resistance levels above remain key obstacles. If buyers defend support and price confirms a recovery, SOL could move toward $108.00, followed by the $112.54 resistance zone and potentially $119.98. A breakdown below nearby support would weaken the long setup.
Entry: $104.05
{future}(SOLUSDT)
Take Profits
TP1: $108.00 — Close 10%
TP2: $112.54 — Close another 80% (90% total)
TP3: $119.98 — Close remaining 10%
Stop Loss: $99.96
#SOL
$SOL Long Setup | 4H Chart
Support Retest & Potential Recovery
SOL is holding near the $104 support zone after a prolonged downtrend. Price is attempting to stabilize around this area, while the descending trendline and resistance levels above remain key obstacles. If buyers defend support and price confirms a recovery, SOL could move toward $108.00, followed by the $112.54 resistance zone and potentially $119.98. A breakdown below nearby support would weaken the long setup.
Entry: $104.05
Take Profits
TP1: $108.00 — Close 10%
TP2: $112.54 — Close another 80% (90% total)
TP3: $119.98 — Close remaining 10%
Stop Loss: $99.96
#SOL
2
945
·
--
Рост
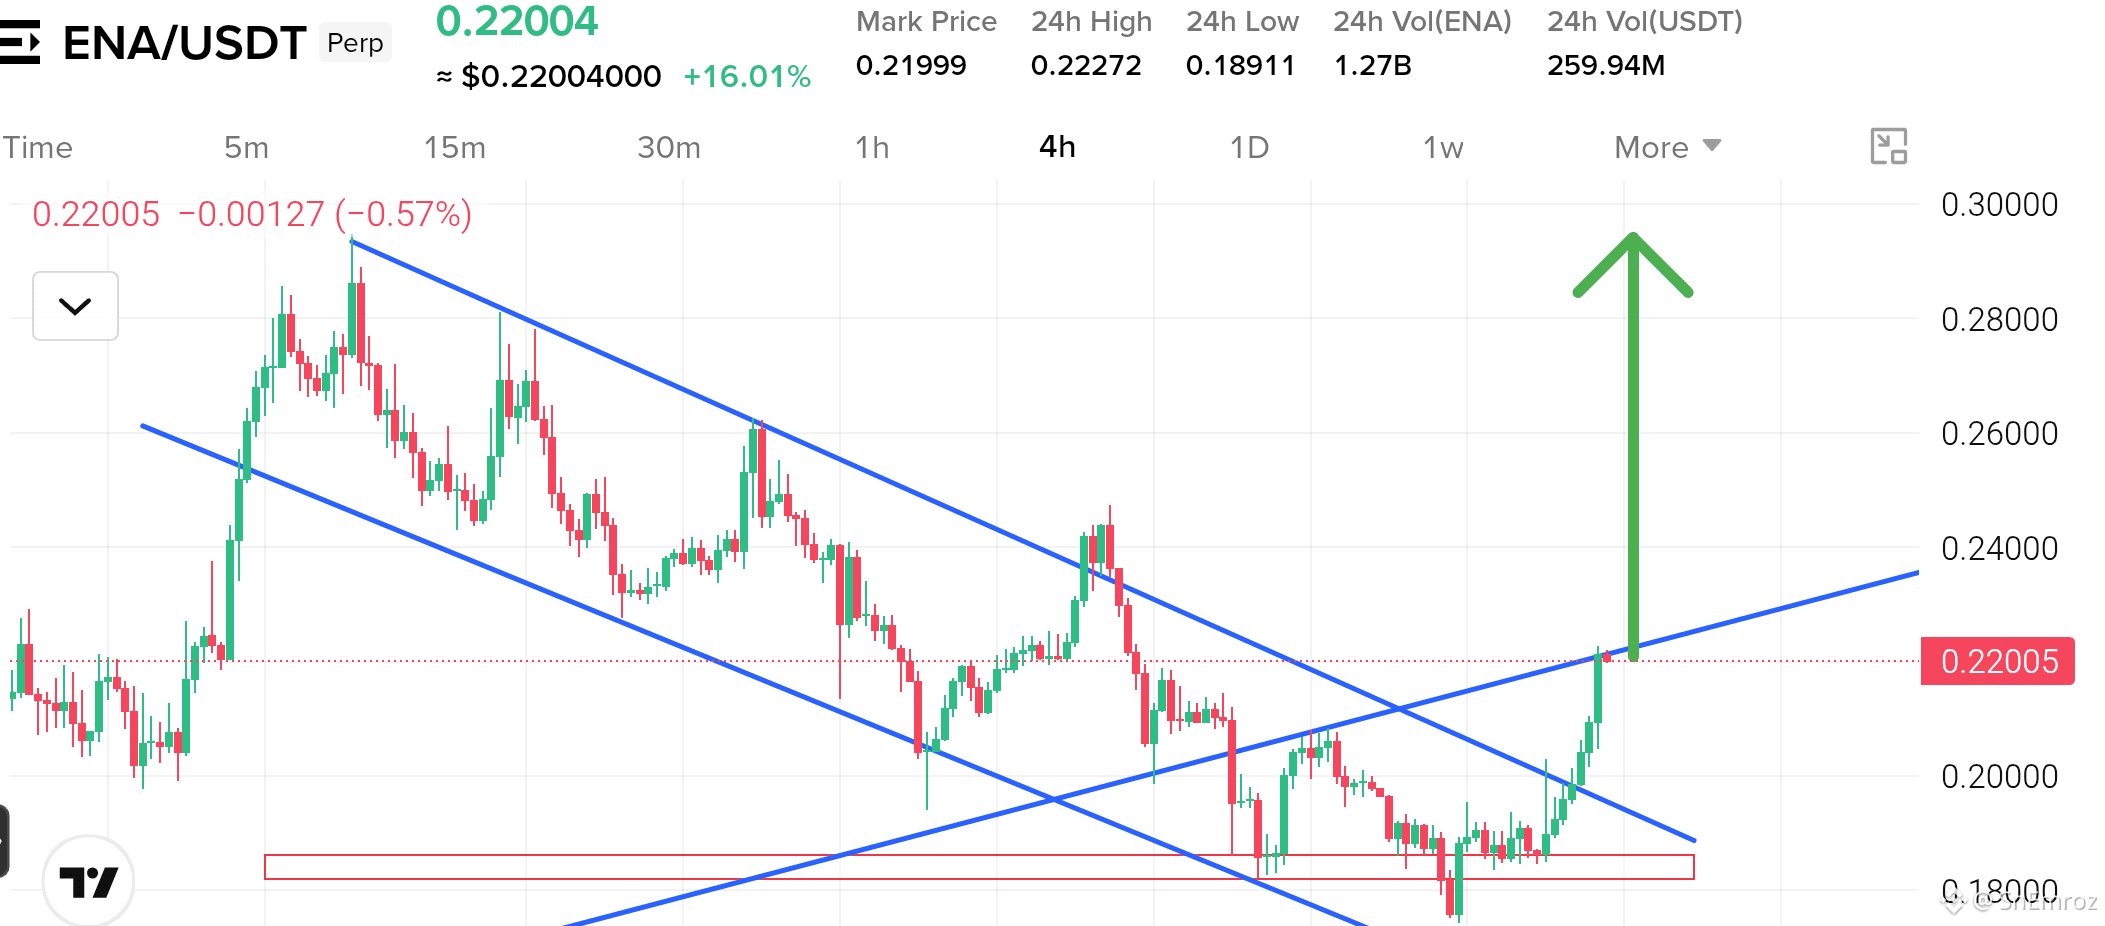
$ENA is showing clean strength on the 4h chart 🟢
• Price sits near 0.2200 and is up 16% today
• Structure broke out of the falling channel after a long downtrend
• Buyers defended the 0.1850 support zone and pushed price up fast
• Strong green candles with 259M volume back the move
• Price is now testing the rising trendline near 0.2200
You see buyers in control
You see momentum shifting fast
A clean close above this trendline can send ENA toward 0.2400 and then 0.2800🔥
{future}(ENAUSDT)
$ENA is showing clean strength on the 4h chart 🟢
• Price sits near 0.2200 and is up 16% today
• Structure broke out of the falling channel after a long downtrend
• Buyers defended the 0.1850 support zone and pushed price up fast
• Strong green candles with 259M volume back the move
• Price is now testing the rising trendline near 0.2200
You see buyers in control
You see momentum shifting fast
A clean close above this trendline can send ENA toward 0.2400 and then 0.2800🔥
1
467
Войдите, чтобы посмотреть больше материала
Присоединяйтесь к пользователям криптовалют по всему миру на Binance Square
⚡️ Получайте новейшую и полезную информацию о криптоактивах.
💬 Нам доверяет крупнейшая в мире криптобиржа.
👍 Получите достоверные аналитические данные от верифицированных создателей контента.
Эл. почта/номер телефона
В тренде
FedWatch
Просмотров: 16.3M
39,382 обсуждают
🚨 🇺🇸 PETER SCHIFF JUST THREW A BIG WARNING AT THE FED!
Peter Schiff is calling Kevin Warsh’s tough talk on inflation a “bluff,” and his prediction could have major implications for the markets.
Schiff believes the Fed could eventually return to money printing through quantitative easing (QE) and even cut interest rates next year, despite inflation continuing to rise.
Think about that for a moment.
🔥 Inflation could remain a problem. 🔥 The Fed could still move toward easier monetary policy. 🔥 More liquidity could flow into financial markets.
If this scenario plays out, it could create a very different market environment for stocks, gold, Bitcoin, and the wider crypto market.
But there’s a catch: if inflation stays high, the Fed could face a difficult choice between fighting rising prices and supporting the economy.
Will Warsh stick to a tough inflation policy, or will the Fed eventually change direction?
The next move could matter a lot for investors.
#FedWatch #EarningsSeason #USMidtermElections #BrazilCryptoExchangesMustApplyForLicensesByFriday #StanDruckenmillerBecomesInvestorInTradeXYZ
Jackson Liam
·Лайков: 4
·Просмотров: 8.3k
EarningsSeason
Просмотров: 6.4M
32,082 обсуждают
USMidtermElections
Просмотров: 40,850
614 обсуждают