

James_ZEC
6.7k Публикации

James_ZEC
Отправить жалобу
Заблокировать пользователя
Square Content Creator
Открытая сделка
Трейдер с регулярными сделками
1.8 г
7 подписок(и/а)
7.9K+ подписчиков(а)
8.0K+ понравилось
Посты
Портфель
Все
Цитирования
Видео
Активно
·
--
Рост
I Hope the Funds Will Be Returned – CZ of Binance Is a Great Person
In difficult times, hope and patience become our greatest strengths. When people's hard-earned money is at risk, it is natural to feel worried and disappointed. However, I still believe that there is room for a positive outcome.
My sincere hope is that the affected users will receive their funds back and that every unresolved issue will be addressed fairly and transparently.
I have great respect for CZ (Changpeng Zhao). His contribution to the cryptocurrency industry and his role in building Binance into one of the world's leading crypto exchanges are remarkable. In my opinion, a person's character is not defined only by success, but also by how they respond to challenges and treat the people who trust them.
I hope CZ and the Binance team will continue working toward solutions that protect users' interests and restore confidence in the community. For millions of crypto users, trust is just as important as technology and innovation.
We are not asking for anything unreasonable. We simply want fairness, transparency, and the return of people's hard-earned money wherever possible.
I believe that difficult situations should be handled with responsibility, patience, and honest communication. Let's remain hopeful while following official updates and verified information.
Hope is still alive. Trust is still important. And my sincere wish is that every affected user gets a positive outcome and their funds returned.
Sometimes, a little hope makes all the difference.
$Q
{future}(QUSDT)
$PARTI
{future}(PARTIUSDT)
$MAGMA
{future}(MAGMAUSDT)
I Hope the Funds Will Be Returned – CZ of Binance Is a Great Person
In difficult times, hope and patience become our greatest strengths. When people's hard-earned money is at risk, it is natural to feel worried and disappointed. However, I still believe that there is room for a positive outcome.
My sincere hope is that the affected users will receive their funds back and that every unresolved issue will be addressed fairly and transparently.
I have great respect for CZ (Changpeng Zhao). His contribution to the cryptocurrency industry and his role in building Binance into one of the world's leading crypto exchanges are remarkable. In my opinion, a person's character is not defined only by success, but also by how they respond to challenges and treat the people who trust them.
I hope CZ and the Binance team will continue working toward solutions that protect users' interests and restore confidence in the community. For millions of crypto users, trust is just as important as technology and innovation.
We are not asking for anything unreasonable. We simply want fairness, transparency, and the return of people's hard-earned money wherever possible.
I believe that difficult situations should be handled with responsibility, patience, and honest communication. Let's remain hopeful while following official updates and verified information.
Hope is still alive. Trust is still important. And my sincere wish is that every affected user gets a positive outcome and their funds returned.
Sometimes, a little hope makes all the difference.
$Q
$PARTI
$MAGMA

224
·
--
Рост
$BTC Sharp Rebound, Recovery Long Opportunity
Long Setup
Entry Zone: 77,500 – 78,200
Stop Loss: 76,200
TP1: 79,800
TP2: 81,000
TP3: 81,900
Why This Setup?
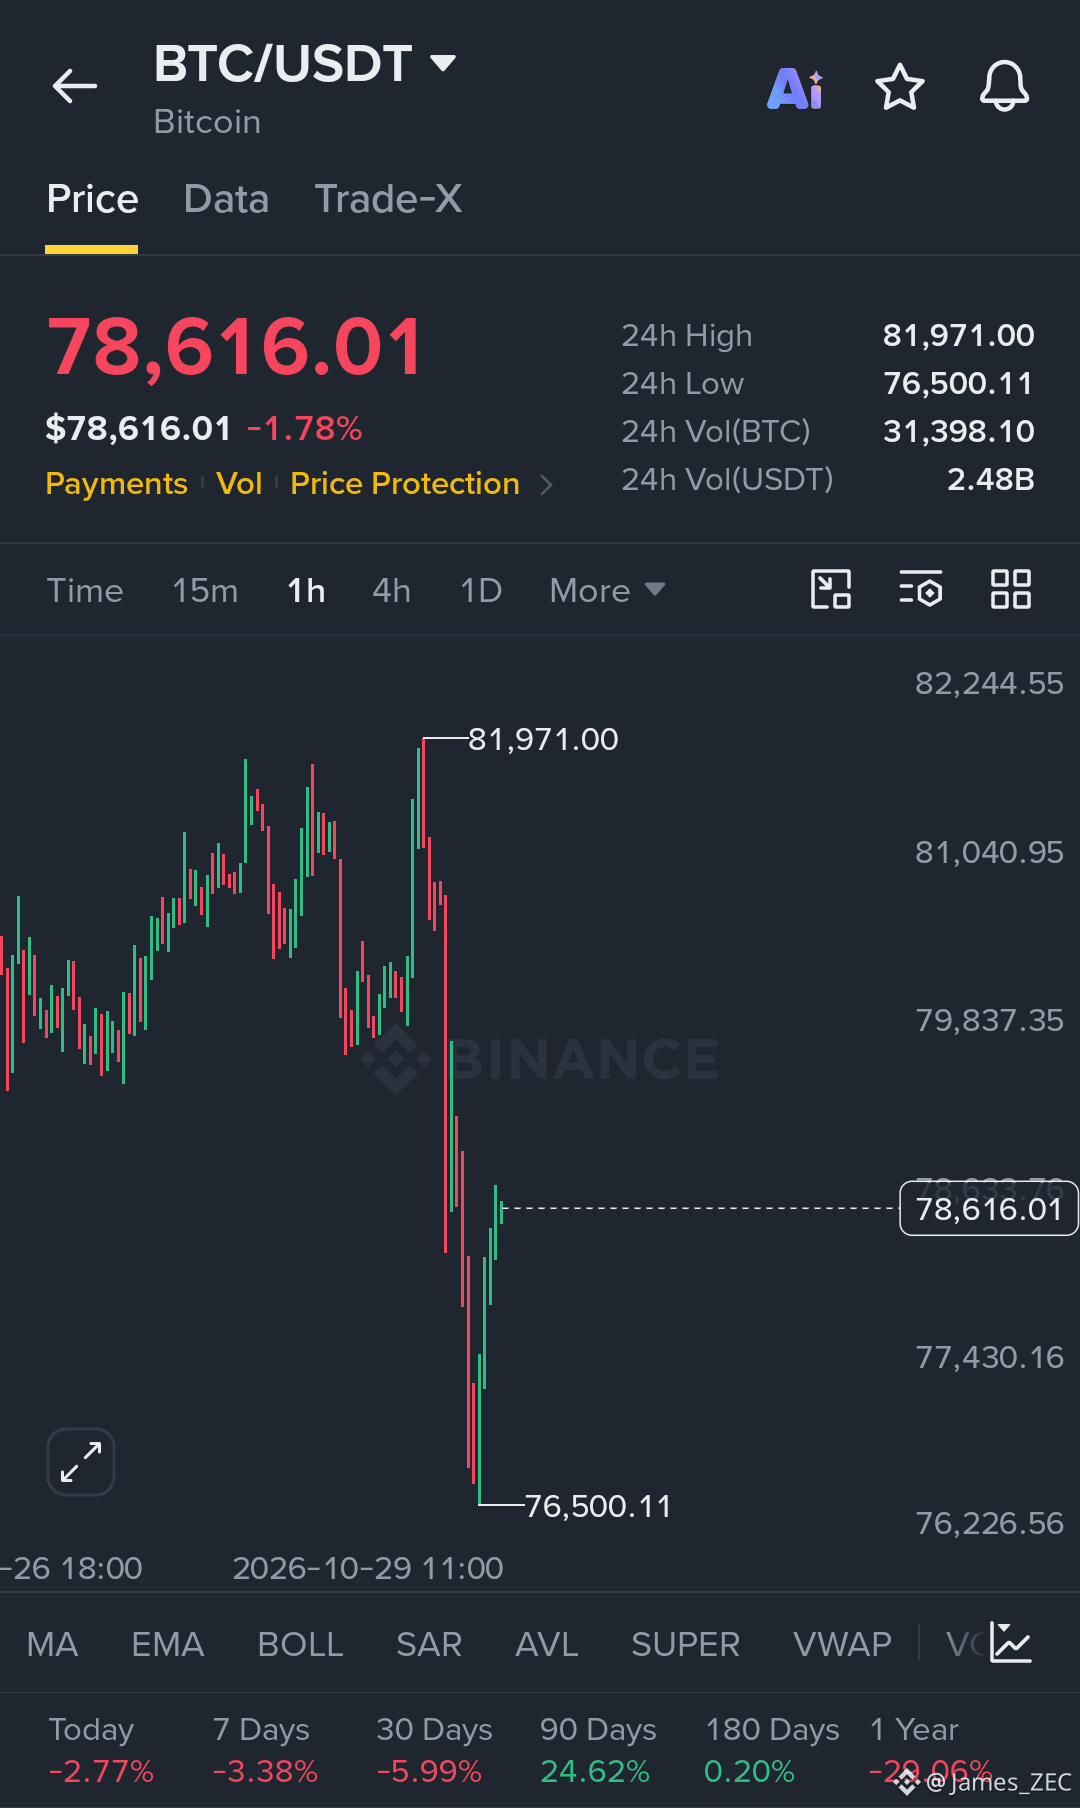
Bitcoin has experienced a sharp correction from 81,971, reaching a recent low of 76,500. Buyers have stepped in near the lower region, pushing BTC back toward 78,616.
The immediate focus is whether buyers can defend the 77,400–78,000 support area. Holding this region could help establish a short-term recovery structure.
The first major resistance stands near 79,800. A sustained move above this level could bring 81,000 into focus, followed by a retest of the 81,900 resistance region.
Entry Strategy: Avoid chasing the initial rebound. Prefer a controlled pullback into the entry zone with bullish confirmation.
Confirmation Trigger: A strong 1-hour close above 79,000 would strengthen the recovery scenario.
Invalidation: A decisive break below 76,200 cancels this long setup.
Bitcoin remains volatile after the sharp selloff. Protect capital and wait for confirmation before entering.
$PARTI
{future}(PARTIUSDT)
$MAGMA
{future}(MAGMAUSDT)
{future}(BTCUSDT)
$BTC Sharp Rebound, Recovery Long Opportunity
Long Setup
Entry Zone: 77,500 – 78,200
Stop Loss: 76,200
TP1: 79,800
TP2: 81,000
TP3: 81,900
Why This Setup?
Bitcoin has experienced a sharp correction from 81,971, reaching a recent low of 76,500. Buyers have stepped in near the lower region, pushing BTC back toward 78,616.
The immediate focus is whether buyers can defend the 77,400–78,000 support area. Holding this region could help establish a short-term recovery structure.
The first major resistance stands near 79,800. A sustained move above this level could bring 81,000 into focus, followed by a retest of the 81,900 resistance region.
Entry Strategy: Avoid chasing the initial rebound. Prefer a controlled pullback into the entry zone with bullish confirmation.
Confirmation Trigger: A strong 1-hour close above 79,000 would strengthen the recovery scenario.
Invalidation: A decisive break below 76,200 cancels this long setup.
Bitcoin remains volatile after the sharp selloff. Protect capital and wait for confirmation before entering.
$PARTI
$MAGMA
117
·
--
Рост
$BULLA Recovery Long Setup
Long Setup
Entry Zone: 0.0680 – 0.0710
Stop Loss: 0.0620
TP1: 0.0815
TP2: 0.0900
TP3: 0.1050
Why This Setup?
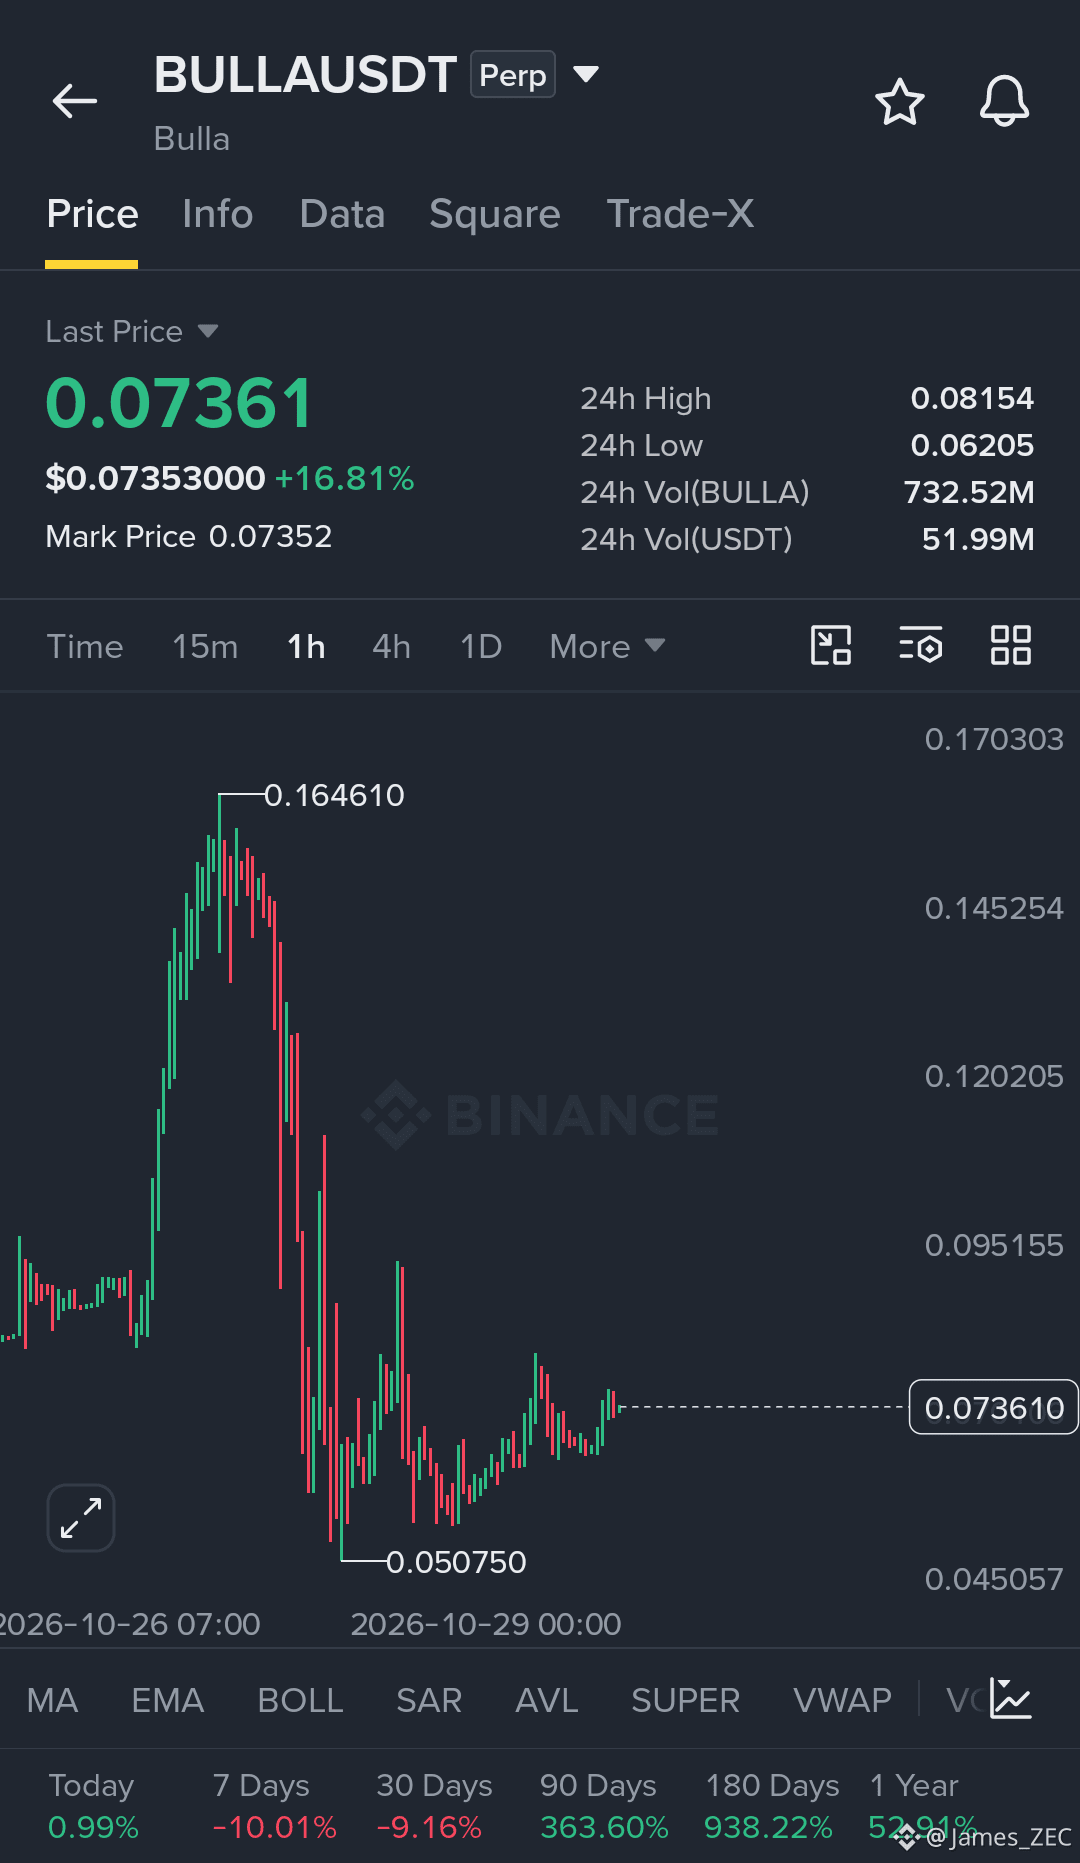
BULLA is attempting to establish a recovery base after a sharp correction from 0.164610 to the 0.050750 low. The price is now trading near 0.07361, with recent candles suggesting gradual buying interest and a potential shift toward short-term recovery.
The immediate challenge is resistance around 0.0780–0.0815, where sellers may attempt to slow the advance. A strong breakout above 0.0815, supported by increasing volume, could open the way toward 0.0900 and potentially 0.1050.
Entry Strategy: Prefer a pullback into the entry zone followed by bullish confirmation. Avoid chasing sudden green candles.
Invalidation: A decisive move below 0.0620 would weaken the recovery scenario.
The chart shows early recovery potential, but volatility remains high. Wait for confirmation and manage risk carefully.
$PARTI
{future}(PARTIUSDT)
$IDOL
{future}(IDOLUSDT)
{future}(BULLAUSDT)
$BULLA Recovery Long Setup
Long Setup
Entry Zone: 0.0680 – 0.0710
Stop Loss: 0.0620
TP1: 0.0815
TP2: 0.0900
TP3: 0.1050
Why This Setup?
BULLA is attempting to establish a recovery base after a sharp correction from 0.164610 to the 0.050750 low. The price is now trading near 0.07361, with recent candles suggesting gradual buying interest and a potential shift toward short-term recovery.
The immediate challenge is resistance around 0.0780–0.0815, where sellers may attempt to slow the advance. A strong breakout above 0.0815, supported by increasing volume, could open the way toward 0.0900 and potentially 0.1050.
Entry Strategy: Prefer a pullback into the entry zone followed by bullish confirmation. Avoid chasing sudden green candles.
Invalidation: A decisive move below 0.0620 would weaken the recovery scenario.
The chart shows early recovery potential, but volatility remains high. Wait for confirmation and manage risk carefully.
$PARTI
$IDOL
187
·
--
Рост
$BLUR Long Setup
Entry Zone: 0.00820 – 0.00840
Stop Loss: 0.00785
TP1: 0.00872
TP2: 0.00890
TP3: 0.00923
Chart Analysis
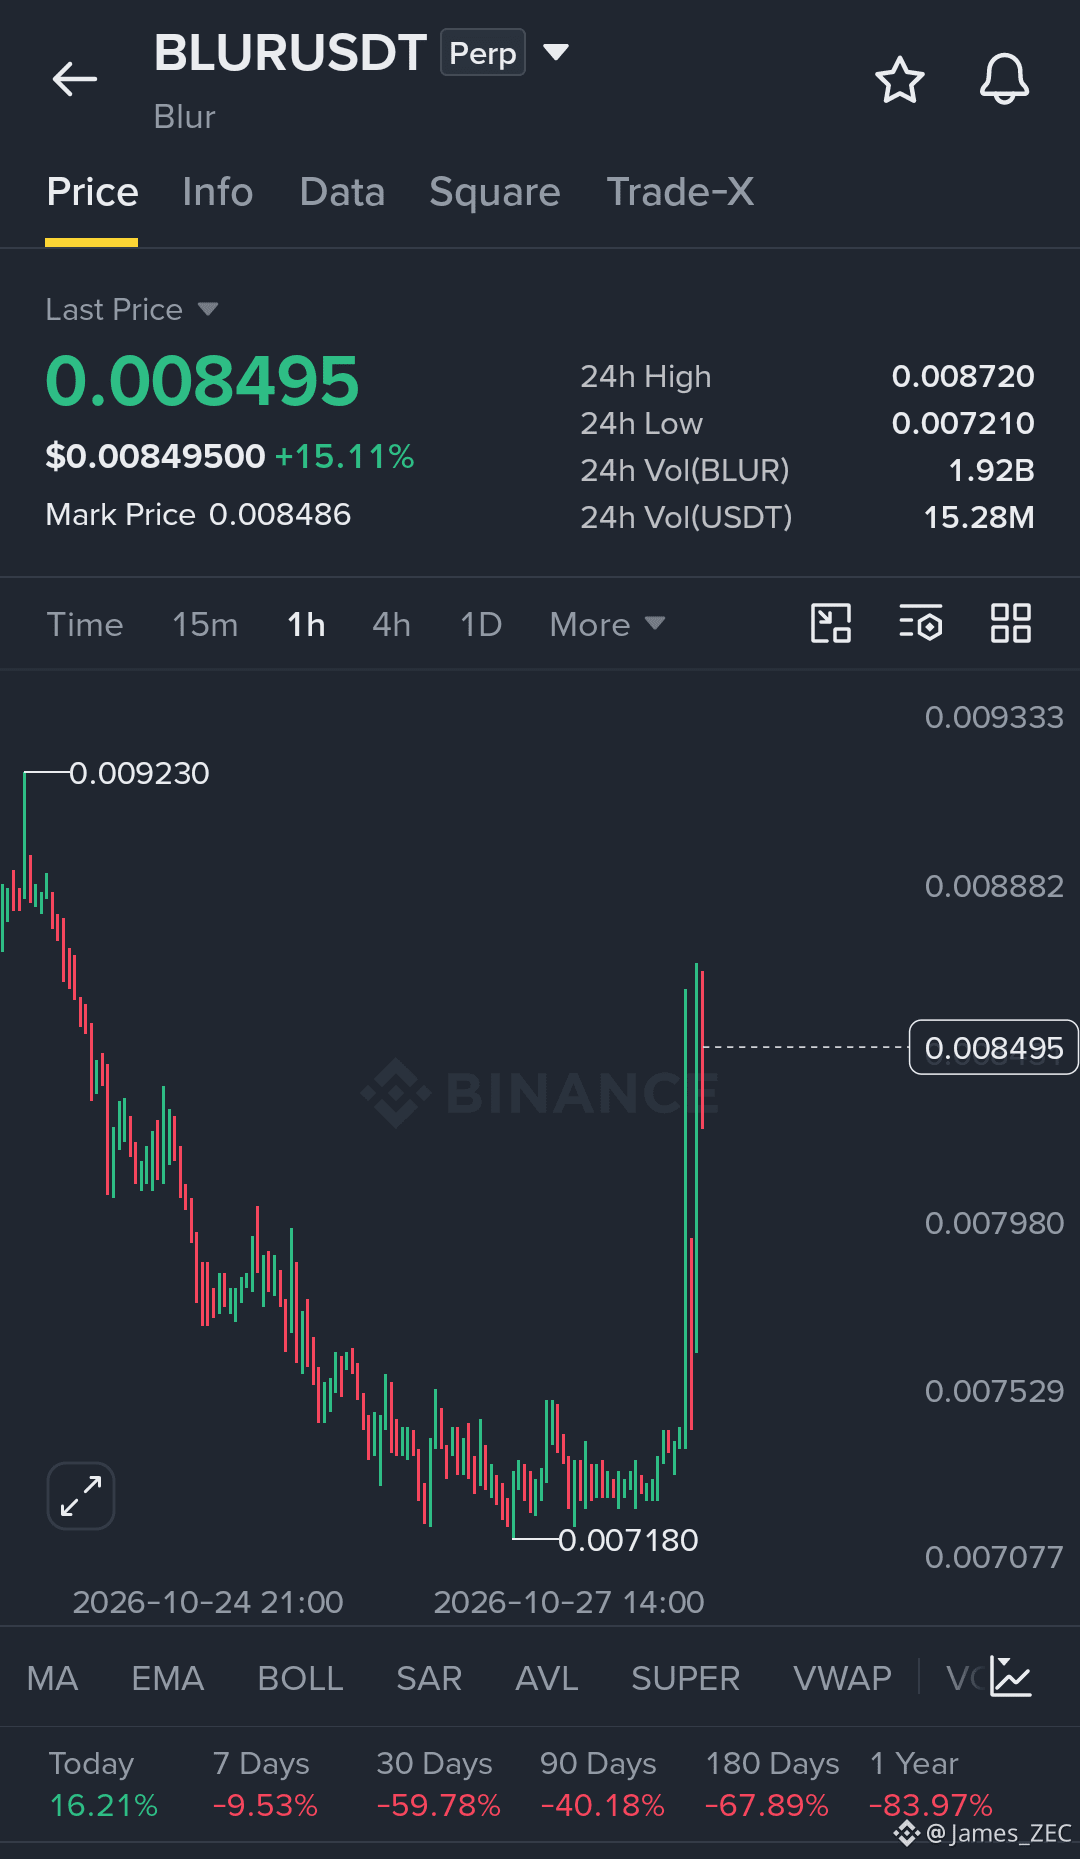
BLURUSDT has bounced sharply from the 0.007180 low, with a sudden surge in buying activity pushing price toward 0.008720. The current price near 0.008495 is holding above the earlier consolidation area, but the rapid move increases the risk of a pullback.
Entry Strategy: Avoid chasing the spike. Look for a pullback into the entry zone and bullish confirmation before entering. A sustained break above 0.008720 could open the way toward 0.00890 and the previous high near 0.009230.
Invalidation: A breakdown below 0.00785 weakens this long setup.
Wait for confirmation, manage position size carefully, and remember that all targets are conditional, not guaranteed.
$XAN
{future}(XANUSDT)
$EVAA
{future}(EVAAUSDT)
{future}(BLURUSDT)
$BLUR Long Setup
Entry Zone: 0.00820 – 0.00840
Stop Loss: 0.00785
TP1: 0.00872
TP2: 0.00890
TP3: 0.00923
Chart Analysis
BLURUSDT has bounced sharply from the 0.007180 low, with a sudden surge in buying activity pushing price toward 0.008720. The current price near 0.008495 is holding above the earlier consolidation area, but the rapid move increases the risk of a pullback.
Entry Strategy: Avoid chasing the spike. Look for a pullback into the entry zone and bullish confirmation before entering. A sustained break above 0.008720 could open the way toward 0.00890 and the previous high near 0.009230.
Invalidation: A breakdown below 0.00785 weakens this long setup.
Wait for confirmation, manage position size carefully, and remember that all targets are conditional, not guaranteed.
$XAN
$EVAA
382
·
--
Рост
$GIGGLE Recovery Continuation Long Setup
Long Setup
Entry Zone: 30.90 – 31.20
Stop Loss: 30.20
TP1: 31.80
TP2: 32.20
TP3: 32.50
Chart Analysis
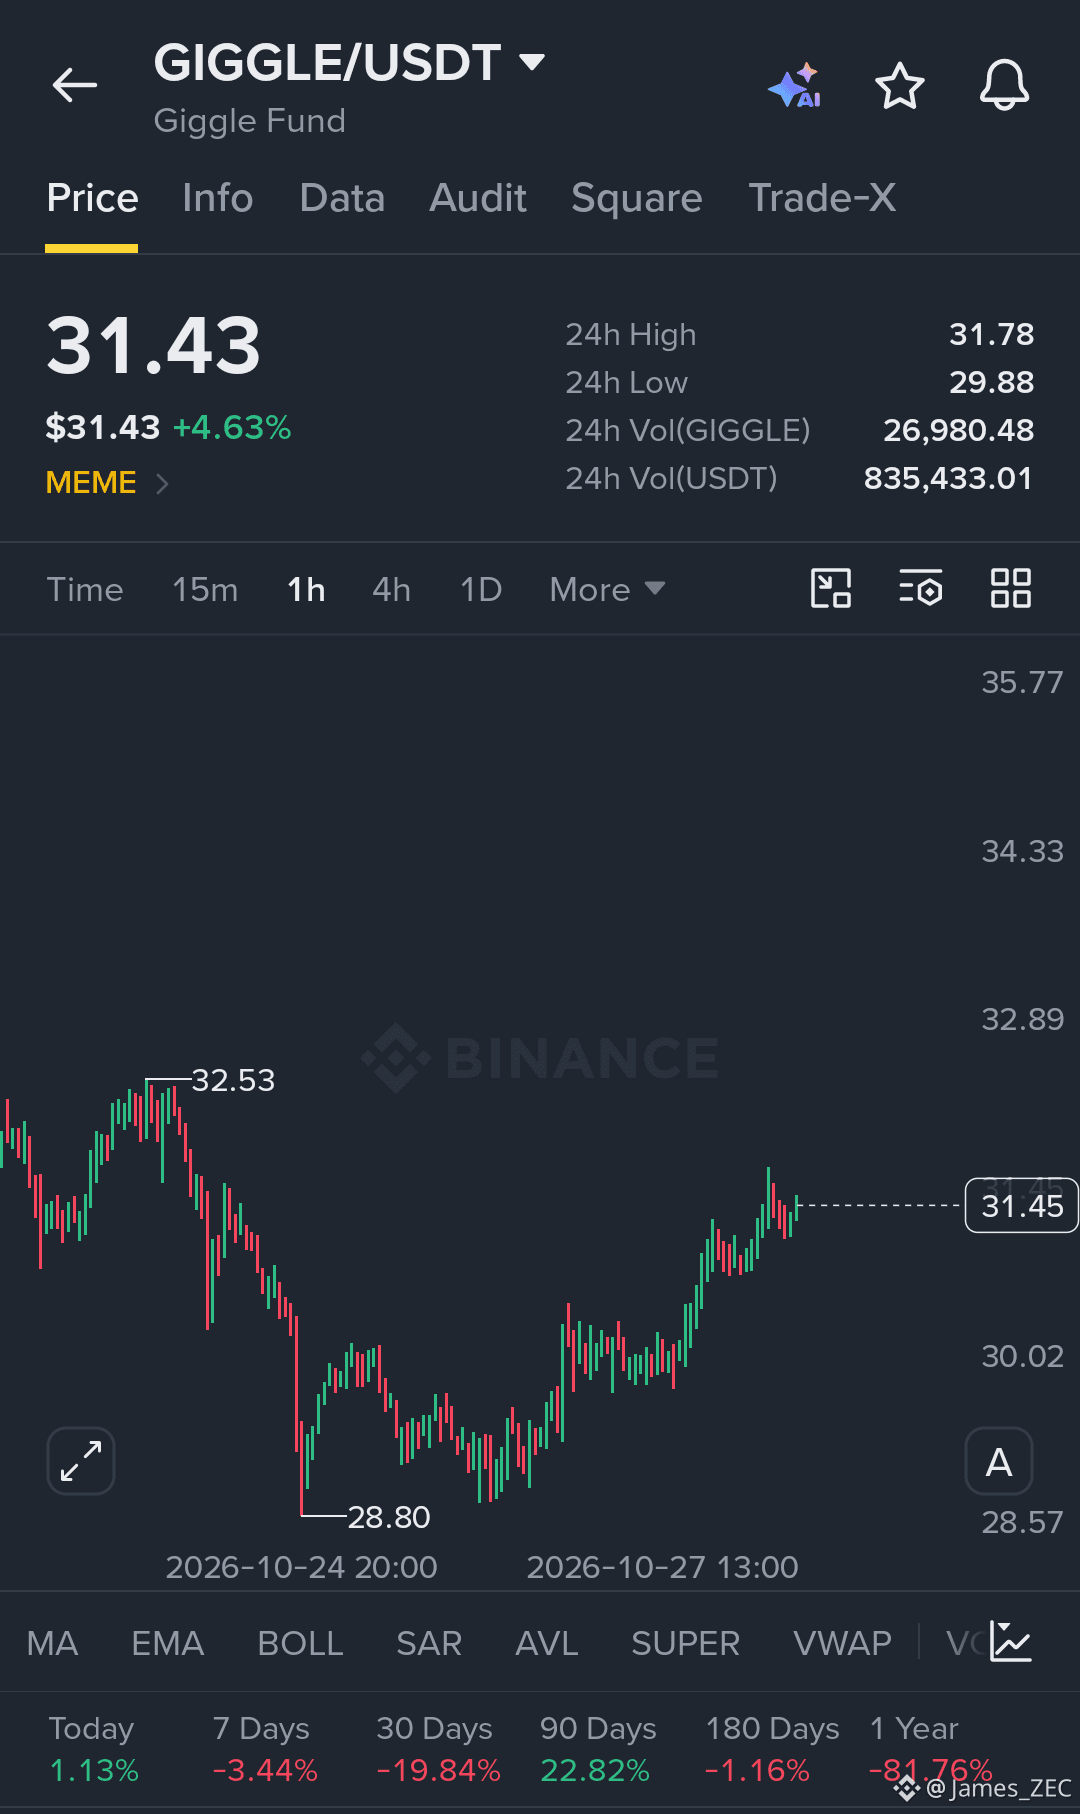
GIGGLE has recovered from the 28.80 swing low and is forming higher lows as buyers push price toward the 31.78–32.53 resistance area. The current price near 31.43 shows recovery momentum, but resistance remains a key test.
Entry Strategy: Wait for a pullback into 30.90–31.20 with bullish confirmation. A sustained breakout above 31.80 could open the path toward 32.20 and 32.50.
Invalidation: A sustained move below 30.20 weakens the bullish setup.
Risk only 1–3% of your deposit per trade. Targets are potential levels, not guaranteed outcomes.
$EVAA
{future}(EVAAUSDT)
$XAN
{future}(XANUSDT)
{future}(GIGGLEUSDT)
$GIGGLE Recovery Continuation Long Setup
Long Setup
Entry Zone: 30.90 – 31.20
Stop Loss: 30.20
TP1: 31.80
TP2: 32.20
TP3: 32.50
Chart Analysis
GIGGLE has recovered from the 28.80 swing low and is forming higher lows as buyers push price toward the 31.78–32.53 resistance area. The current price near 31.43 shows recovery momentum, but resistance remains a key test.
Entry Strategy: Wait for a pullback into 30.90–31.20 with bullish confirmation. A sustained breakout above 31.80 could open the path toward 32.20 and 32.50.
Invalidation: A sustained move below 30.20 weakens the bullish setup.
Risk only 1–3% of your deposit per trade. Targets are potential levels, not guaranteed outcomes.
$EVAA
$XAN
367
·
--
Рост
$ETHW Breakout Continuation Long Setup
Long Setup
Entry Zone: 0.2580 – 0.2640
Stop Loss: 0.2490
TP1: 0.2800
TP2: 0.2960
TP3: 0.3130
Chart Analysis
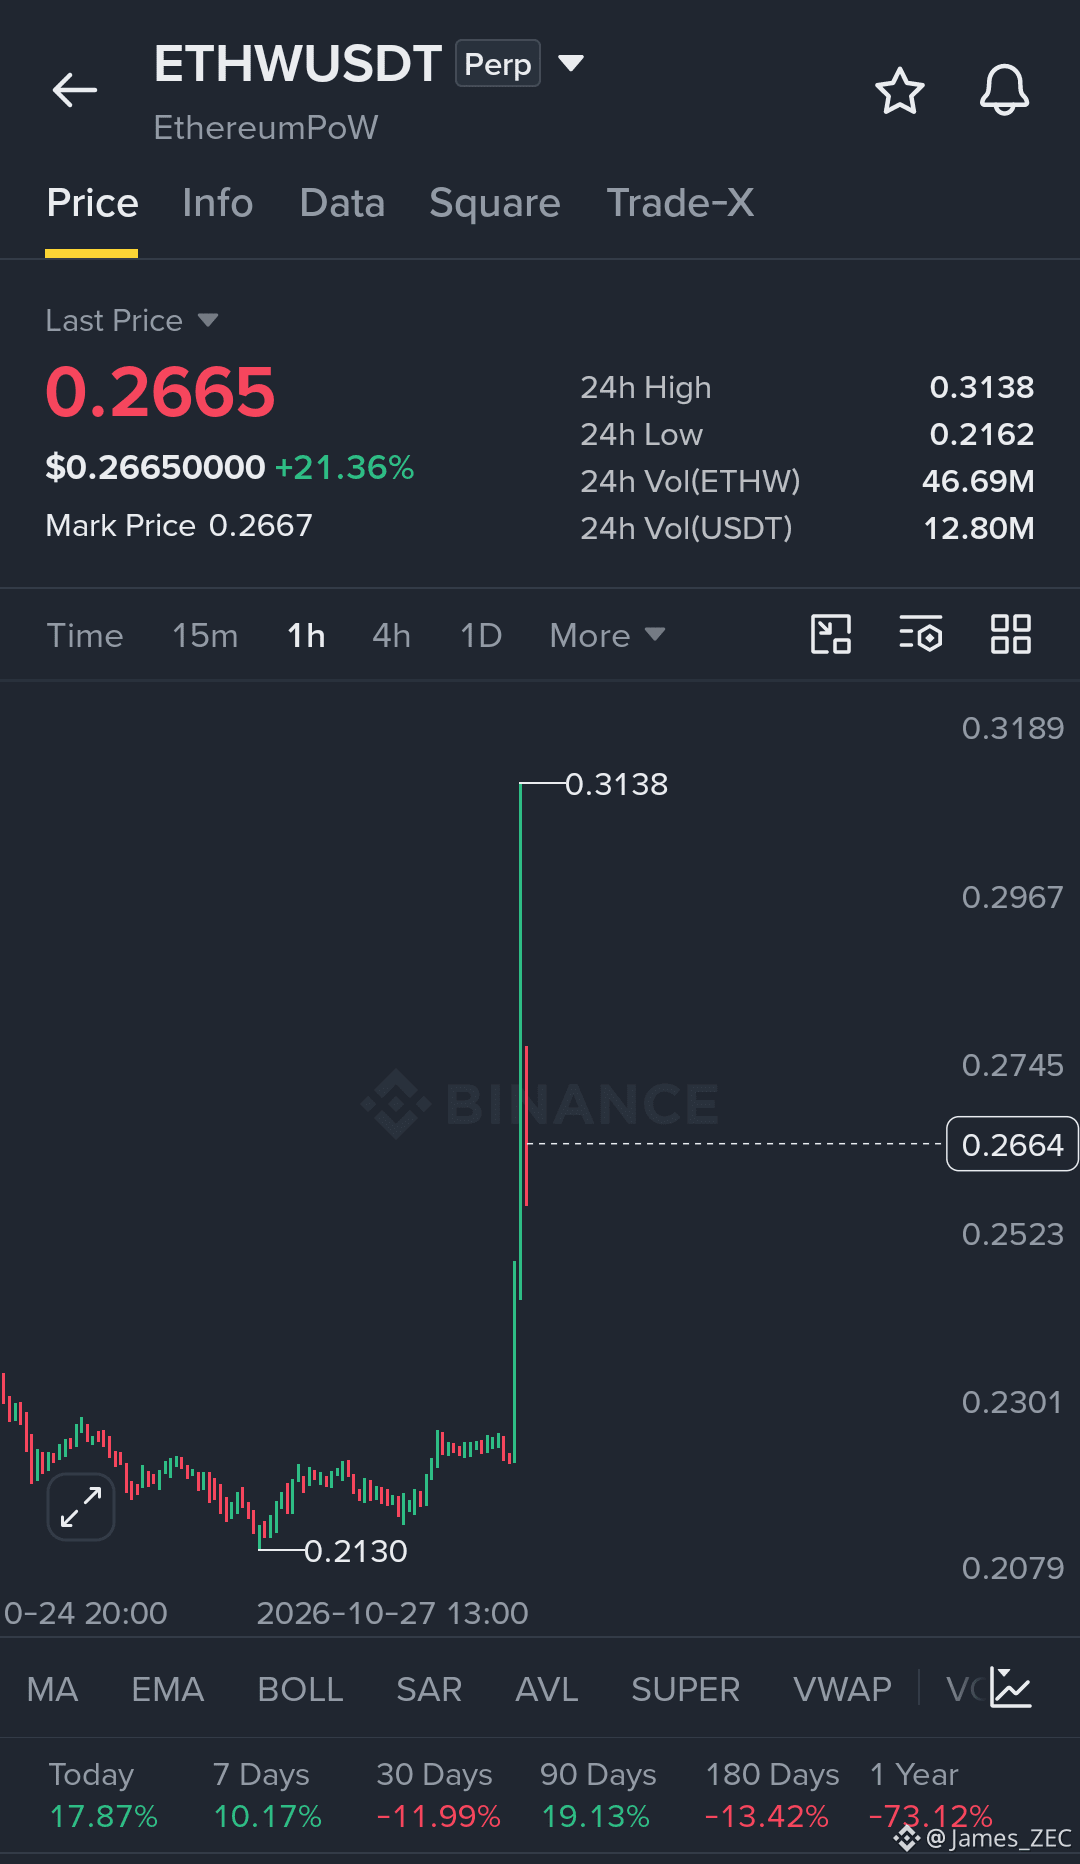
ETHW has broken out of its previous trading range near 0.2250, surging to a high of 0.3138. Price has pulled back toward 0.2665 following the sharp spike, making confirmation important before entering.
Entry Strategy: Avoid chasing the initial pump. Watch for support around 0.2580–0.2640 and a bullish reaction. A recovery above 0.2750 would strengthen the continuation case toward the next resistance levels.
Invalidation: A sustained move below 0.2490 weakens the bullish setup.
Risk only 1–3% of your deposit per trade. Targets are potential levels, not guaranteed outcomes.
$EVAA
{future}(EVAAUSDT)
$XAN
{future}(XANUSDT)
{future}(ETHWUSDT)
$ETHW Breakout Continuation Long Setup
Long Setup
Entry Zone: 0.2580 – 0.2640
Stop Loss: 0.2490
TP1: 0.2800
TP2: 0.2960
TP3: 0.3130
Chart Analysis
ETHW has broken out of its previous trading range near 0.2250, surging to a high of 0.3138. Price has pulled back toward 0.2665 following the sharp spike, making confirmation important before entering.
Entry Strategy: Avoid chasing the initial pump. Watch for support around 0.2580–0.2640 and a bullish reaction. A recovery above 0.2750 would strengthen the continuation case toward the next resistance levels.
Invalidation: A sustained move below 0.2490 weakens the bullish setup.
Risk only 1–3% of your deposit per trade. Targets are potential levels, not guaranteed outcomes.
$EVAA
$XAN
672
·
--
Рост
$RAM Momentum Breakout Long Setup
Long Setup
Entry Zone: 9.70 – 9.90
Stop Loss: 9.35
TP1: 10.32
TP2: 10.60
TP3: 10.90
Chart Analysis
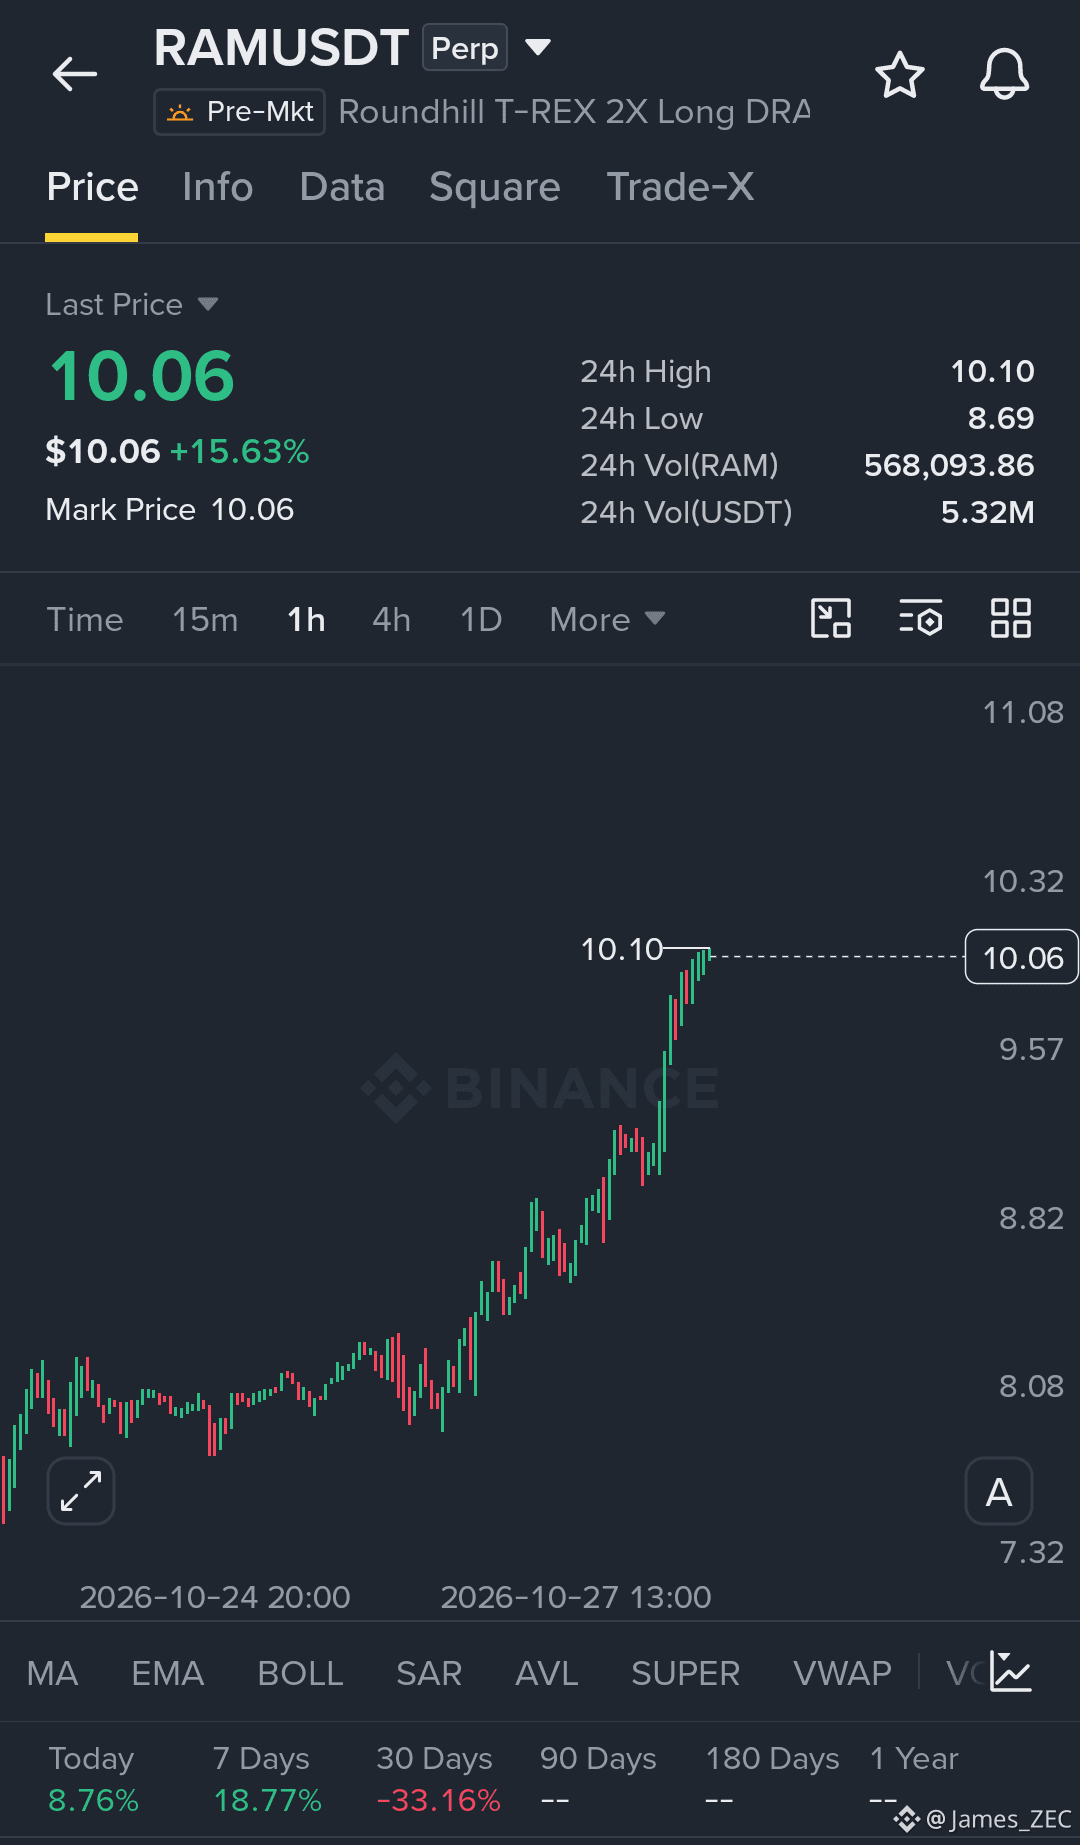
RAM has accelerated out of its previous consolidation around 8.00, forming a strong bullish structure toward the 10.10 high. Price is now testing immediate resistance, so chasing the current move carries increased pullback risk.
Entry Strategy: Wait for a controlled retracement into 9.70–9.90 and bullish confirmation. A decisive break above 10.10 could support continuation toward 10.32, 10.60, and 10.90.
Invalidation: A sustained move below 9.35 weakens the setup.
Risk only 1–3% of your deposit per trade. Targets are potential levels, not guaranteed outcomes.
$XAN
{future}(XANUSDT)
{future}(RAMUSDT)
$EVAA
{future}(EVAAUSDT)
$RAM Momentum Breakout Long Setup
Long Setup
Entry Zone: 9.70 – 9.90
Stop Loss: 9.35
TP1: 10.32
TP2: 10.60
TP3: 10.90
Chart Analysis
RAM has accelerated out of its previous consolidation around 8.00, forming a strong bullish structure toward the 10.10 high. Price is now testing immediate resistance, so chasing the current move carries increased pullback risk.
Entry Strategy: Wait for a controlled retracement into 9.70–9.90 and bullish confirmation. A decisive break above 10.10 could support continuation toward 10.32, 10.60, and 10.90.
Invalidation: A sustained move below 9.35 weakens the setup.
Risk only 1–3% of your deposit per trade. Targets are potential levels, not guaranteed outcomes.
$XAN
$EVAA
405
·
--
Рост
$BLESS Breakout Continuation Long Setup
Long Setup
Entry Zone: 0.00950 – 0.00980
Stop Loss: 0.00900
TP1: 0.01032
TP2: 0.01080
TP3: 0.01128
Chart Analysis
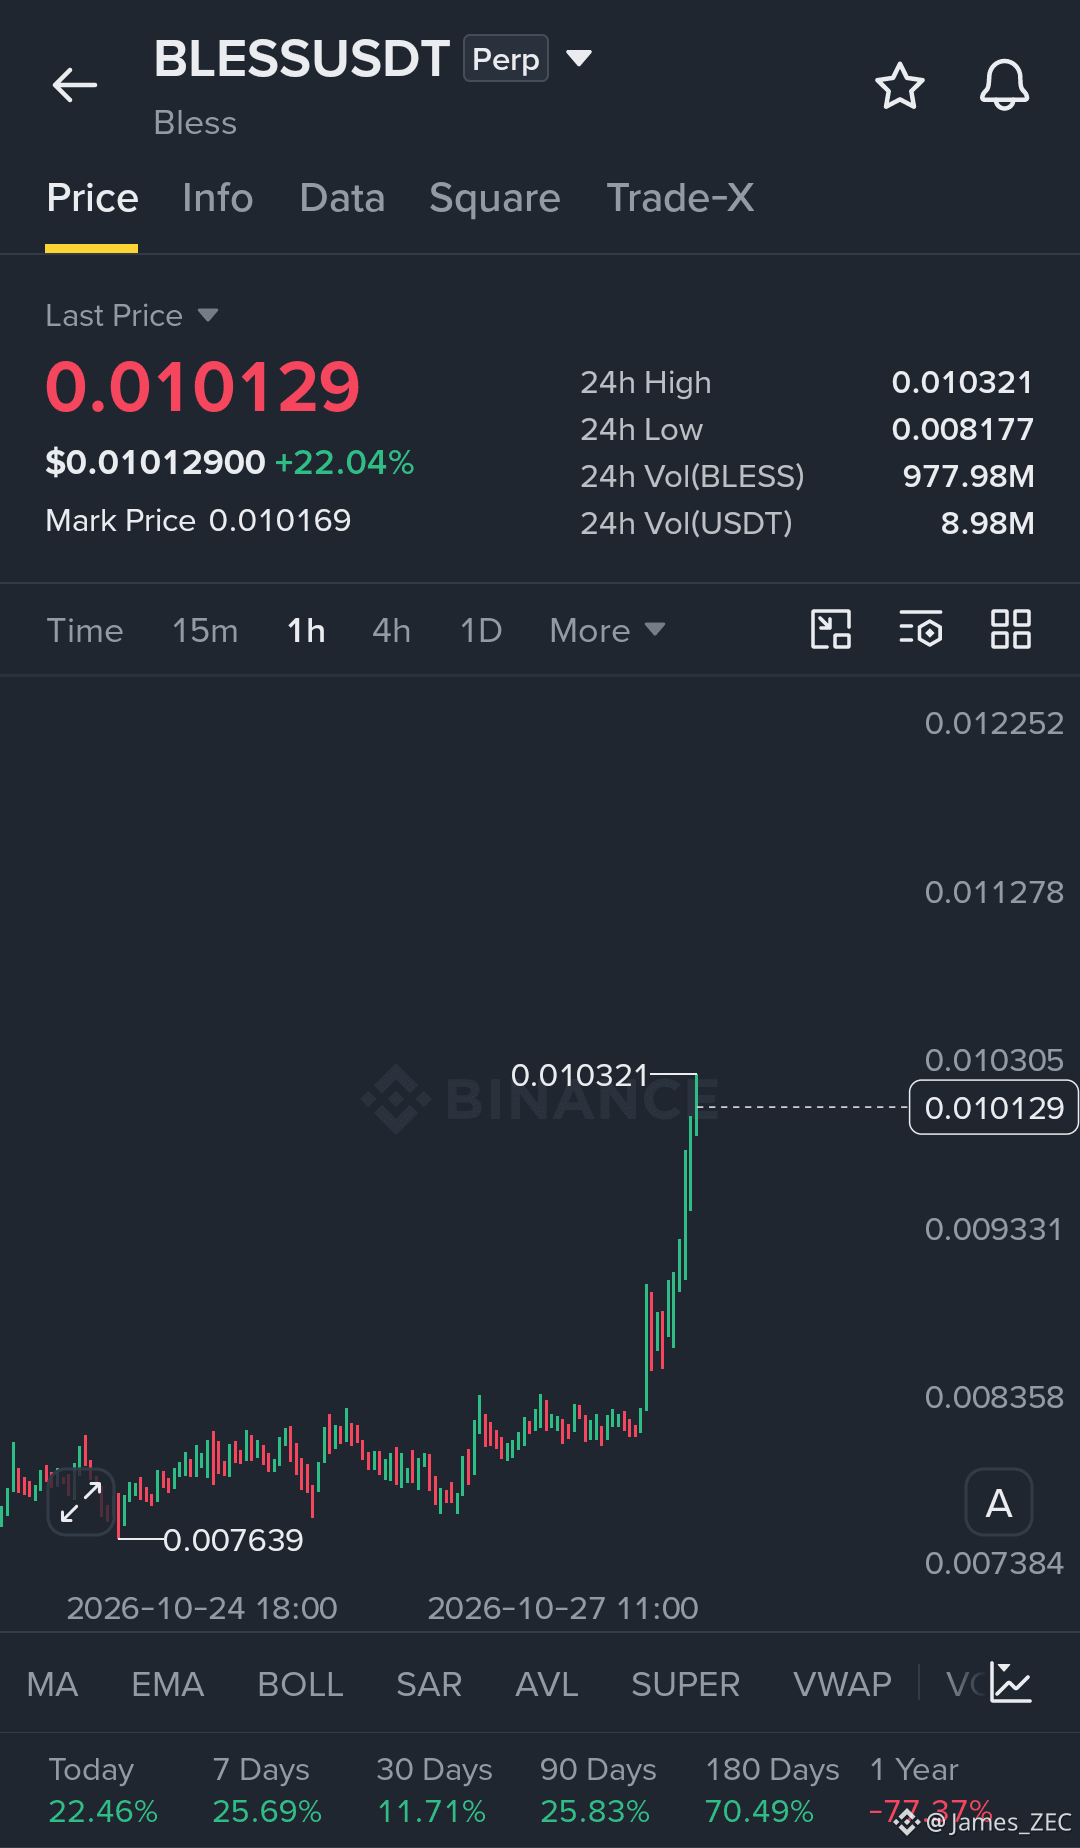
BLESS has broken out of a prolonged consolidation near 0.00830, accelerating toward the 0.010321 high. The sharp upward move shows strong buying momentum, but the price is now testing resistance after an extended rally.
Entry Strategy: Avoid chasing the spike. Wait for a pullback into the entry zone and bullish confirmation before considering a long position. A sustained breakout above 0.01032 could open the way toward 0.01080 and 0.01128.
Invalidation: A sustained move below 0.00900 weakens this setup.
Risk only 1–3% of your deposit per trade. Targets are potential levels, not guaranteed outcomes.
$EVAA
{future}(EVAAUSDT)
$APR
{future}(APRUSDT)
{future}(BLESSUSDT)
$BLESS Breakout Continuation Long Setup
Long Setup
Entry Zone: 0.00950 – 0.00980
Stop Loss: 0.00900
TP1: 0.01032
TP2: 0.01080
TP3: 0.01128
Chart Analysis
BLESS has broken out of a prolonged consolidation near 0.00830, accelerating toward the 0.010321 high. The sharp upward move shows strong buying momentum, but the price is now testing resistance after an extended rally.
Entry Strategy: Avoid chasing the spike. Wait for a pullback into the entry zone and bullish confirmation before considering a long position. A sustained breakout above 0.01032 could open the way toward 0.01080 and 0.01128.
Invalidation: A sustained move below 0.00900 weakens this setup.
Risk only 1–3% of your deposit per trade. Targets are potential levels, not guaranteed outcomes.
$EVAA
$APR
436
·
--
Рост
$SOL Range Recovery Long Setup
Long Setup
Entry Zone: 101.00 – 101.60
Stop Loss: 99.50
TP1: 102.40
TP2: 103.50
TP3: 104.50
Chart Analysis
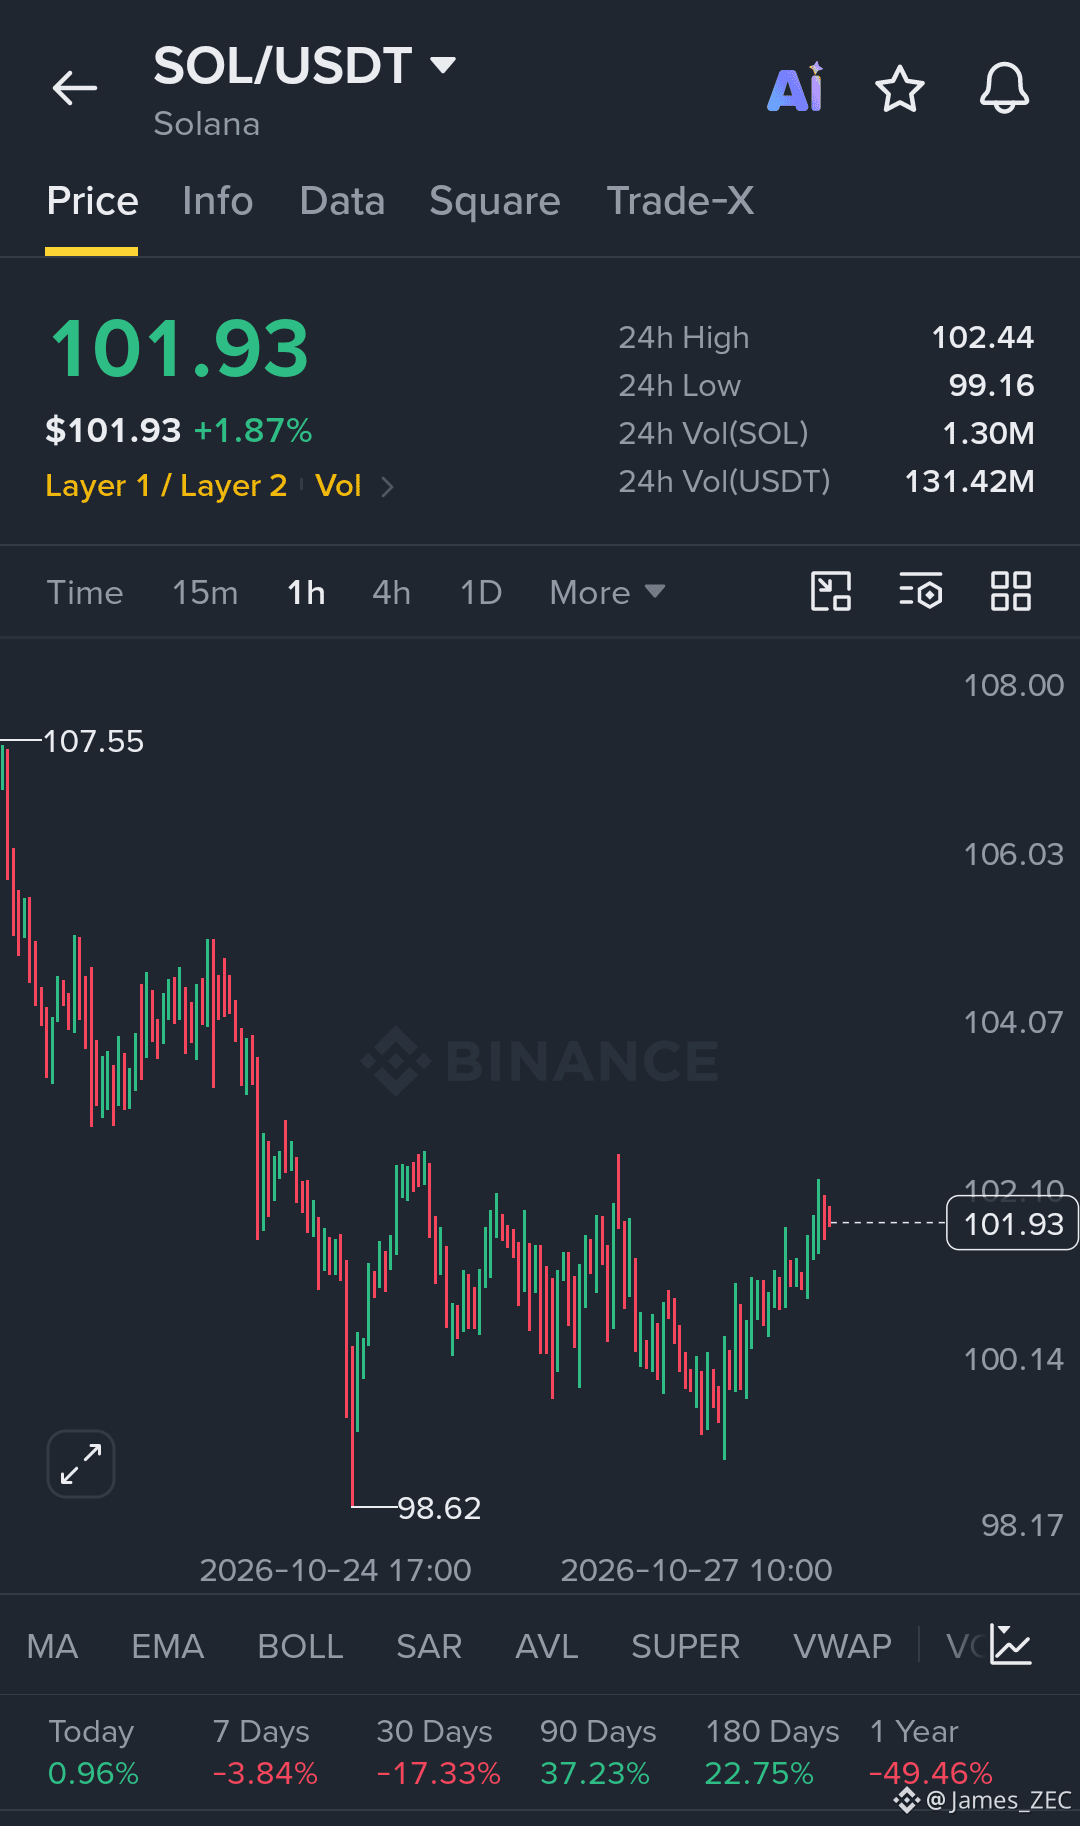
SOL is attempting to recover after dropping from 107.55 to the 98.62 swing low. Price has rebounded from the lower range and is now testing resistance near 102.10–102.44.
Entry Strategy: Look for a pullback that holds above 101.00 or a confirmed breakout above 102.44. A successful breakout could open the way toward 103.50 and 104.50.
Invalidation: A sustained move below 99.50 weakens the bullish setup and may expose the lower support area.
Risk only 1–3% of your deposit per trade. Targets are potential levels, not guaranteed outcomes.
$XAN
{future}(XANUSDT)
$AIN
{future}(AINUSDT)
{future}(SOLUSDT)
$SOL Range Recovery Long Setup
Long Setup
Entry Zone: 101.00 – 101.60
Stop Loss: 99.50
TP1: 102.40
TP2: 103.50
TP3: 104.50
Chart Analysis
SOL is attempting to recover after dropping from 107.55 to the 98.62 swing low. Price has rebounded from the lower range and is now testing resistance near 102.10–102.44.
Entry Strategy: Look for a pullback that holds above 101.00 or a confirmed breakout above 102.44. A successful breakout could open the way toward 103.50 and 104.50.
Invalidation: A sustained move below 99.50 weakens the bullish setup and may expose the lower support area.
Risk only 1–3% of your deposit per trade. Targets are potential levels, not guaranteed outcomes.
$XAN
$AIN
516
·
--
Рост
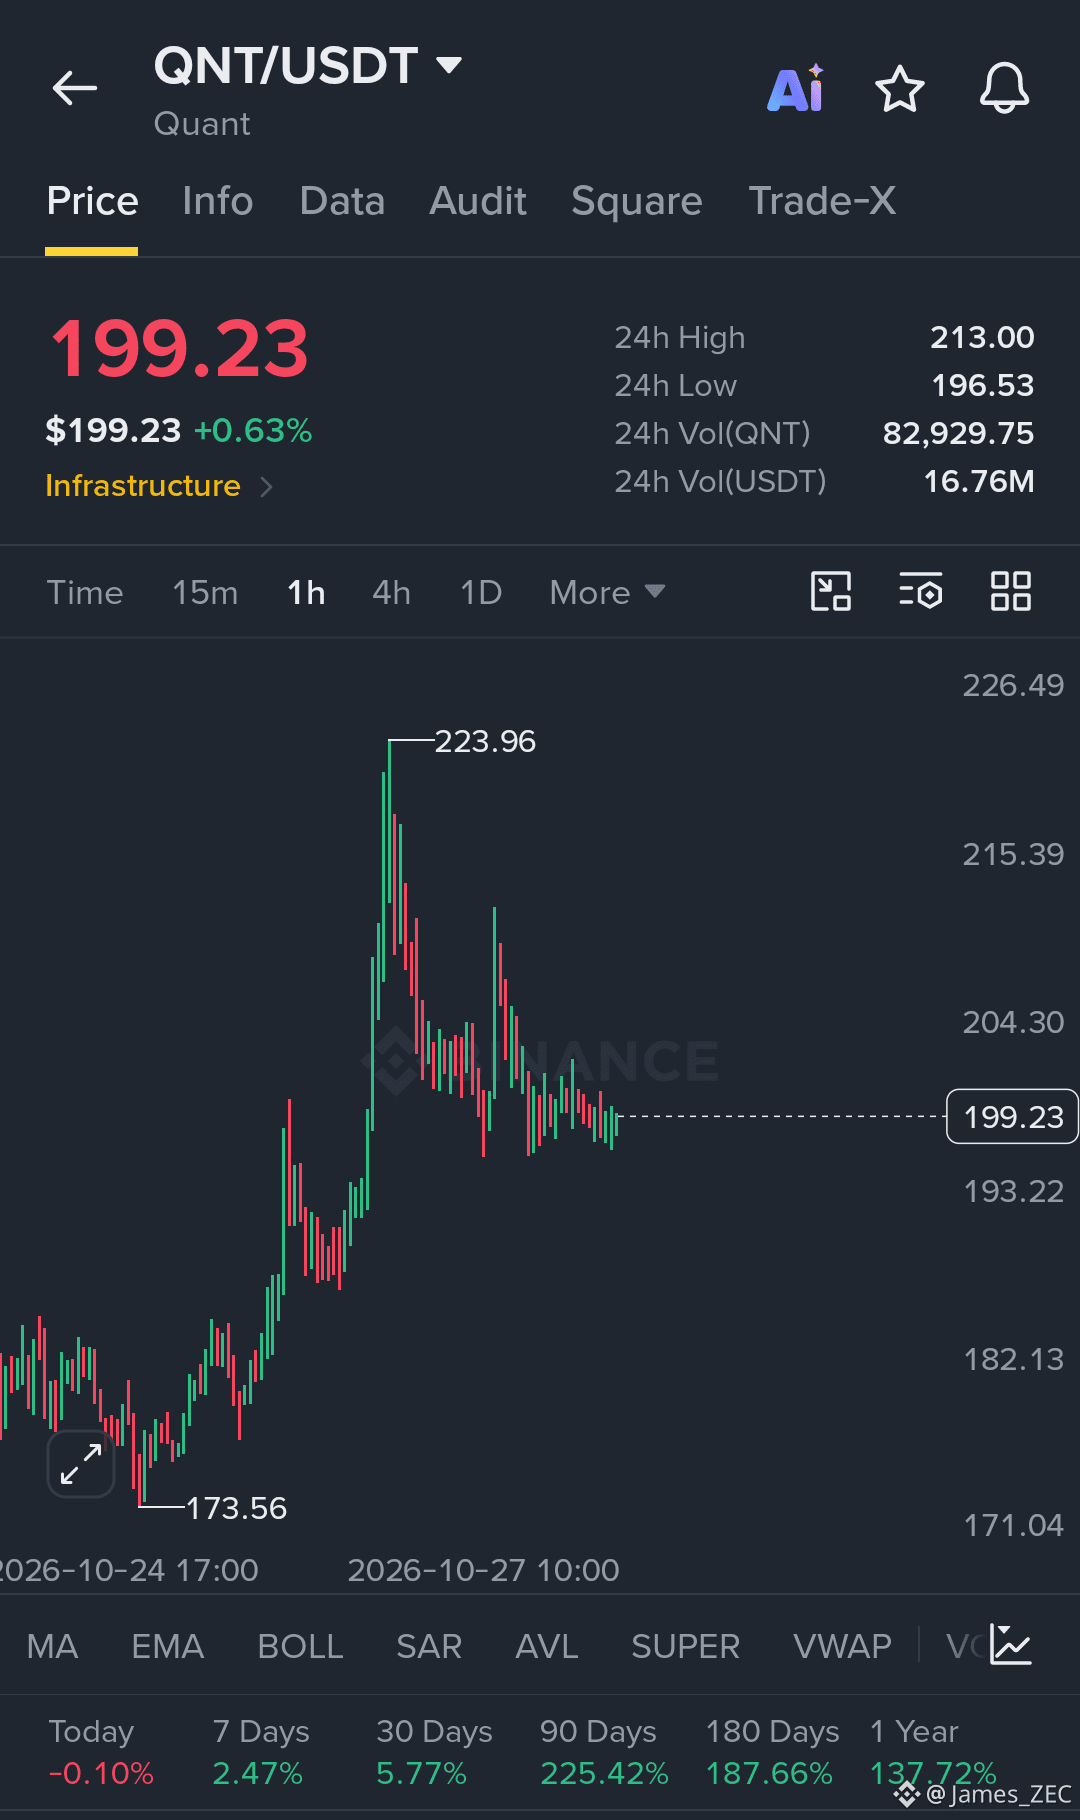
$QNT Consolidation Breakout Long Setup
Long Setup
Entry Zone: 197.00 – 199.00
Stop Loss: 193.00
TP1: 204.30
TP2: 210.00
TP3: 215.00
Chart Analysis
QNT is consolidating around 199.23 after a strong rally from the 173.56 swing low to the 223.96 peak. The recent pullback suggests the market is stabilizing, but buyers still need to reclaim nearby resistance to confirm another bullish leg.
The 197.00–199.00 area is the potential entry region if support holds and bullish momentum returns. A breakout above 204.30 could open the path toward 210.00 and 215.00. However, rejection near resistance may lead to another retest of lower support.
Entry Strategy: Wait for bullish confirmation around the entry zone or a breakout and retest above 204.30.
Invalidation: A sustained move below 193.00 weakens this setup.
Risk only 1–3% of your deposit per trade. Targets are potential levels, not guaranteed outcomes.
$EVAA
{future}(EVAAUSDT)
$AIN
{future}(AINUSDT)
{future}(QNTUSDT)
$QNT Consolidation Breakout Long Setup
Long Setup
Entry Zone: 197.00 – 199.00
Stop Loss: 193.00
TP1: 204.30
TP2: 210.00
TP3: 215.00
Chart Analysis
QNT is consolidating around 199.23 after a strong rally from the 173.56 swing low to the 223.96 peak. The recent pullback suggests the market is stabilizing, but buyers still need to reclaim nearby resistance to confirm another bullish leg.
The 197.00–199.00 area is the potential entry region if support holds and bullish momentum returns. A breakout above 204.30 could open the path toward 210.00 and 215.00. However, rejection near resistance may lead to another retest of lower support.
Entry Strategy: Wait for bullish confirmation around the entry zone or a breakout and retest above 204.30.
Invalidation: A sustained move below 193.00 weakens this setup.
Risk only 1–3% of your deposit per trade. Targets are potential levels, not guaranteed outcomes.
$EVAA
$AIN
674
·
--
Рост
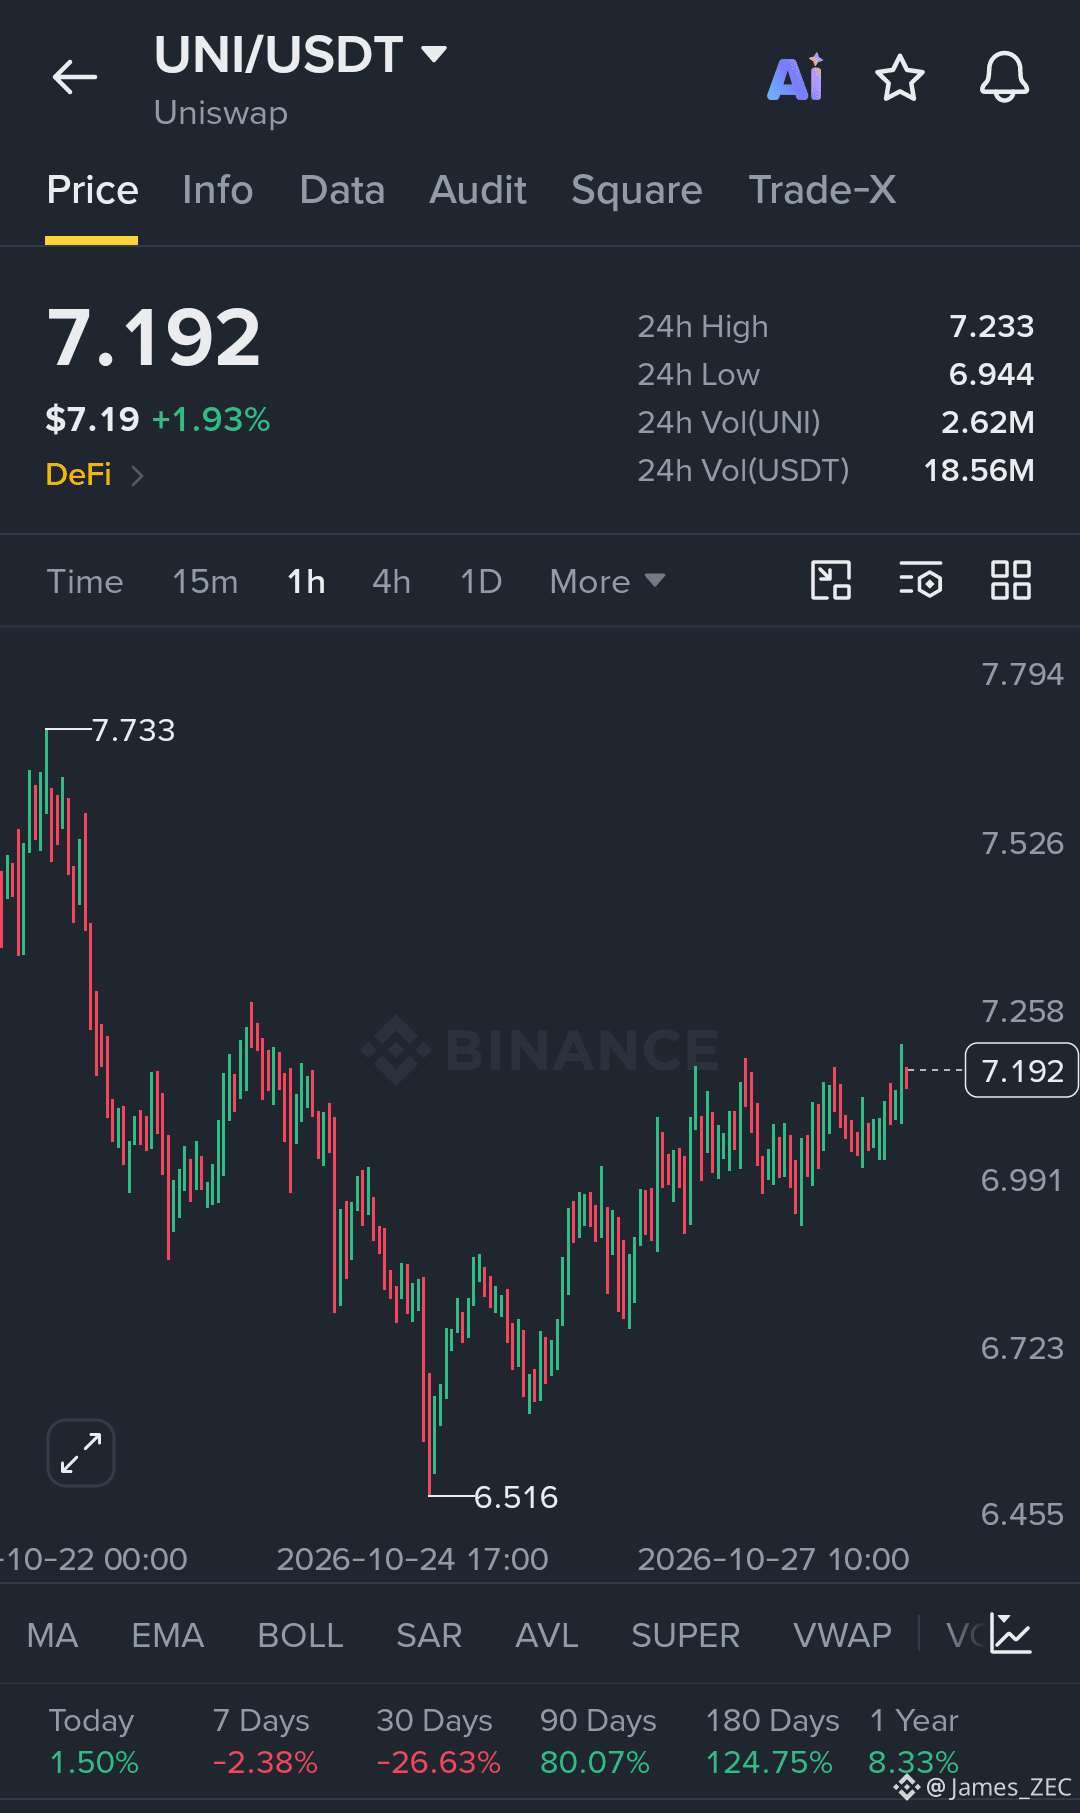
$UNI Recovery Momentum Long Setup
Long Setup
Entry Zone: 7.08 – 7.16
Stop Loss: 6.92
TP1: 7.26
TP2: 7.40
TP3: 7.55
Chart Analysis
UNIUSDT is showing improving bullish momentum on the 1-hour chart after recovering from the 6.516 swing low. Price has formed a series of higher lows during the recent rebound and is now trading near 7.192, approaching short-term resistance.
The 7.23–7.26 area is the immediate hurdle. A confirmed breakout above this zone could open the way toward 7.40 and 7.55. If price retraces, the 7.08–7.16 zone may provide a potential support retest, provided buyers defend it.
Entry Strategy: Prefer a pullback with bullish confirmation or a confirmed breakout and retest above 7.26. Avoid entering blindly near resistance.
Invalidation: A sustained move below 6.92 weakens the bullish setup.
Manage risk carefully and limit risk to 1–3% of your deposit per trade. Targets are potential levels, not guaranteed outcomes.
$EVAA
{future}(EVAAUSDT)
$AIN
{future}(AINUSDT)
{future}(UNIUSDT)
$UNI Recovery Momentum Long Setup
Long Setup
Entry Zone: 7.08 – 7.16
Stop Loss: 6.92
TP1: 7.26
TP2: 7.40
TP3: 7.55
Chart Analysis
UNIUSDT is showing improving bullish momentum on the 1-hour chart after recovering from the 6.516 swing low. Price has formed a series of higher lows during the recent rebound and is now trading near 7.192, approaching short-term resistance.
The 7.23–7.26 area is the immediate hurdle. A confirmed breakout above this zone could open the way toward 7.40 and 7.55. If price retraces, the 7.08–7.16 zone may provide a potential support retest, provided buyers defend it.
Entry Strategy: Prefer a pullback with bullish confirmation or a confirmed breakout and retest above 7.26. Avoid entering blindly near resistance.
Invalidation: A sustained move below 6.92 weakens the bullish setup.
Manage risk carefully and limit risk to 1–3% of your deposit per trade. Targets are potential levels, not guaranteed outcomes.
$EVAA
$AIN
674
·
--
Рост
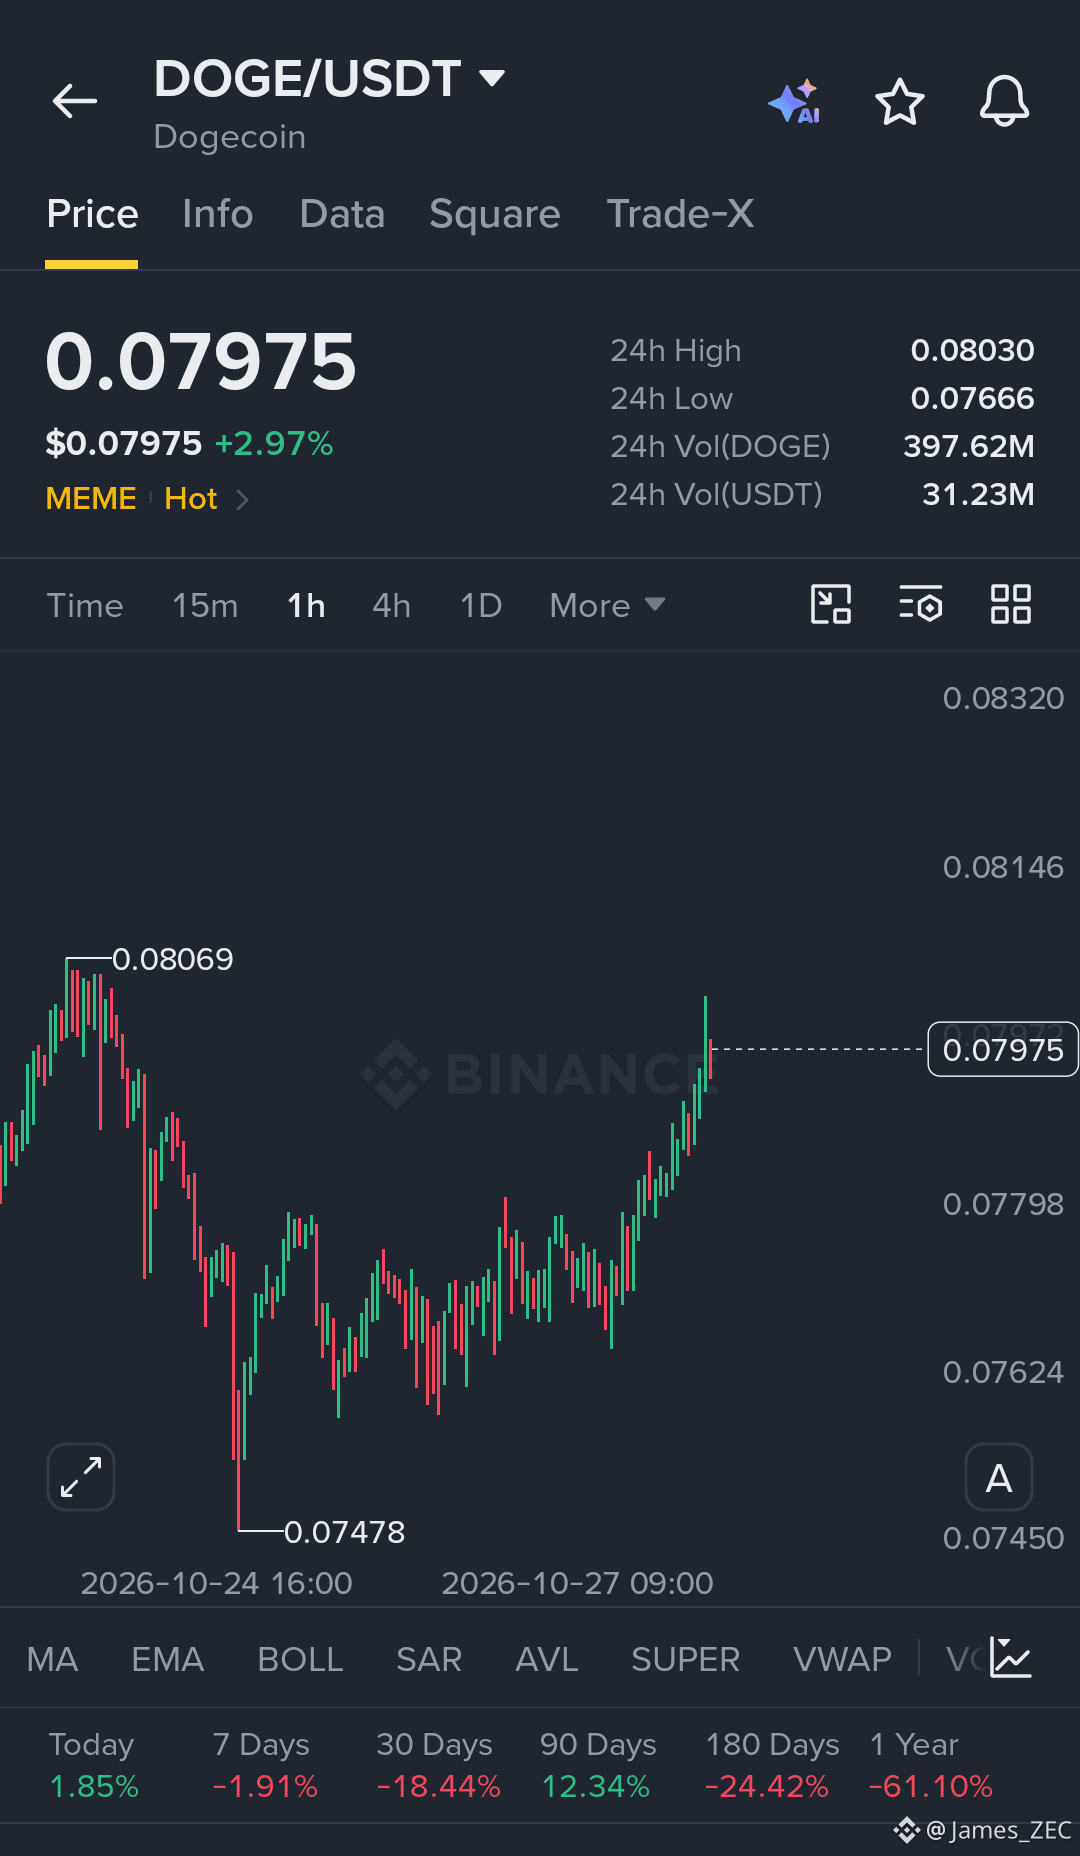
$DOGE Recovery Breakout Long Setup
Dogecoin is climbing toward its previous high, but a confirmed breakout is needed to unlock the next upside move.
Long Setup
Entry Zone: 0.0785 – 0.0792
Stop Loss: 0.0770
TP1: 0.0807
TP2: 0.0815
TP3: 0.0825
Chart Analysis
DOGEUSDT is showing a recovery on the 1-hour chart after bouncing from the 0.07478 low. Price has reclaimed the 0.0780 area and is now trading near 0.07975, approaching resistance around 0.08030–0.08069.
A clean breakout above 0.08069 could strengthen bullish momentum toward 0.0815 and 0.0825. If price pulls back, the 0.0785–0.0792 zone may offer a potential retest opportunity, provided buyers defend it.
Entry Strategy: Wait for a controlled pullback with bullish confirmation, or a breakout and successful retest above 0.08069. Avoid chasing price directly into resistance.
Invalidation: A sustained move below 0.0770 weakens this setup.
Manage risk carefully and limit risk to 1–3% of your deposit per trade. Targets are potential levels, not guaranteed outcomes.
$EVAA
{future}(EVAAUSDT)
$AIN
{future}(AINUSDT)
{future}(DOGEUSDT)
$DOGE Recovery Breakout Long Setup
Dogecoin is climbing toward its previous high, but a confirmed breakout is needed to unlock the next upside move.
Long Setup
Entry Zone: 0.0785 – 0.0792
Stop Loss: 0.0770
TP1: 0.0807
TP2: 0.0815
TP3: 0.0825
Chart Analysis
DOGEUSDT is showing a recovery on the 1-hour chart after bouncing from the 0.07478 low. Price has reclaimed the 0.0780 area and is now trading near 0.07975, approaching resistance around 0.08030–0.08069.
A clean breakout above 0.08069 could strengthen bullish momentum toward 0.0815 and 0.0825. If price pulls back, the 0.0785–0.0792 zone may offer a potential retest opportunity, provided buyers defend it.
Entry Strategy: Wait for a controlled pullback with bullish confirmation, or a breakout and successful retest above 0.08069. Avoid chasing price directly into resistance.
Invalidation: A sustained move below 0.0770 weakens this setup.
Manage risk carefully and limit risk to 1–3% of your deposit per trade. Targets are potential levels, not guaranteed outcomes.
$EVAA
$AIN
577
·
--
Рост
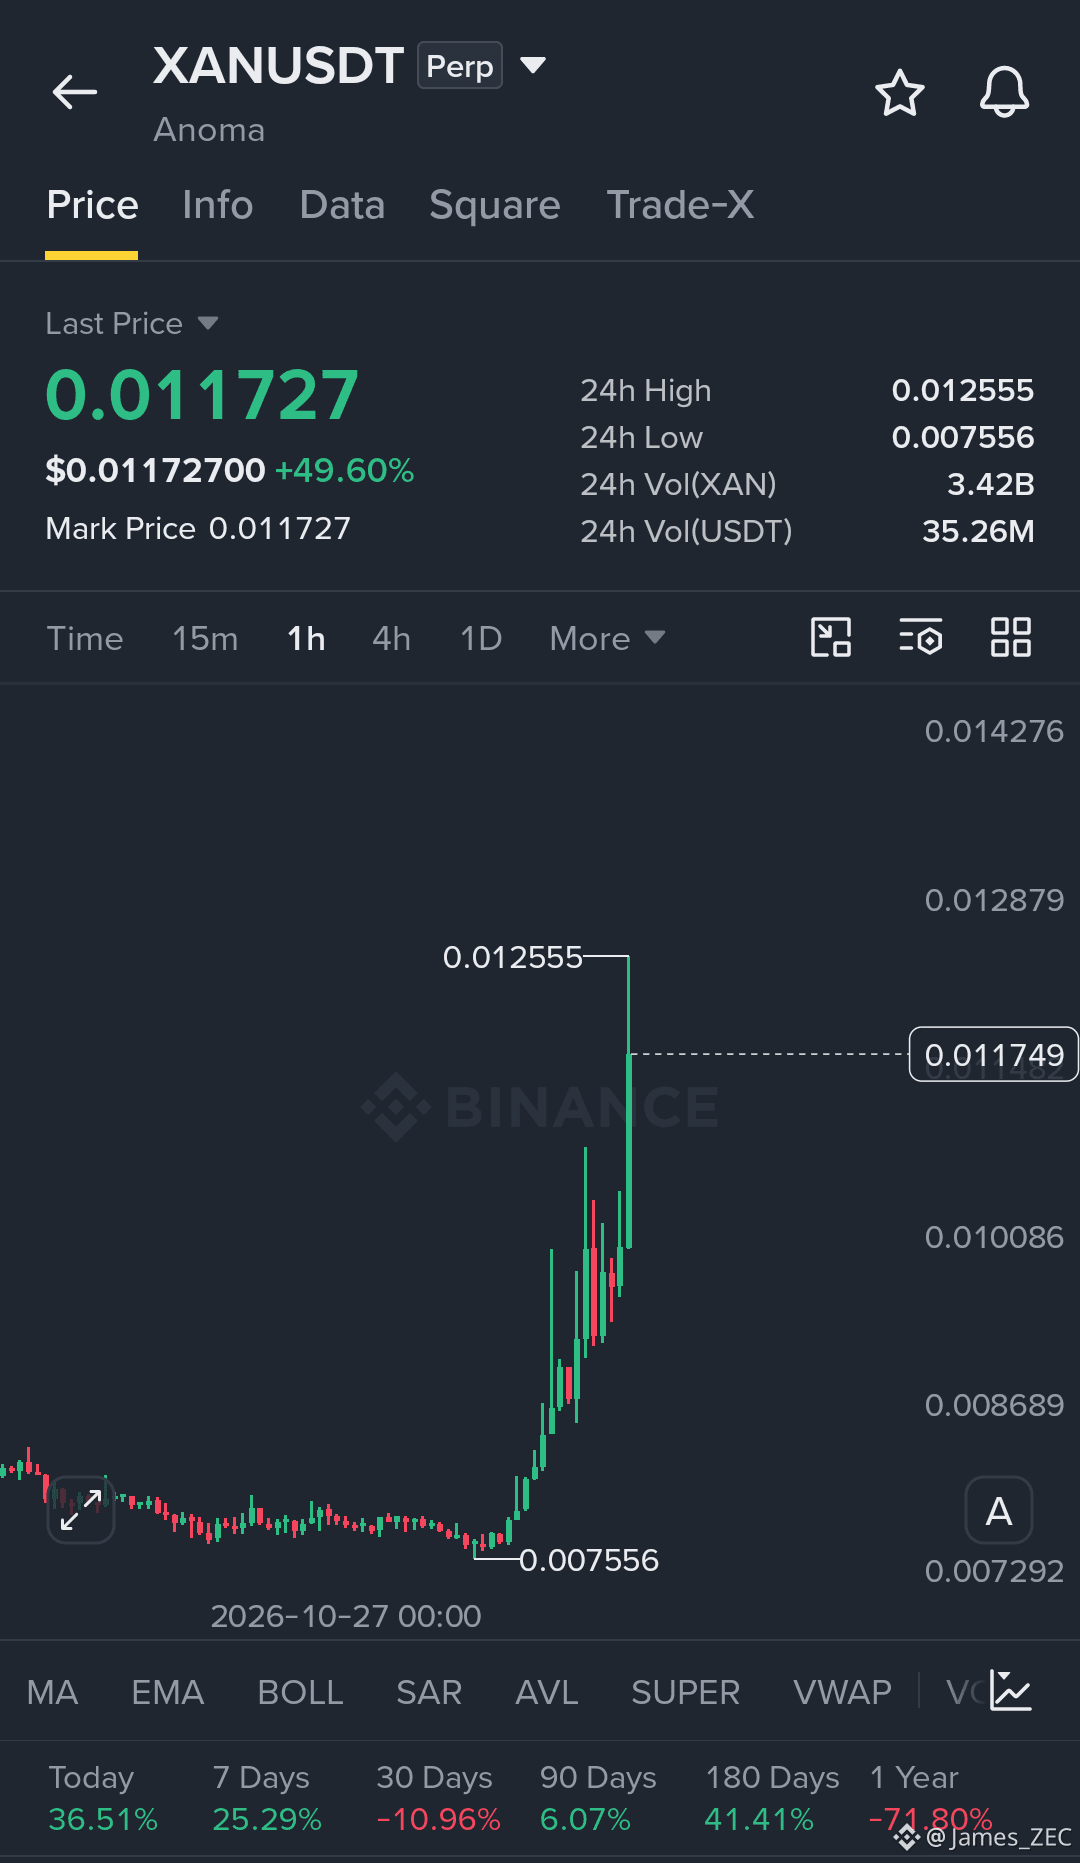
$XAN Momentum Breakout Long Setup
XAN has exploded out of its base. The next opportunity depends on whether buyers can defend the breakout.
Long Setup
Entry Zone: 0.0105 – 0.0112
Stop Loss: 0.0097
TP1: 0.0125
TP2: 0.0130
TP3: 0.0138
Chart Analysis
XANUSDT has surged nearly 50% in 24 hours, climbing from the 0.007556 low to a recent high of 0.012555 on the 1-hour chart. The sharp expansion in price shows strong buying pressure, but the rapid rally also increases the risk of a pullback.
The 0.012555 high is the immediate resistance. A confirmed breakout above this level could open the way toward 0.0130 and 0.0138. If price retraces, the 0.0105–0.0112 area is a potential retest zone where buyers may attempt to regain control.
Entry Strategy: Avoid chasing the current spike. Wait for a pullback with bullish confirmation, or a clean breakout and successful retest above 0.012555.
Invalidation: A sustained move below 0.0097 weakens this bullish setup.
Manage risk carefully and limit risk to 1–3% of your deposit per trade. Targets are potential levels, not guaranteed outcomes.
$EVAA
{future}(EVAAUSDT)
$AIN
{future}(AINUSDT)
{future}(XANUSDT)
$XAN Momentum Breakout Long Setup
XAN has exploded out of its base. The next opportunity depends on whether buyers can defend the breakout.
Long Setup
Entry Zone: 0.0105 – 0.0112
Stop Loss: 0.0097
TP1: 0.0125
TP2: 0.0130
TP3: 0.0138
Chart Analysis
XANUSDT has surged nearly 50% in 24 hours, climbing from the 0.007556 low to a recent high of 0.012555 on the 1-hour chart. The sharp expansion in price shows strong buying pressure, but the rapid rally also increases the risk of a pullback.
The 0.012555 high is the immediate resistance. A confirmed breakout above this level could open the way toward 0.0130 and 0.0138. If price retraces, the 0.0105–0.0112 area is a potential retest zone where buyers may attempt to regain control.
Entry Strategy: Avoid chasing the current spike. Wait for a pullback with bullish confirmation, or a clean breakout and successful retest above 0.012555.
Invalidation: A sustained move below 0.0097 weakens this bullish setup.
Manage risk carefully and limit risk to 1–3% of your deposit per trade. Targets are potential levels, not guaranteed outcomes.
$EVAA
$AIN
491
·
--
Рост
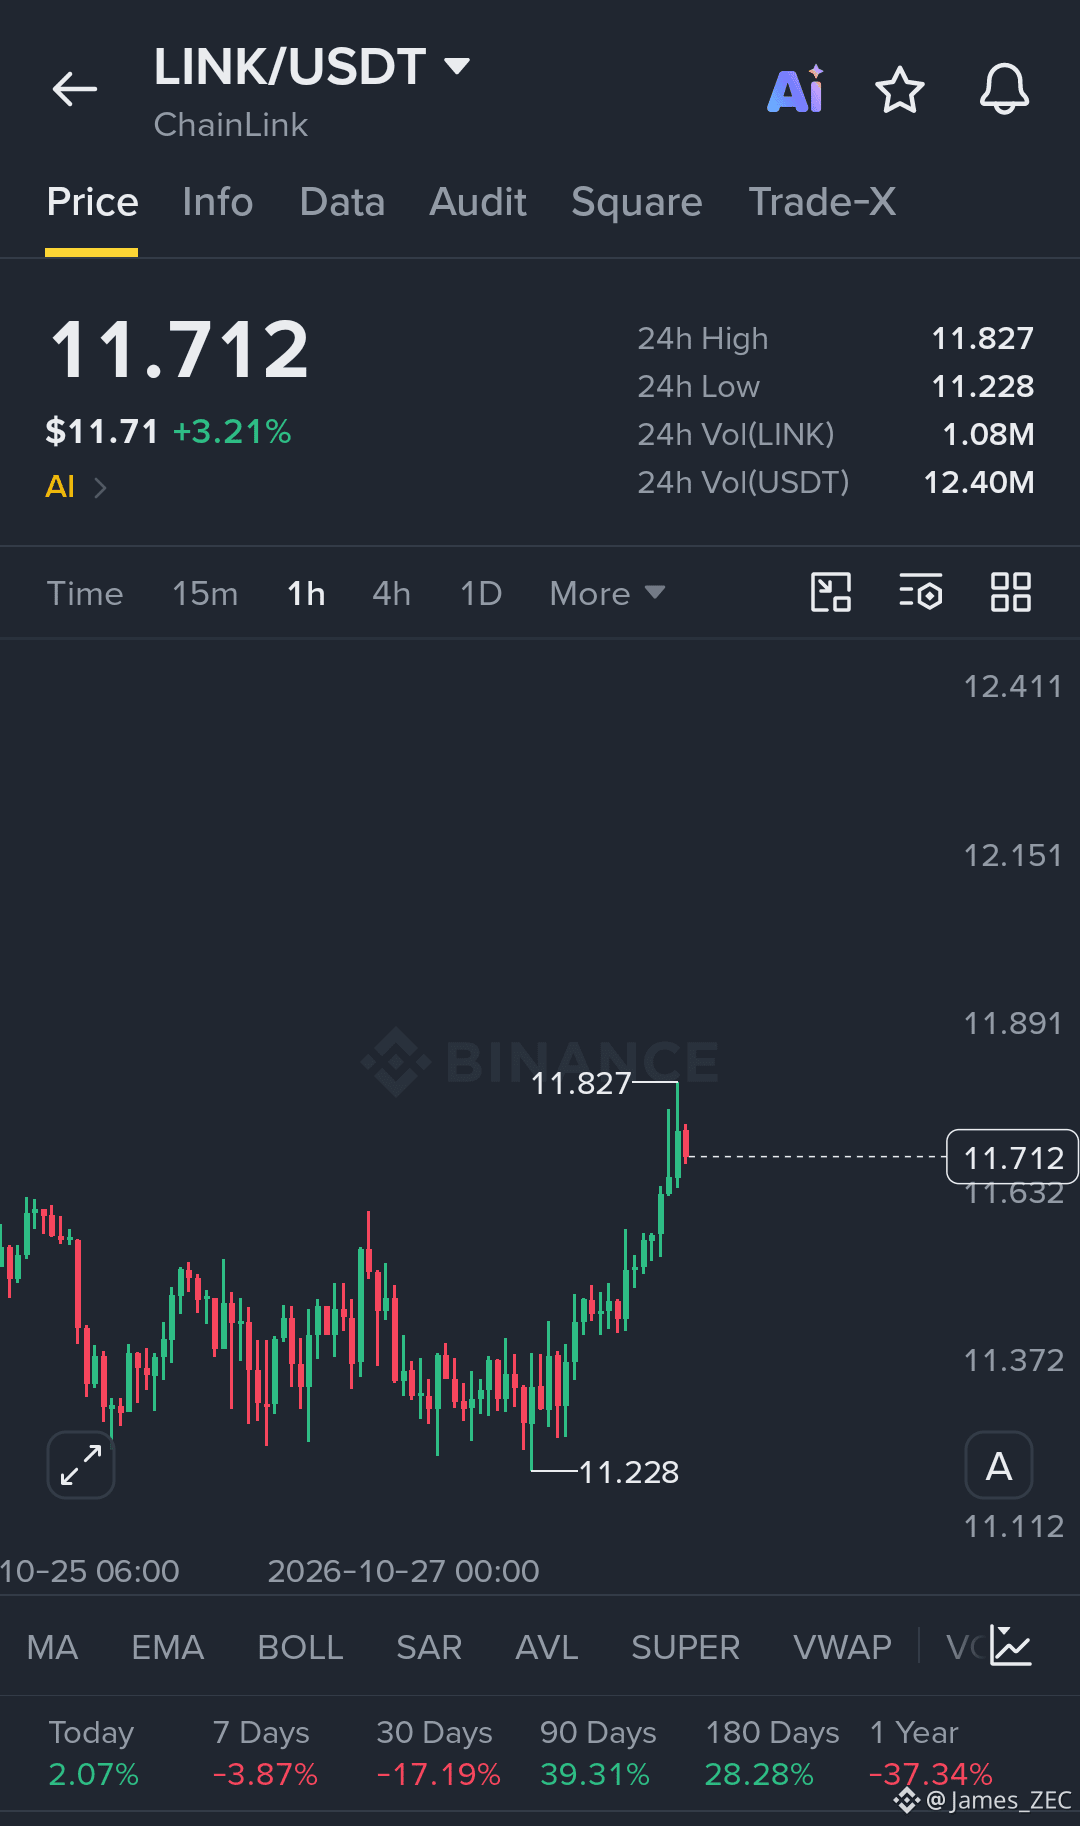
$LINK Breakout Continuation Long Setup
Chainlink is testing fresh local highs, and the next move depends on whether buyers can hold the breakout.
Long Setup
Entry Zone: 11.58 – 11.68
Stop Loss: 11.38
TP1: 11.83
TP2: 12.00
TP3: 12.15
Chart Analysis
LINKUSDT is showing improving bullish momentum on the 1-hour chart, recovering from the recent low of 11.228 and climbing toward 11.827. The price has broken above its previous consolidation range, indicating renewed buying interest.
The immediate resistance sits at 11.827. A strong 1-hour close above this level, followed by a successful retest, could open the way toward 12.00 and 12.15. If price pulls back, the 11.58–11.68 area may offer support, provided buyers defend it.
Entry Strategy: Prefer a controlled pullback with bullish confirmation rather than chasing the rally near resistance.
Invalidation: A sustained move below 11.38 weakens the bullish setup.
Manage risk carefully and limit risk to 1–3% of your deposit per trade. All targets are potential levels, not guaranteed outcomes.
$EVAA
{future}(EVAAUSDT)
$AIN
{future}(AINUSDT)
{future}(LINKUSDT)
$LINK Breakout Continuation Long Setup
Chainlink is testing fresh local highs, and the next move depends on whether buyers can hold the breakout.
Long Setup
Entry Zone: 11.58 – 11.68
Stop Loss: 11.38
TP1: 11.83
TP2: 12.00
TP3: 12.15
Chart Analysis
LINKUSDT is showing improving bullish momentum on the 1-hour chart, recovering from the recent low of 11.228 and climbing toward 11.827. The price has broken above its previous consolidation range, indicating renewed buying interest.
The immediate resistance sits at 11.827. A strong 1-hour close above this level, followed by a successful retest, could open the way toward 12.00 and 12.15. If price pulls back, the 11.58–11.68 area may offer support, provided buyers defend it.
Entry Strategy: Prefer a controlled pullback with bullish confirmation rather than chasing the rally near resistance.
Invalidation: A sustained move below 11.38 weakens the bullish setup.
Manage risk carefully and limit risk to 1–3% of your deposit per trade. All targets are potential levels, not guaranteed outcomes.
$EVAA
$AIN
675
·
--
Рост
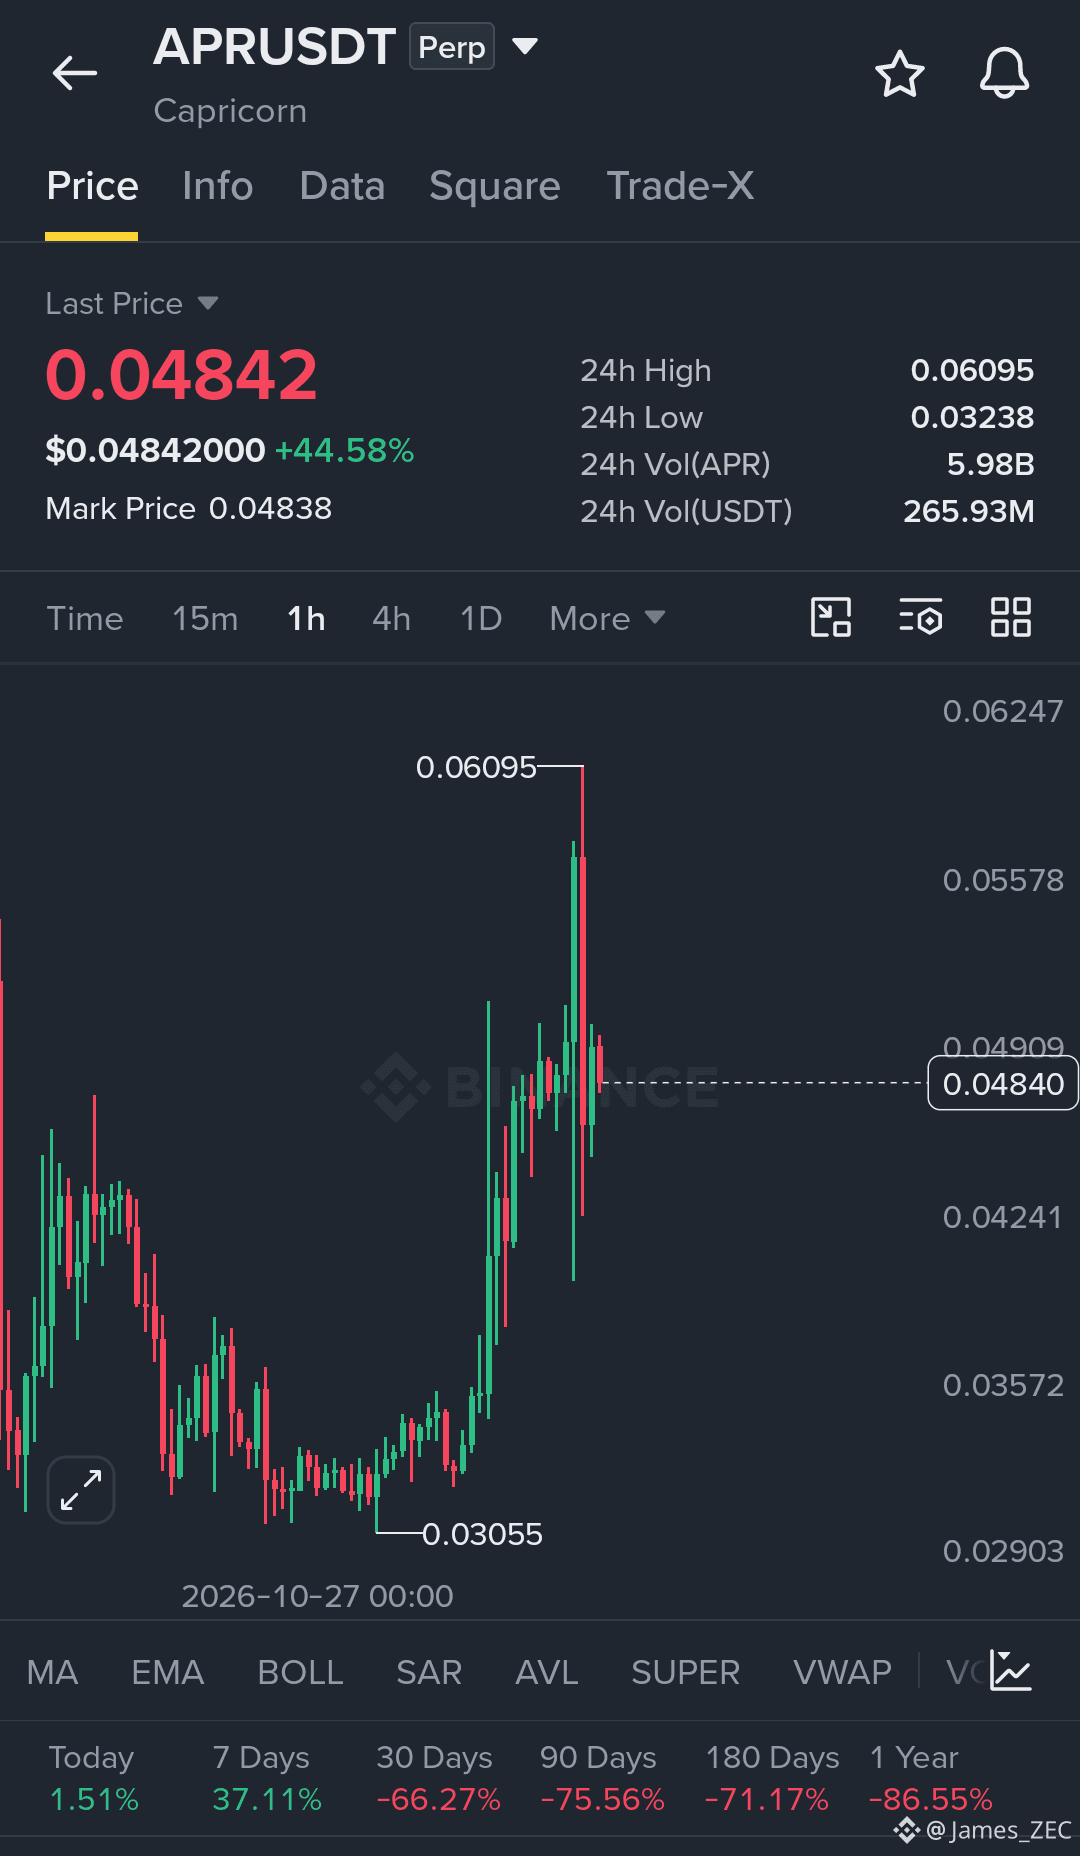
$APR Breakout Continuation Long Setup
APR has made a powerful move from its base, but volatility is high after the sharp rejection from the recent peak.
Long Setup
Entry Zone: 0.0450 – 0.0475
Stop Loss: 0.0418
TP1: 0.0520
TP2: 0.0560
TP3: 0.0605
Chart Analysis
APRUSDT is trading near 0.04842 after rallying from the 0.03055 swing low to a recent high of 0.06095. The strong upward expansion shows aggressive buying pressure, while the sharp rejection from the peak signals that sellers are also active at higher levels.
The 0.0490–0.0500 region is the first hurdle for buyers. A convincing 1-hour close above this area could support a continuation toward 0.0520 and 0.0560, with 0.0605 near the previous spike high. If price pulls back, the 0.0450–0.0475 zone may provide a potential retest area.
Entry Strategy: Wait for bullish confirmation around the entry zone or a breakout-and-retest above 0.0500. Avoid chasing sudden candles.
Invalidation: A sustained move below 0.0418 weakens the setup.
Manage risk carefully and limit exposure to 1–3% of your deposit per trade. Targets are potential levels, not guaranteed outcomes.
$EVAA
{future}(EVAAUSDT)
$AIN
{future}(AINUSDT)
{future}(APRUSDT)
$APR Breakout Continuation Long Setup
APR has made a powerful move from its base, but volatility is high after the sharp rejection from the recent peak.
Long Setup
Entry Zone: 0.0450 – 0.0475
Stop Loss: 0.0418
TP1: 0.0520
TP2: 0.0560
TP3: 0.0605
Chart Analysis
APRUSDT is trading near 0.04842 after rallying from the 0.03055 swing low to a recent high of 0.06095. The strong upward expansion shows aggressive buying pressure, while the sharp rejection from the peak signals that sellers are also active at higher levels.
The 0.0490–0.0500 region is the first hurdle for buyers. A convincing 1-hour close above this area could support a continuation toward 0.0520 and 0.0560, with 0.0605 near the previous spike high. If price pulls back, the 0.0450–0.0475 zone may provide a potential retest area.
Entry Strategy: Wait for bullish confirmation around the entry zone or a breakout-and-retest above 0.0500. Avoid chasing sudden candles.
Invalidation: A sustained move below 0.0418 weakens the setup.
Manage risk carefully and limit exposure to 1–3% of your deposit per trade. Targets are potential levels, not guaranteed outcomes.
$EVAA
$AIN
889
·
--
Рост
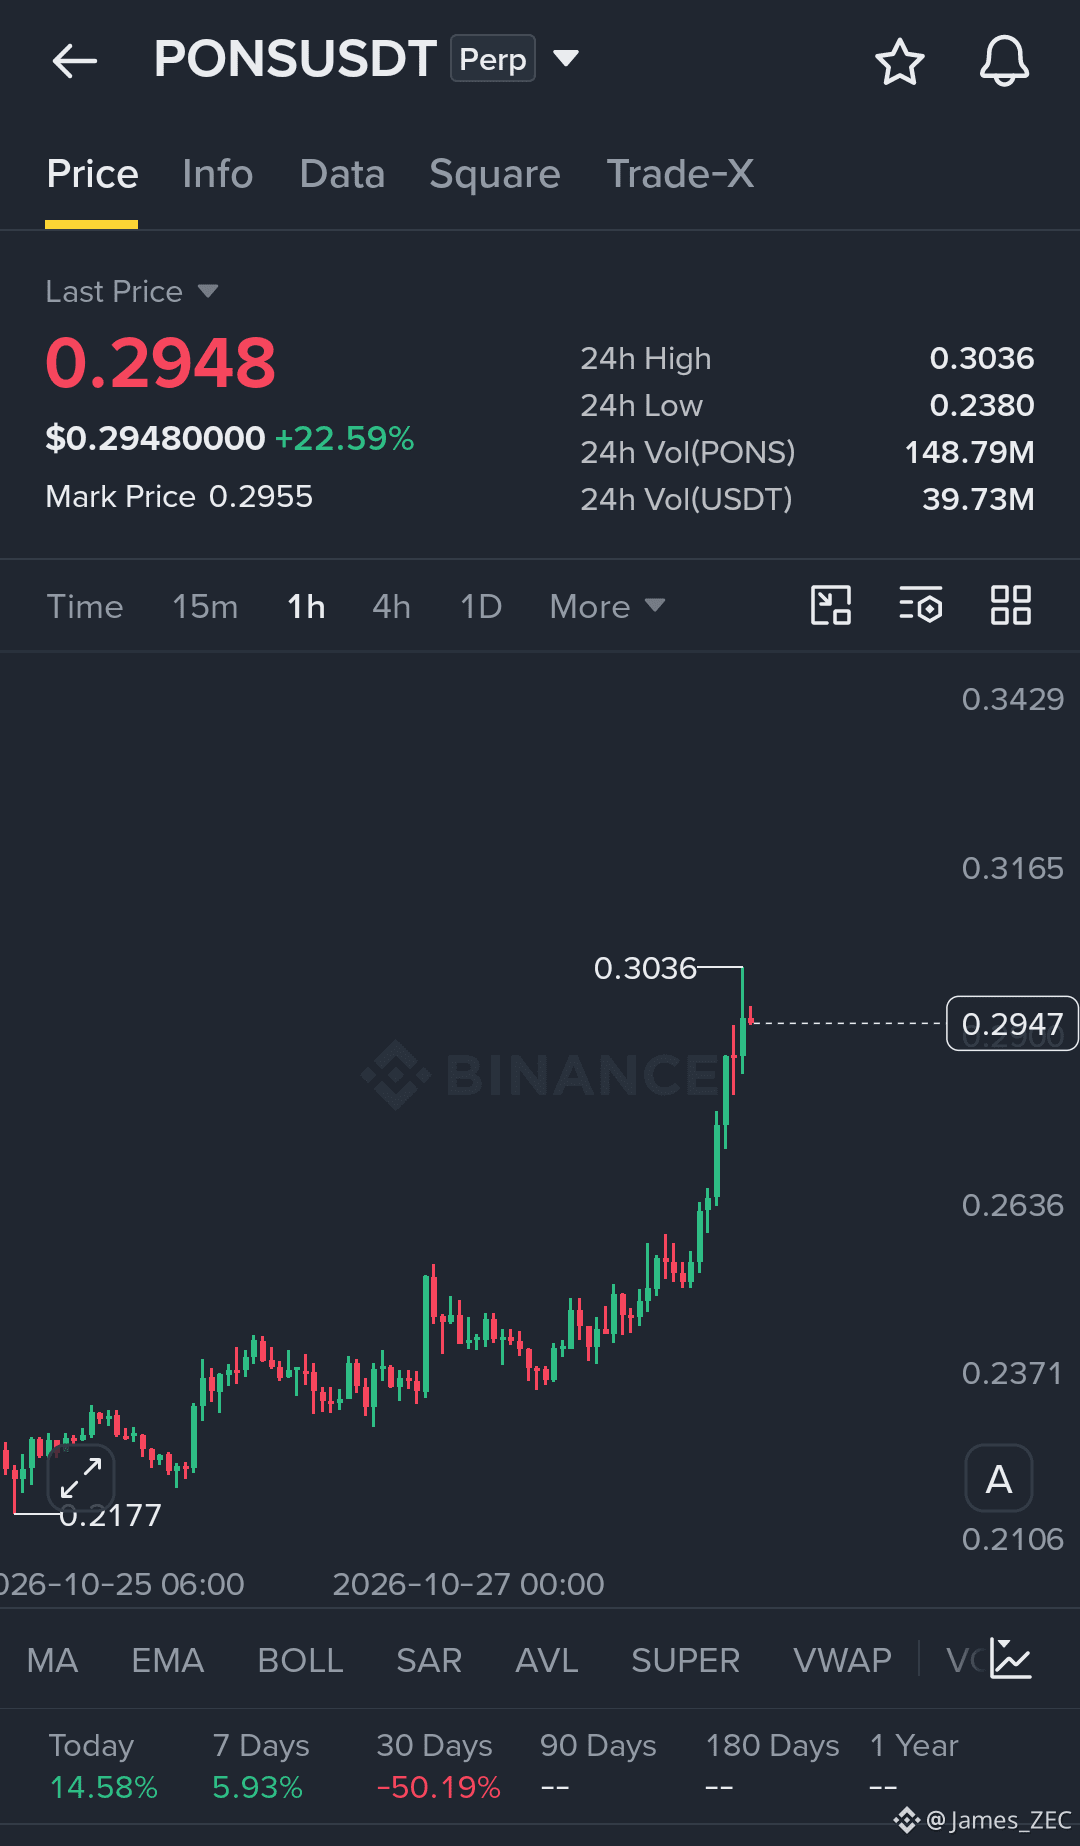
$PONS Momentum Breakout Long Setup
PONS is pushing toward fresh highs, but a controlled retest could offer a better entry.
Long Setup
Entry Zone: 0.2800 – 0.2880
Stop Loss: 0.2690
TP1: 0.3035
TP2: 0.3165
TP3: 0.3290
Chart Analysis
PONSUSDT is showing strong bullish momentum on the 1-hour chart, climbing from the 0.2177 swing low to a recent high of 0.3036. The latest rally has broken above the previous consolidation area, indicating increased buying pressure.
The 0.3036 level is the immediate resistance to watch. A confirmed breakout above this high could open the way toward 0.3165 and potentially 0.3290. If price pulls back, the 0.2800–0.2880 region may act as a retest zone, provided buyers defend it.
Entry Strategy: Avoid chasing the sharp upward move. Look for a pullback and bullish confirmation, or a strong 1-hour close above 0.3036 followed by a successful retest.
Invalidation: A sustained move below 0.2690 weakens this bullish setup.
Manage risk carefully, especially after a rapid rally. Keep risk limited to 1–3% of your deposit per trade. Targets are potential levels, not guaranteed outcomes.
$EVAA
{future}(EVAAUSDT)
$AIN
{future}(AINUSDT)
{future}(PONSUSDT)
$PONS Momentum Breakout Long Setup
PONS is pushing toward fresh highs, but a controlled retest could offer a better entry.
Long Setup
Entry Zone: 0.2800 – 0.2880
Stop Loss: 0.2690
TP1: 0.3035
TP2: 0.3165
TP3: 0.3290
Chart Analysis
PONSUSDT is showing strong bullish momentum on the 1-hour chart, climbing from the 0.2177 swing low to a recent high of 0.3036. The latest rally has broken above the previous consolidation area, indicating increased buying pressure.
The 0.3036 level is the immediate resistance to watch. A confirmed breakout above this high could open the way toward 0.3165 and potentially 0.3290. If price pulls back, the 0.2800–0.2880 region may act as a retest zone, provided buyers defend it.
Entry Strategy: Avoid chasing the sharp upward move. Look for a pullback and bullish confirmation, or a strong 1-hour close above 0.3036 followed by a successful retest.
Invalidation: A sustained move below 0.2690 weakens this bullish setup.
Manage risk carefully, especially after a rapid rally. Keep risk limited to 1–3% of your deposit per trade. Targets are potential levels, not guaranteed outcomes.
$EVAA
$AIN
745
·
--
Рост
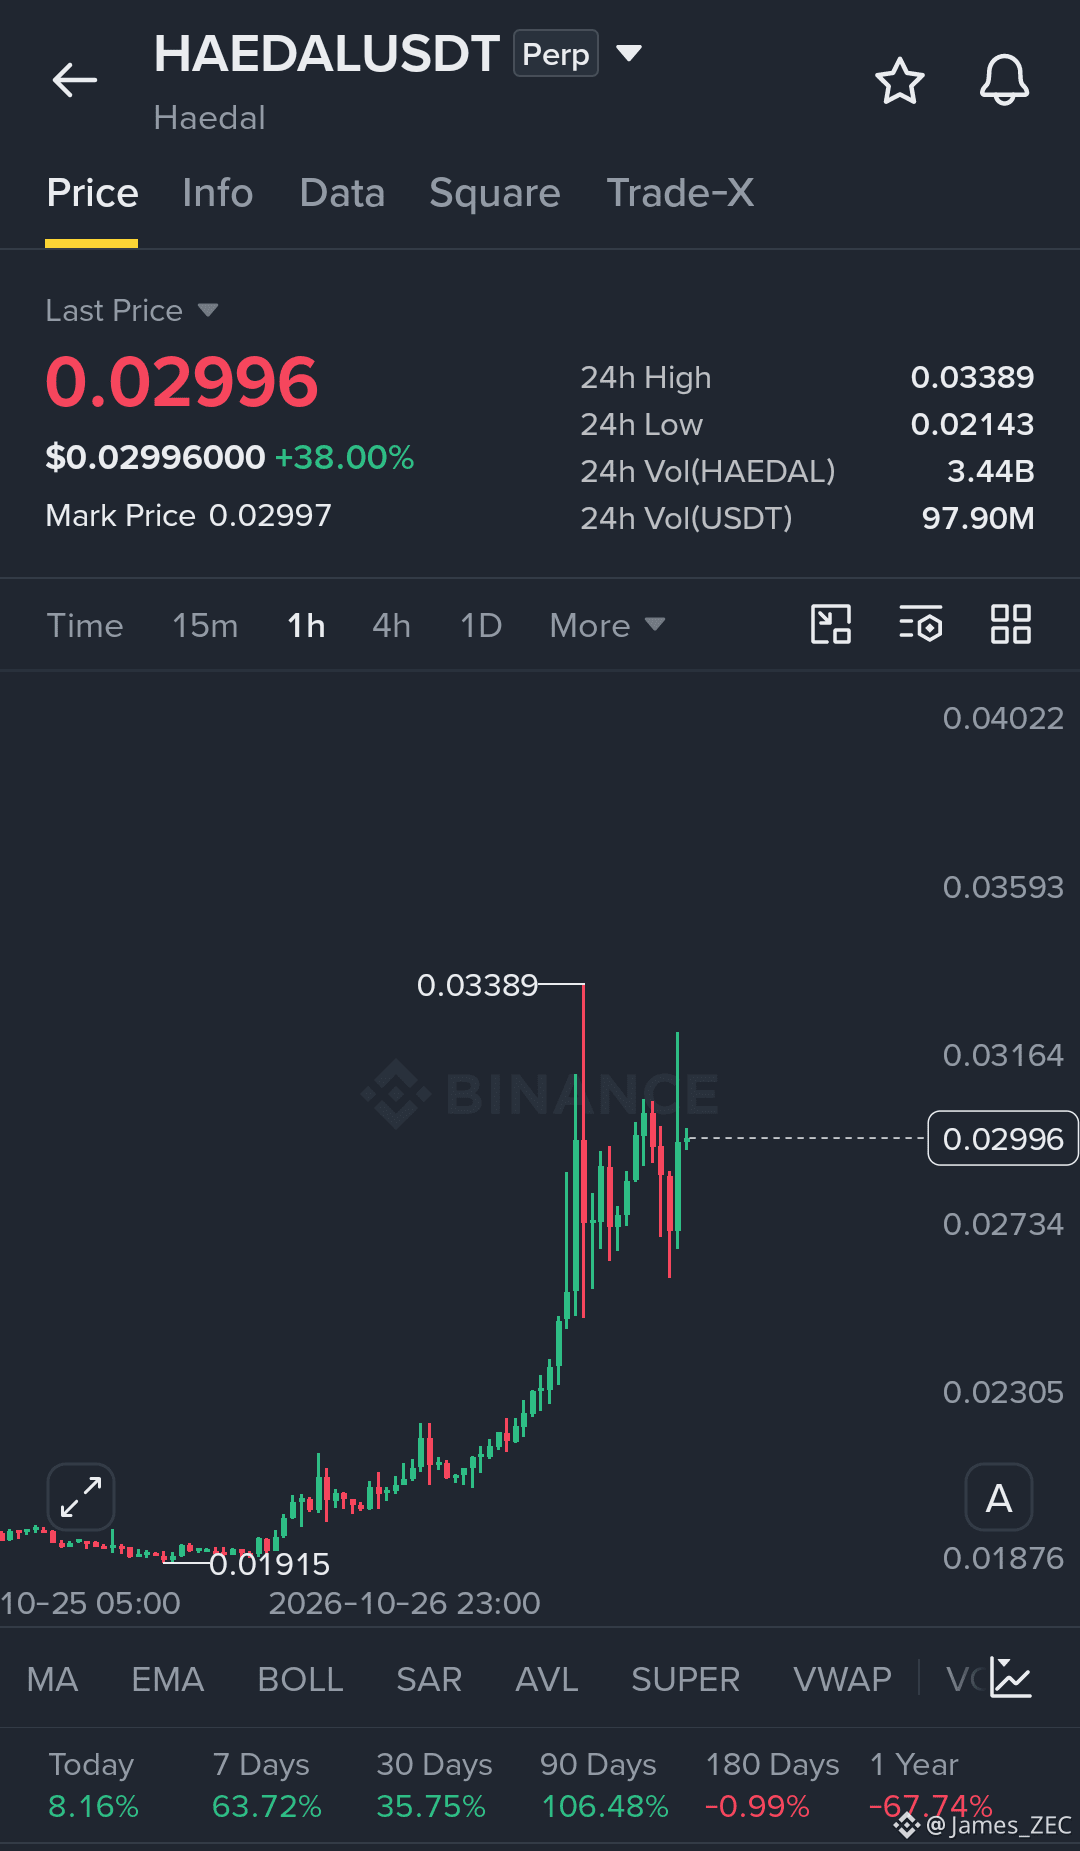
$HAEDAL Momentum Breakout Long Setup
The breakout is strong, but confirmation above resistance is the key to the next move.
Long Setup
Entry Zone: 0.0280 – 0.0292
Stop Loss: 0.0264
TP1: 0.0316
TP2: 0.0339
TP3: 0.0360
Chart Analysis
HAEDALUSDT has surged from the 0.01915 low to a recent high of 0.03389, showing a sharp expansion in bullish momentum. Price is now consolidating around 0.02996 after several volatile candles, suggesting buyers are attempting to maintain control following the rally.
The immediate resistance zone lies between 0.0316 and 0.0339. A confirmed breakout above the recent high could create room for further upside toward 0.0360. On the downside, 0.0280 is an important area to watch for a potential pullback and support retest.
Entry Strategy: Prefer a pullback into the entry zone followed by bullish confirmation, rather than chasing the current price after a rapid rally.
Invalidation: A sustained move below 0.0264 weakens the bullish setup.
Trade carefully. The coin is volatile, and targets are potential levels, not guaranteed outcomes.
$AIN
{future}(AINUSDT)
$EVAA
{future}(EVAAUSDT)
{future}(HAEDALUSDT)
$HAEDAL Momentum Breakout Long Setup
The breakout is strong, but confirmation above resistance is the key to the next move.
Long Setup
Entry Zone: 0.0280 – 0.0292
Stop Loss: 0.0264
TP1: 0.0316
TP2: 0.0339
TP3: 0.0360
Chart Analysis
HAEDALUSDT has surged from the 0.01915 low to a recent high of 0.03389, showing a sharp expansion in bullish momentum. Price is now consolidating around 0.02996 after several volatile candles, suggesting buyers are attempting to maintain control following the rally.
The immediate resistance zone lies between 0.0316 and 0.0339. A confirmed breakout above the recent high could create room for further upside toward 0.0360. On the downside, 0.0280 is an important area to watch for a potential pullback and support retest.
Entry Strategy: Prefer a pullback into the entry zone followed by bullish confirmation, rather than chasing the current price after a rapid rally.
Invalidation: A sustained move below 0.0264 weakens the bullish setup.
Trade carefully. The coin is volatile, and targets are potential levels, not guaranteed outcomes.
$AIN
$EVAA
1
1.8k
·
--
Рост
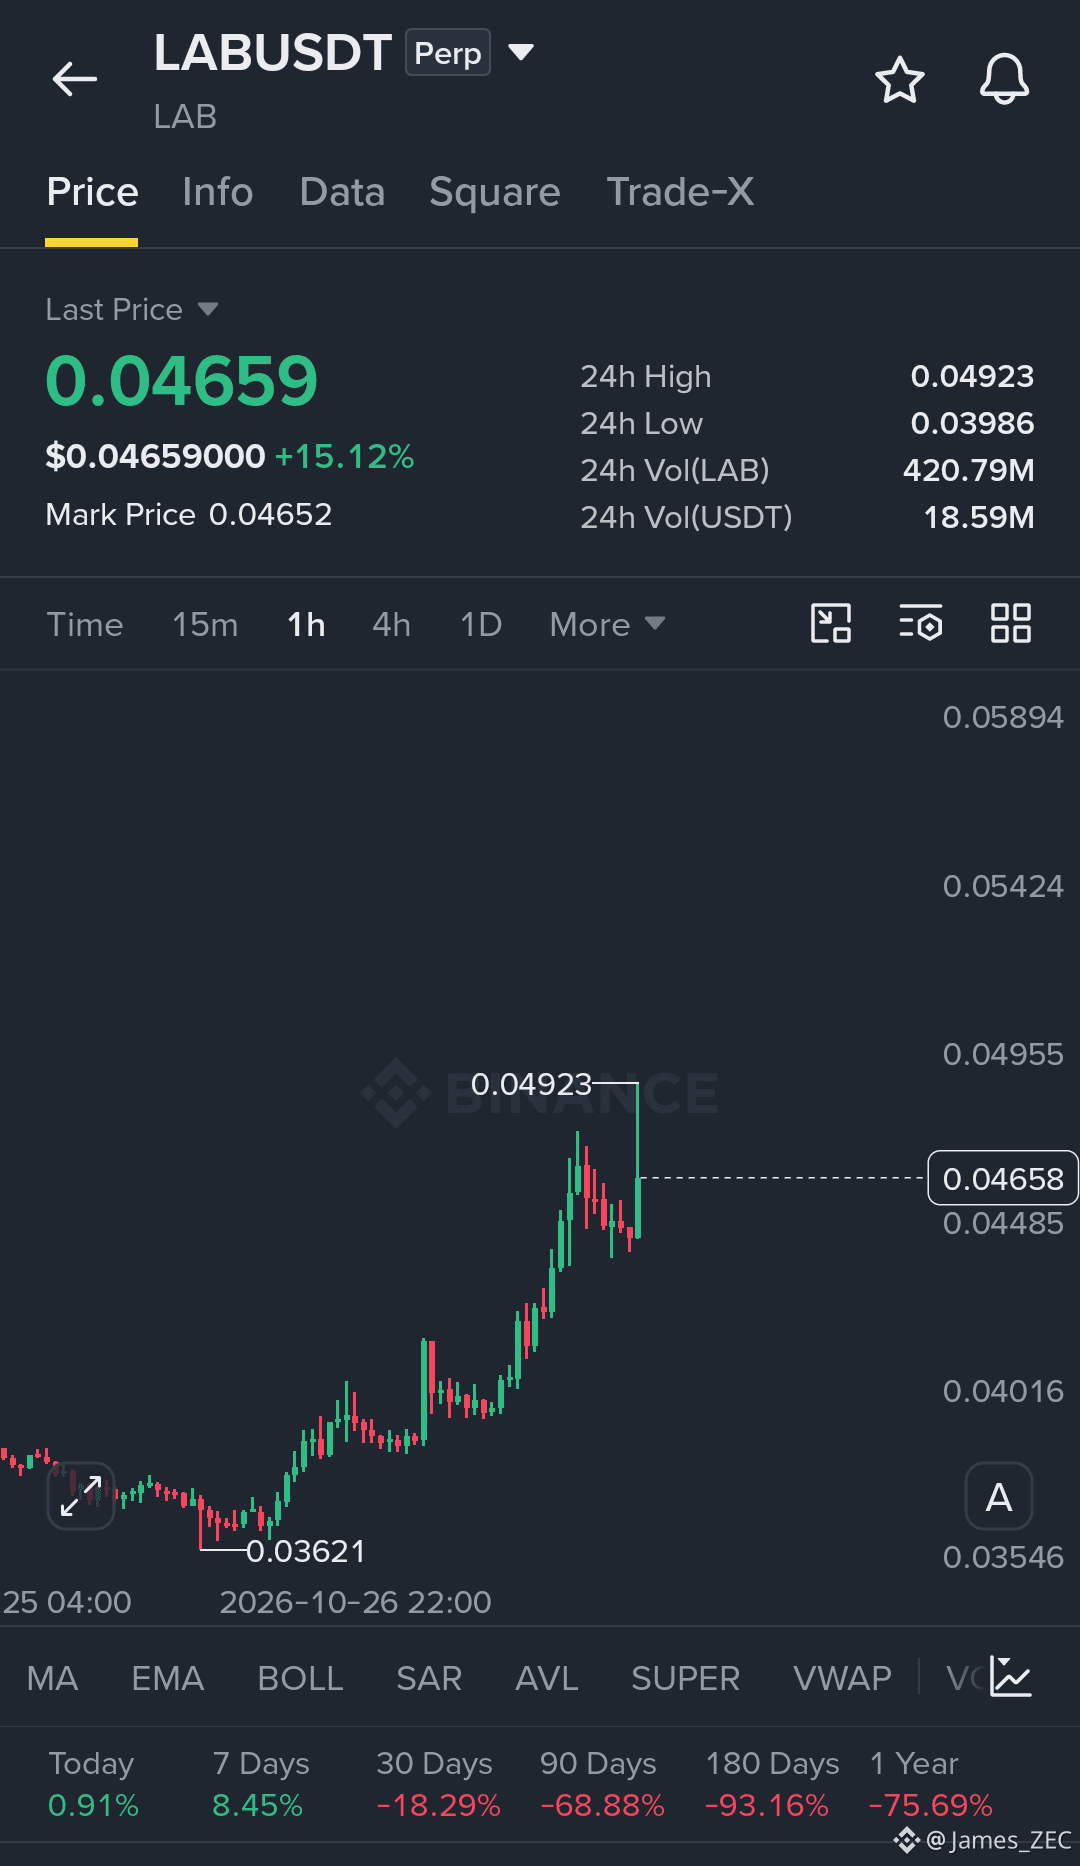
$LAB Bullish Continuation Long Setup
Long Setup
Entry Zone: 0.0448 – 0.0462
Stop Loss: 0.0435
TP1: 0.0492
TP2: 0.0520
TP3: 0.0542
Market Analysis
LAB is showing strong bullish momentum on the 1-hour chart, recovering from the 0.03621 low and climbing toward the recent high at 0.04923. After the sharp rally, price experienced a brief pullback before buyers stepped in again, suggesting that upward momentum may still be active.
The immediate resistance is 0.04923. A confirmed breakout above this level could open the path toward 0.0520 and 0.0542. Meanwhile, the 0.0448–0.0462 area is a potential retest zone where buyers need to maintain support.
Entry Strategy: Look for a pullback and bullish confirmation instead of chasing the current candle.
Invalidation: A sustained move below 0.0435 weakens the bullish setup.
Risk Management: Targets are potential levels, not guaranteed outcomes. Risk only 1–3% of your trading deposit per trade.
{future}(LABUSDT)
$AIN
{future}(AINUSDT)
$EVAA
{future}(EVAAUSDT)
$LAB Bullish Continuation Long Setup
Long Setup
Entry Zone: 0.0448 – 0.0462
Stop Loss: 0.0435
TP1: 0.0492
TP2: 0.0520
TP3: 0.0542
Market Analysis
LAB is showing strong bullish momentum on the 1-hour chart, recovering from the 0.03621 low and climbing toward the recent high at 0.04923. After the sharp rally, price experienced a brief pullback before buyers stepped in again, suggesting that upward momentum may still be active.
The immediate resistance is 0.04923. A confirmed breakout above this level could open the path toward 0.0520 and 0.0542. Meanwhile, the 0.0448–0.0462 area is a potential retest zone where buyers need to maintain support.
Entry Strategy: Look for a pullback and bullish confirmation instead of chasing the current candle.
Invalidation: A sustained move below 0.0435 weakens the bullish setup.
Risk Management: Targets are potential levels, not guaranteed outcomes. Risk only 1–3% of your trading deposit per trade.
$AIN
$EVAA
1.2k
·
--
Рост
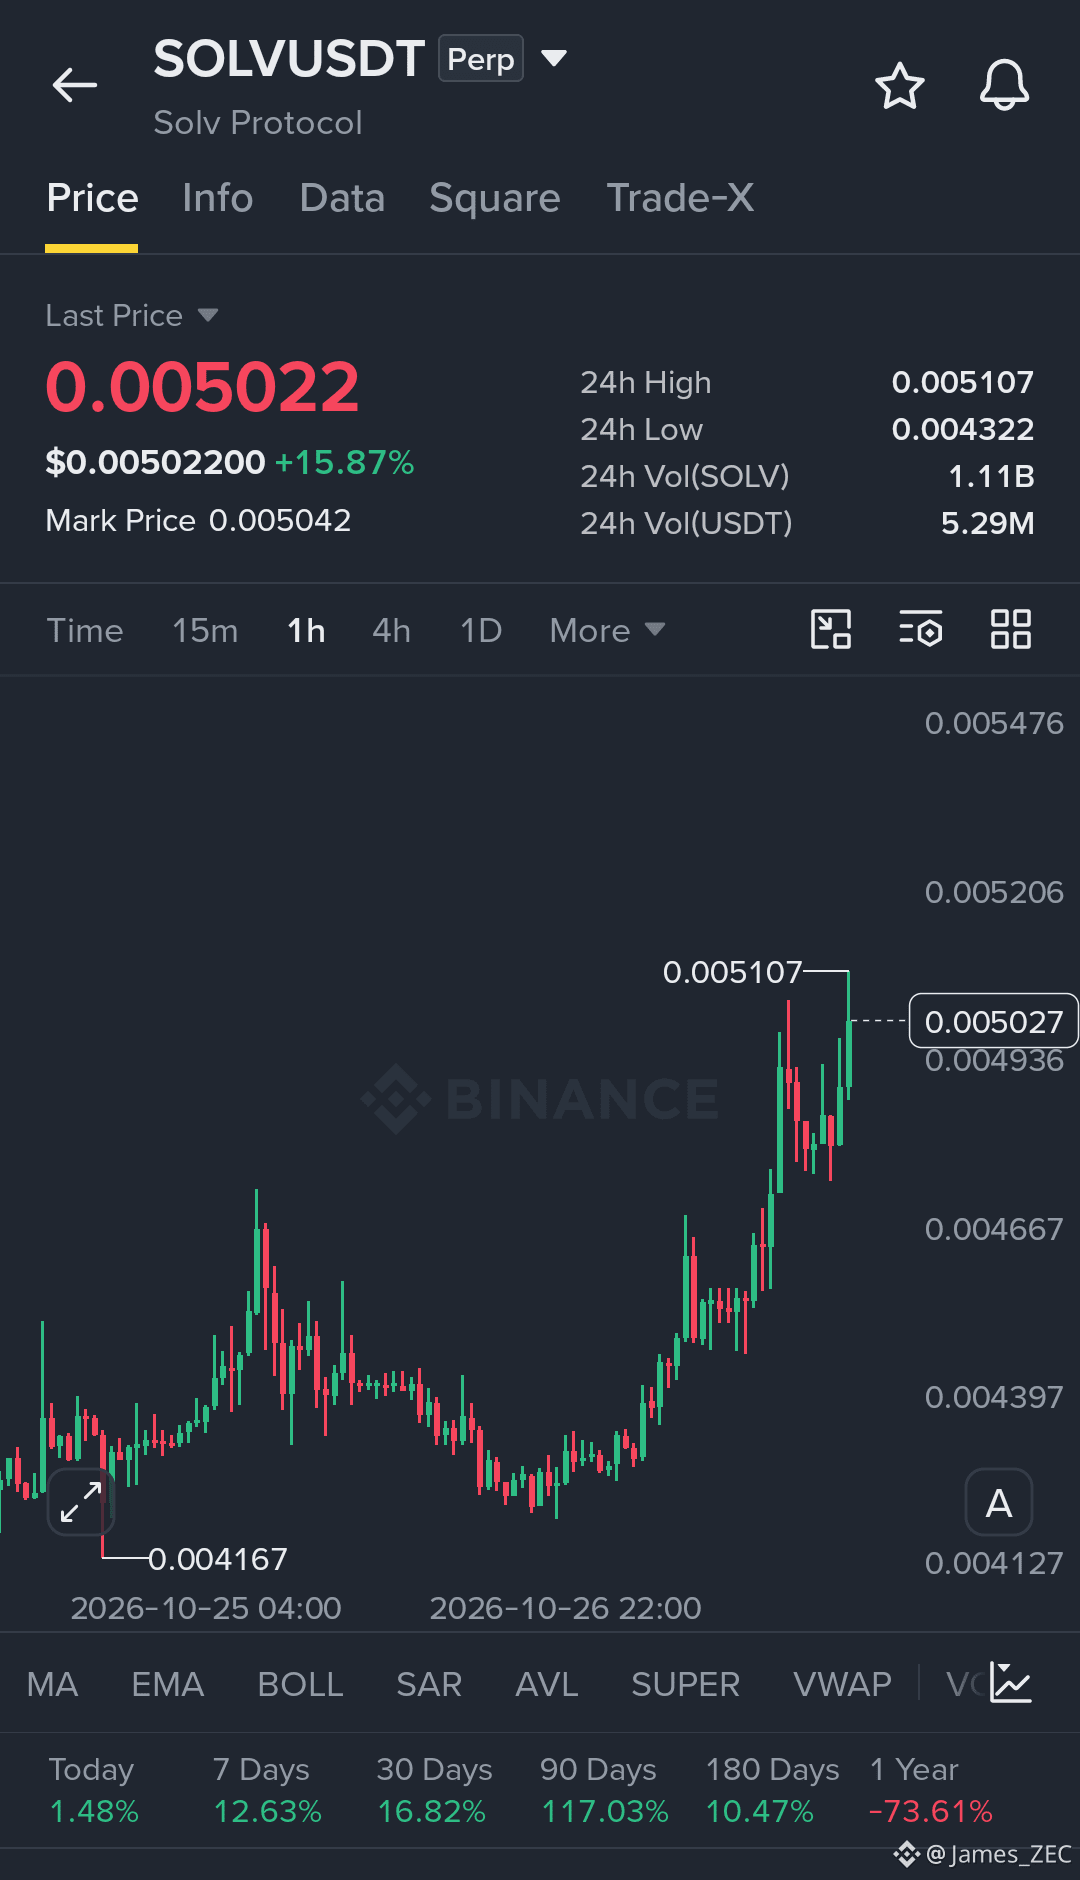
$SOLV Bullish Continuation Long Setup
Long Setup
Entry Zone: 0.00480 – 0.00495
Stop Loss: 0.00462
TP1: 0.005107
TP2: 0.00520
TP3: 0.00540
Market Analysis
SOLV is building strong upward momentum on the 1-hour chart, recovering from the 0.004167 low and pushing toward the recent high at 0.005107. The latest candles show buyers attempting to regain control after a brief pullback.
The 0.005107 level is the immediate resistance. A confirmed breakout above this high could open the path toward 0.00520 and 0.00540. If price is rejected, the 0.00480–0.00495 area could act as a potential retest zone.
Entry Strategy: Wait for a pullback and bullish confirmation rather than chasing the current rally.
Invalidation: A sustained move below 0.00462 weakens the setup.
Risk Management: These targets are conditional, not guaranteed. Risk only 1–3% of your trading deposit per trade and manage leverage carefully.
$AIN
{future}(AINUSDT)
$EVAA
{future}(EVAAUSDT)
{future}(SOLVUSDT)
$SOLV Bullish Continuation Long Setup
Long Setup
Entry Zone: 0.00480 – 0.00495
Stop Loss: 0.00462
TP1: 0.005107
TP2: 0.00520
TP3: 0.00540
Market Analysis
SOLV is building strong upward momentum on the 1-hour chart, recovering from the 0.004167 low and pushing toward the recent high at 0.005107. The latest candles show buyers attempting to regain control after a brief pullback.
The 0.005107 level is the immediate resistance. A confirmed breakout above this high could open the path toward 0.00520 and 0.00540. If price is rejected, the 0.00480–0.00495 area could act as a potential retest zone.
Entry Strategy: Wait for a pullback and bullish confirmation rather than chasing the current rally.
Invalidation: A sustained move below 0.00462 weakens the setup.
Risk Management: These targets are conditional, not guaranteed. Risk only 1–3% of your trading deposit per trade and manage leverage carefully.
$AIN
$EVAA
670
·
--
Рост
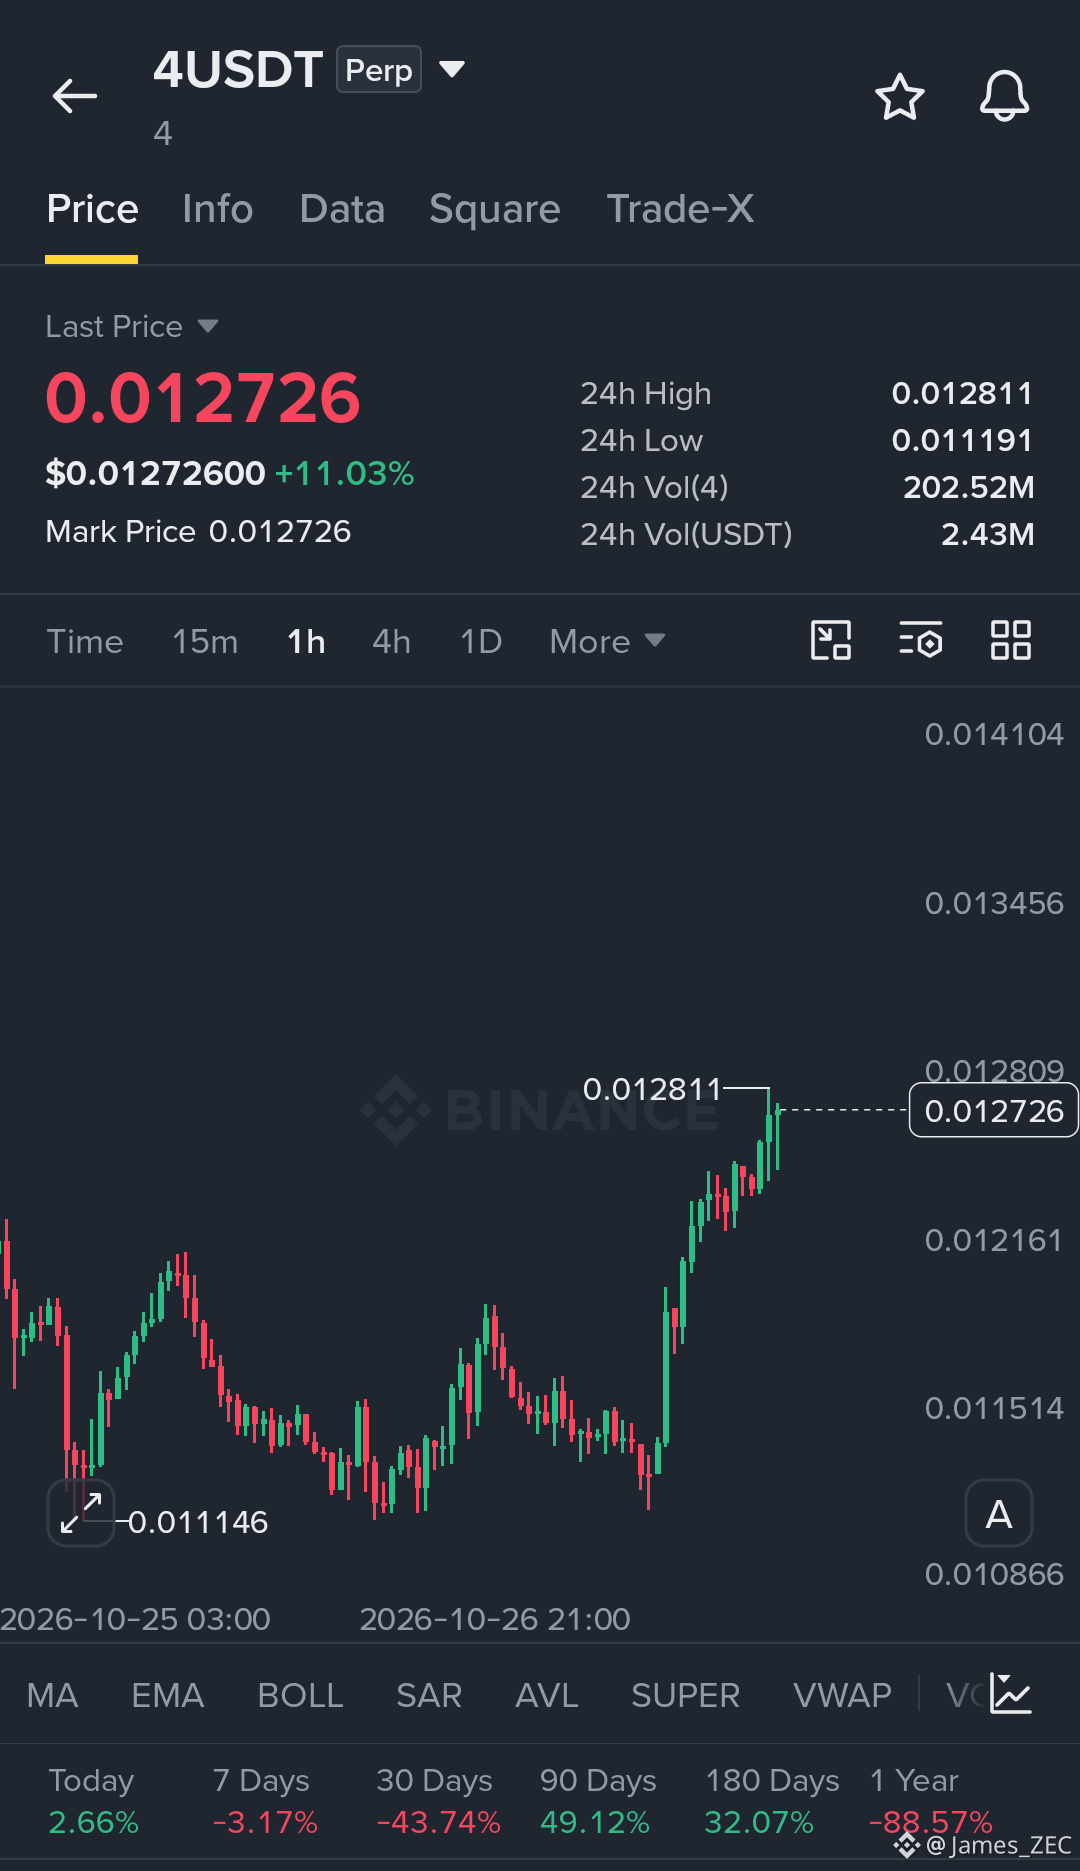
$4 Momentum Breakout Long Setup
Long Setup
Entry Zone: 0.01220 – 0.01255
Stop Loss: 0.01185
TP1: 0.01281
TP2: 0.01320
TP3: 0.01345
Market Analysis
4/USDT is showing a strong bullish recovery on the 1-hour chart, rising from the 0.011146 low toward the recent high at 0.012811. The sharp upward move indicates strengthening buying pressure, but price is now testing immediate resistance.
A confirmed breakout above 0.012811 could open the way toward 0.01320 and 0.01345. If resistance holds, a pullback toward 0.01220–0.01255 may provide a better entry opportunity, provided buyers defend the zone.
Entry Strategy: Wait for a controlled pullback and bullish confirmation. Avoid chasing the price near resistance.
Invalidation: A sustained move below 0.01185 weakens the setup.
Risk Management: Targets are potential levels, not guarantees. Risk only 1–3% of your trading deposit per trade and use disciplined leverage.
$AIN
{future}(AINUSDT)
$EVAA
{future}(EVAAUSDT)
{future}(4USDT)
$4 Momentum Breakout Long Setup
Long Setup
Entry Zone: 0.01220 – 0.01255
Stop Loss: 0.01185
TP1: 0.01281
TP2: 0.01320
TP3: 0.01345
Market Analysis
4/USDT is showing a strong bullish recovery on the 1-hour chart, rising from the 0.011146 low toward the recent high at 0.012811. The sharp upward move indicates strengthening buying pressure, but price is now testing immediate resistance.
A confirmed breakout above 0.012811 could open the way toward 0.01320 and 0.01345. If resistance holds, a pullback toward 0.01220–0.01255 may provide a better entry opportunity, provided buyers defend the zone.
Entry Strategy: Wait for a controlled pullback and bullish confirmation. Avoid chasing the price near resistance.
Invalidation: A sustained move below 0.01185 weakens the setup.
Risk Management: Targets are potential levels, not guarantees. Risk only 1–3% of your trading deposit per trade and use disciplined leverage.
$AIN
$EVAA
1
857
Войдите, чтобы посмотреть больше материала
Присоединяйтесь к пользователям криптовалют по всему миру на Binance Square
⚡️ Получайте новейшую и полезную информацию о криптоактивах.
💬 Нам доверяет крупнейшая в мире криптобиржа.
👍 Получите достоверные аналитические данные от верифицированных создателей контента.
Эл. почта/номер телефона
В тренде
$1.5BInLeveragedCryptoBetsLiquidated
Просмотров: 893
29 обсуждают
@CZ warned users not to click links in emails or download attachments, even from people they trust, as they could contain viruses. #ElonMusk reacted to CZ’s post with fire and laughing emojis.
$DOGE $BNB $BTC
#$1.5BInLeveragedCryptoBetsLiquidated #USMidtermElections #BinanceWillListPredictPREDICT #CZ
Crypto Ahmet
·Лайков: 5
·Просмотров: 1.6k
KOSPIFalls3.53%BackBelow6000
Просмотров: 3,609
115 обсуждают
USMidtermElections
Просмотров: 105,460
1,358 обсуждают