
RaoArshad992
1 Публикации

RaoArshad992
Отправить жалобу
Заблокировать пользователя
crypto analysis expert Rao brand
10 подписок(и/а)
1 подписчиков(а)
0 понравилось
Посты
·
--
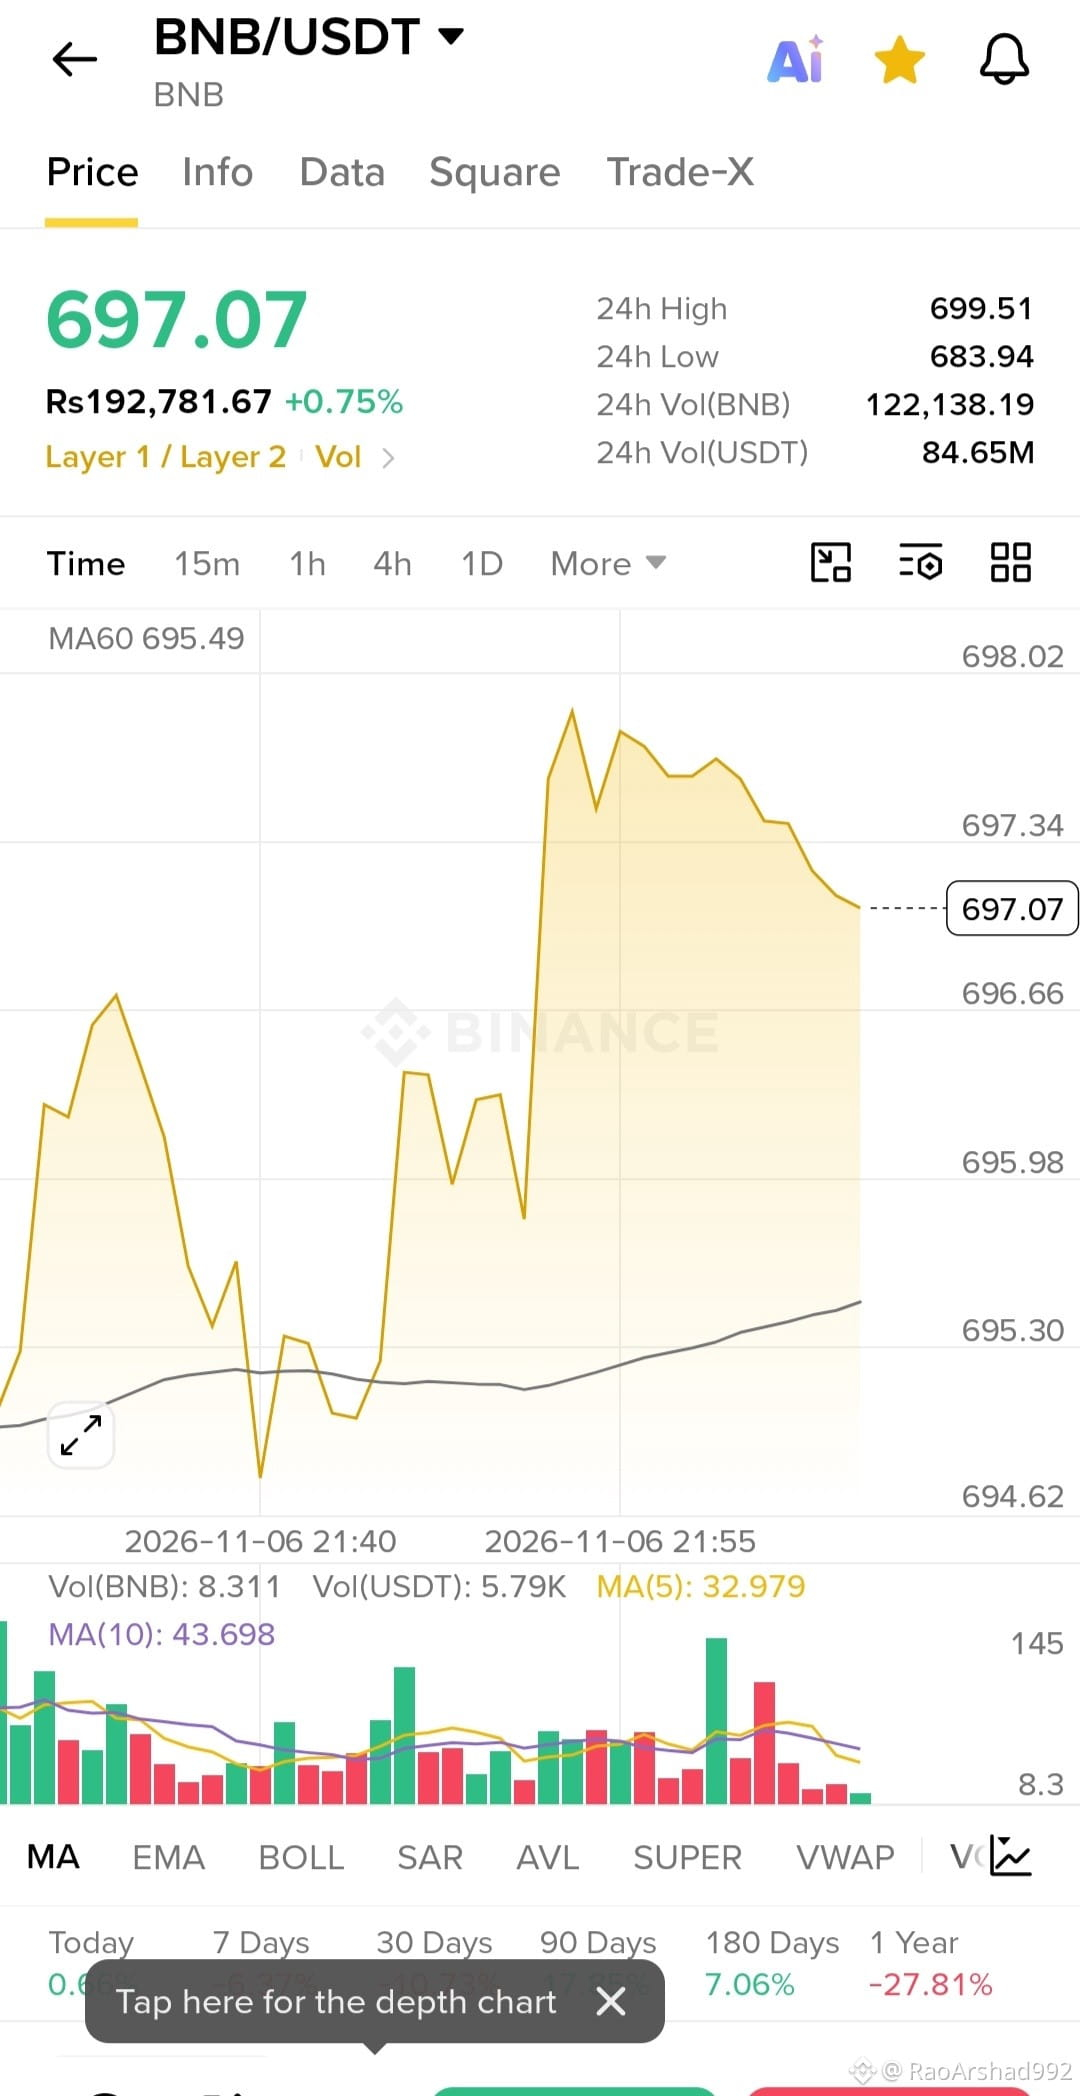
$BNB Based on the provided screenshot of the BNB/USDT chart on Binance, here is a short-term (1-hour) crypto analysis:
Current Market State:
· Price: 697.07 USDT (up +0.75% in the last 24 hours).
· Trend: Short-term bullish, but currently in a minor retracement from a local high.
· Timeframe: The visible chart is set to a very short-term view (likely 15-minute candles based on the axis timestamps).
Key Observations:
1. Resistance Hit: The price spiked sharply recently but faced immediate rejection near the 24h high of 699.51. It failed to break the psychological 700 USDT barrier.
2. Moving Averages: The price is currently hovering just above the gray MA60 line (695.49) and sits above the shorter-term moving averages in the volume pane. This suggests the underlying short-term trend remains intact.
3. Volume: The large green volume bar accompanying the recent price spike indicates strong buying pressure during that move. However, volume has tapered off slightly as the price consolidates downward.
1-Hour Outlook:
· Consolidation: Expect the price to consolidate or chop sideways in the 696.00 – 698.00 range as the market digests the recent volatility.
· Support: The immediate strong support level is around 695.50 (the MA60 line). If the price drops below this on higher volume, look for support near the recent intraday lows around 694.60.
· Resistance: The immediate upside hurdle is the 699.51 level. A 1-hour candle close above this level could signal a push toward 700+.
Summary: Short-term bullish but pausing. Watch for a bounce off the 695.50 MA60 line to confirm continued upward momentum, or a break below it for a short-term pullback.
Disclaimer: This is a technical analysis based on a screenshot and does not constitute financial advice. Crypto markets are highly volatile
$BNB
#JobsReportRaisesHikeOdds
#USNovemberMichiganExpectationsIndexPrelimAt50.9
#TradFiForBeginners
#USMidtermsCouldShakeUpUS-IranTies
#HyperliquidStrategiesHolds38.52MillionHYPE
{future}(BNBUSDT)
$BNB Based on the provided screenshot of the BNB/USDT chart on Binance, here is a short-term (1-hour) crypto analysis:
Current Market State:
· Price: 697.07 USDT (up +0.75% in the last 24 hours).
· Trend: Short-term bullish, but currently in a minor retracement from a local high.
· Timeframe: The visible chart is set to a very short-term view (likely 15-minute candles based on the axis timestamps).
Key Observations:
1. Resistance Hit: The price spiked sharply recently but faced immediate rejection near the 24h high of 699.51. It failed to break the psychological 700 USDT barrier.
2. Moving Averages: The price is currently hovering just above the gray MA60 line (695.49) and sits above the shorter-term moving averages in the volume pane. This suggests the underlying short-term trend remains intact.
3. Volume: The large green volume bar accompanying the recent price spike indicates strong buying pressure during that move. However, volume has tapered off slightly as the price consolidates downward.
1-Hour Outlook:
· Consolidation: Expect the price to consolidate or chop sideways in the 696.00 – 698.00 range as the market digests the recent volatility.
· Support: The immediate strong support level is around 695.50 (the MA60 line). If the price drops below this on higher volume, look for support near the recent intraday lows around 694.60.
· Resistance: The immediate upside hurdle is the 699.51 level. A 1-hour candle close above this level could signal a push toward 700+.
Summary: Short-term bullish but pausing. Watch for a bounce off the 695.50 MA60 line to confirm continued upward momentum, or a break below it for a short-term pullback.
Disclaimer: This is a technical analysis based on a screenshot and does not constitute financial advice. Crypto markets are highly volatile
$BNB
#JobsReportRaisesHikeOdds
#USNovemberMichiganExpectationsIndexPrelimAt50.9
#TradFiForBeginners
#USMidtermsCouldShakeUpUS-IranTies
#HyperliquidStrategiesHolds38.52MillionHYPE
Current Market State:
· Price: 697.07 USDT (up +0.75% in the last 24 hours).
· Trend: Short-term bullish, but currently in a minor retracement from a local high.
· Timeframe: The visible chart is set to a very short-term view (likely 15-minute candles based on the axis timestamps).
Key Observations:
1. Resistance Hit: The price spiked sharply recently but faced immediate rejection near the 24h high of 699.51. It failed to break the psychological 700 USDT barrier.
2. Moving Averages: The price is currently hovering just above the gray MA60 line (695.49) and sits above the shorter-term moving averages in the volume pane. This suggests the underlying short-term trend remains intact.
3. Volume: The large green volume bar accompanying the recent price spike indicates strong buying pressure during that move. However, volume has tapered off slightly as the price consolidates downward.
1-Hour Outlook:
· Consolidation: Expect the price to consolidate or chop sideways in the 696.00 – 698.00 range as the market digests the recent volatility.
· Support: The immediate strong support level is around 695.50 (the MA60 line). If the price drops below this on higher volume, look for support near the recent intraday lows around 694.60.
· Resistance: The immediate upside hurdle is the 699.51 level. A 1-hour candle close above this level could signal a push toward 700+.
Summary: Short-term bullish but pausing. Watch for a bounce off the 695.50 MA60 line to confirm continued upward momentum, or a break below it for a short-term pullback.
Disclaimer: This is a technical analysis based on a screenshot and does not constitute financial advice. Crypto markets are highly volatile
$BNB
#JobsReportRaisesHikeOdds
#USNovemberMichiganExpectationsIndexPrelimAt50.9
#TradFiForBeginners
#USMidtermsCouldShakeUpUS-IranTies
#HyperliquidStrategiesHolds38.52MillionHYPE
27
Войдите, чтобы посмотреть больше материала
Присоединяйтесь к пользователям криптовалют по всему миру на Binance Square
⚡️ Получайте новейшую и полезную информацию о криптоактивах.
💬 Нам доверяет крупнейшая в мире криптобиржа.
👍 Получите достоверные аналитические данные от верифицированных создателей контента.
Эл. почта/номер телефона
В тренде
BitcoinRebounds$75KAsChipsLead
Просмотров: 18
19 обсуждают
Market Watch | Bitcoin Rebounds to $75,600 After Dip Below $75,000 as Chip Stocks Lead Rally on Jobs Beat
Binance News
·Лайков: 1
·Просмотров: 1.1k
JobsReportRaisesHikeOdds
Просмотров: 24,252
475 обсуждают
US Data Center Rules May Constrain AI Expansion
Просмотров: 3,756
58 обсуждают