

TheCryptoOnur
2.9k Публикации

TheCryptoOnur
Отправить жалобу
Заблокировать пользователя
Social Media Content Creator / Full Stack Developer www.cryptoonur.xyz
57 подписок(и/а)
3.3K+ подписчиков(а)
1.0K+ понравилось
Посты
Все
Цитирования
Видео
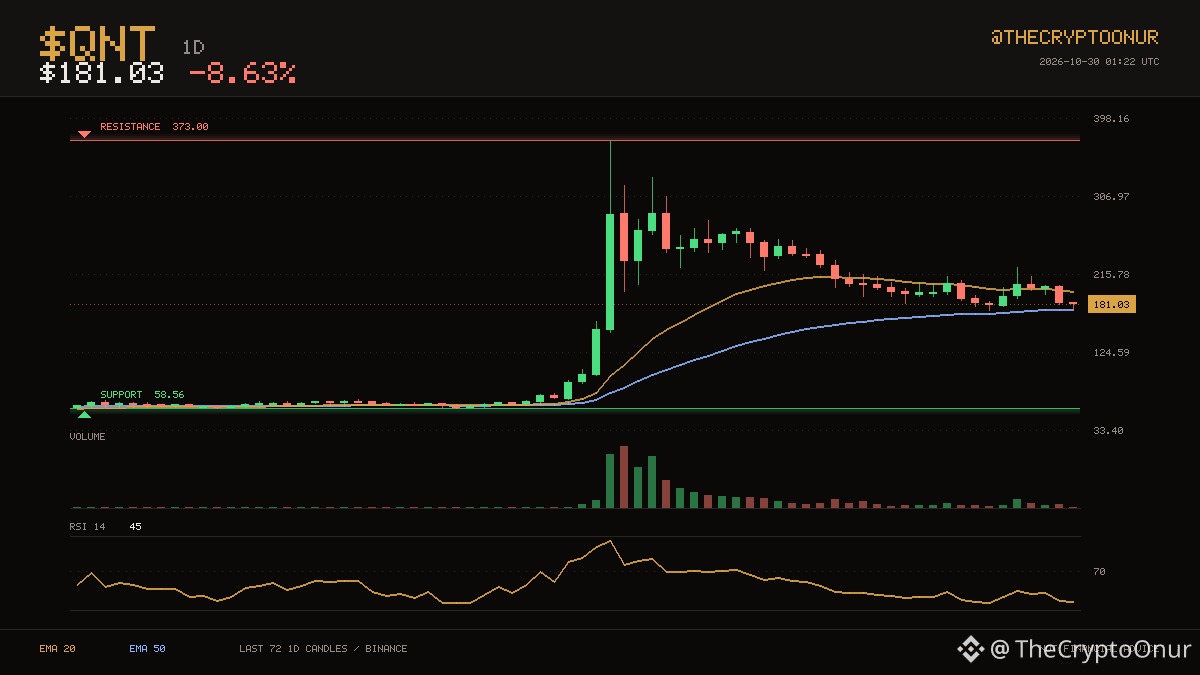
📉 $QNT · 1D
$QNT is at $181.03, with one average above price and one below. The two month range runs from $58.56 up to $373.00. Price is roughly mid range here. Both edges of the range are far from here, so neither is in play yet. Averages have been ordered the same way for 55 candles, with the 20 above the 50. Momentum is mid range with RSI at 45. The 24 hour range runs $175.15 to $200.00, and price is near the bottom of it. Volume over the past day is running about 1.7x the recent average, so there is real participation behind this. Down 8.6% over 24 hours.
DYOR
$QNT #Crypto
7
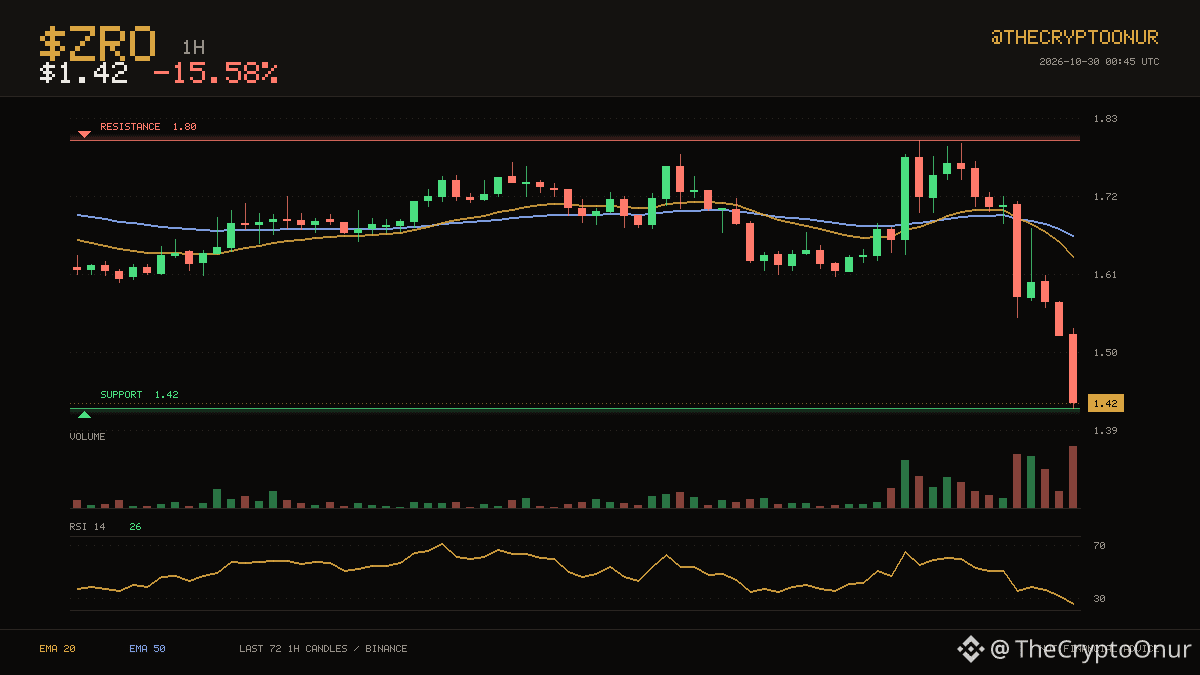
🔴 $ZRO · 1H
Price is $1.42 and $ZRO remains below the averages that capped it earlier. Buyers have been showing up around $1.42, which is where price is sitting now. It is sitting in the bottom third of the range. Support is the near one at 0.5% below; the range high is far above. This shift is fresh: the 20 has been below the 50 for only 4 candles. RSI has dropped to 26, the kind of reading that usually comes with a bounce attempt. The 24 hour range runs $1.42 to $1.80, and price is near the bottom of it. Volume over the past day is running about 3.2x the recent average, so there is real participation behind this. Down 15.6% over 24 hours.
⚠️ DYOR
$ZRO #Crypto
21
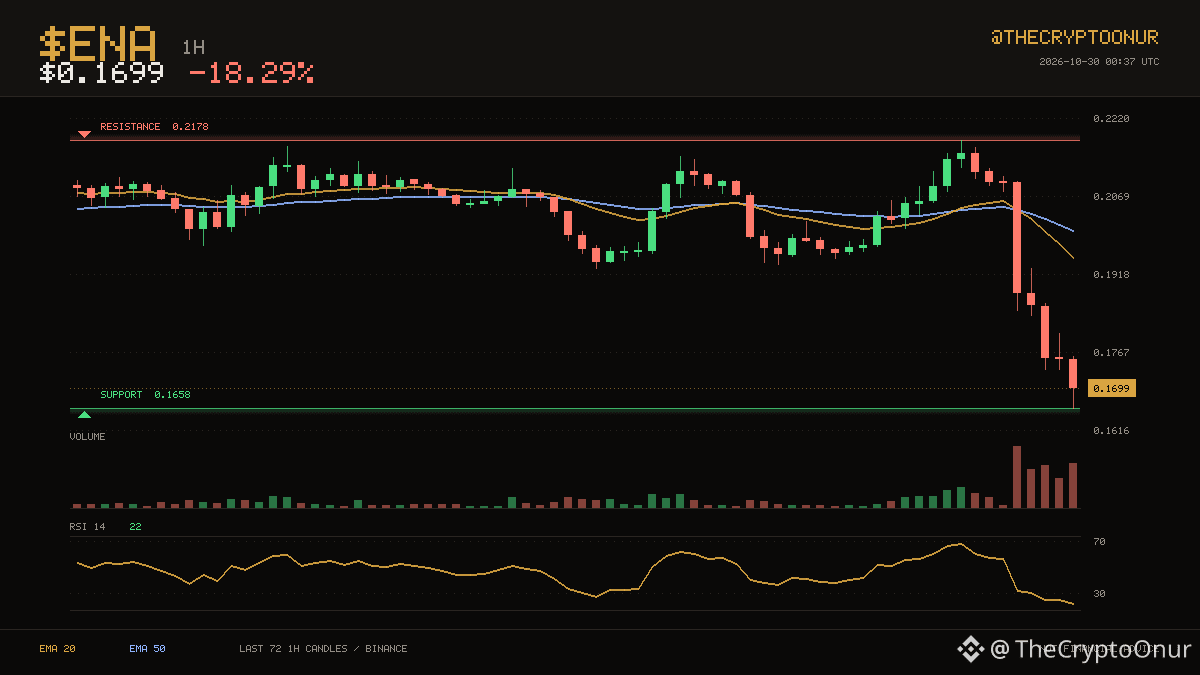
📉 $ENA · 1H
Buyers have been showing up around $0.1658, which is where price is sitting now. $ENA is at $0.1699, under both its 20 and 50 hourly averages. It is sitting in the bottom third of the range. Support is the near one at 2.4% below; the range high is far above. This shift is fresh: the 20 has been below the 50 for only 4 candles. RSI has dropped to 22, the kind of reading that usually comes with a bounce attempt. The 24 hour range runs $0.1658 to $0.2178, and price is near the bottom of it. Volume over the past day is running about 2.9x the recent average, so there is real participation behind this. Down 18.3% over 24 hours.
Binance spot data. ⚠️ DYOR
$ENA #Binance
39
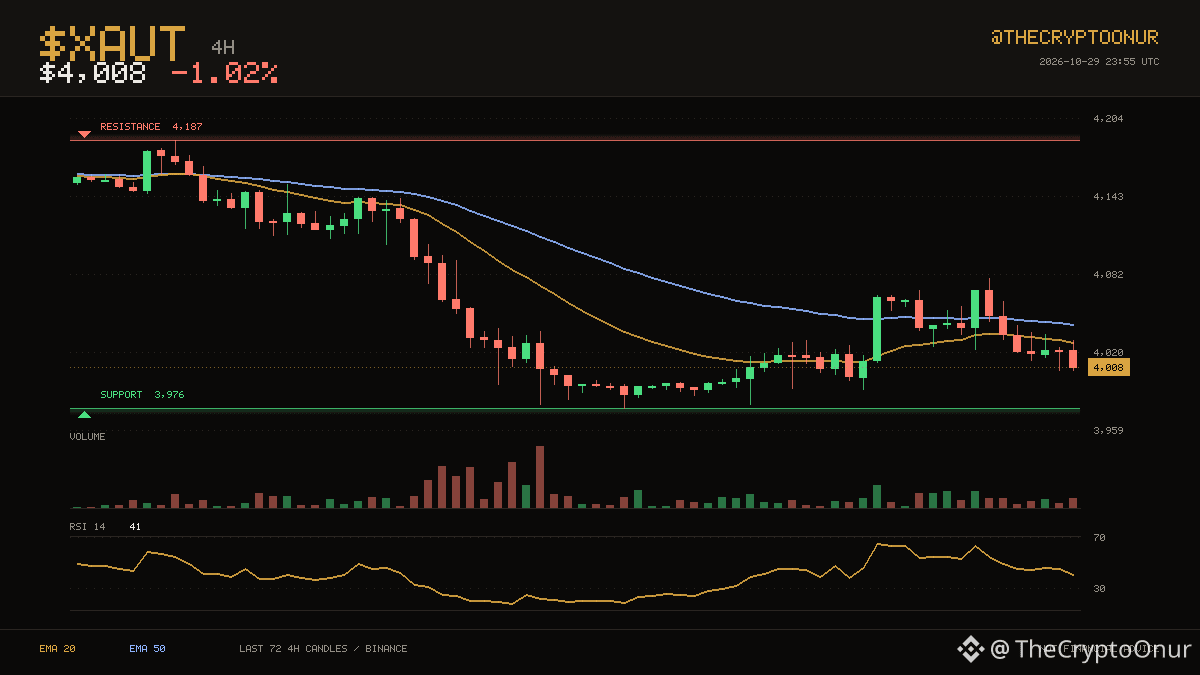
📉 $XAUT · 4H
Buyers have been showing up around $3,976, which is where price is sitting now. $XAUT is at $4,008, under both its 20 and 50 4-hour averages. It is sitting in the bottom third of the range. Support is 0.8% below, which is close enough to be tested quickly. Averages have been ordered the same way for a long stretch now, with the 20 below the 50. Momentum is mid range with RSI at 41. The 24 hour range runs $4,007 to $4,060, and price is near the bottom of it. Volume is close to normal at 0.9x the recent average. Down 1.0% over 24 hours.
Binance spot data. DYOR
$XAUT #Binance
4
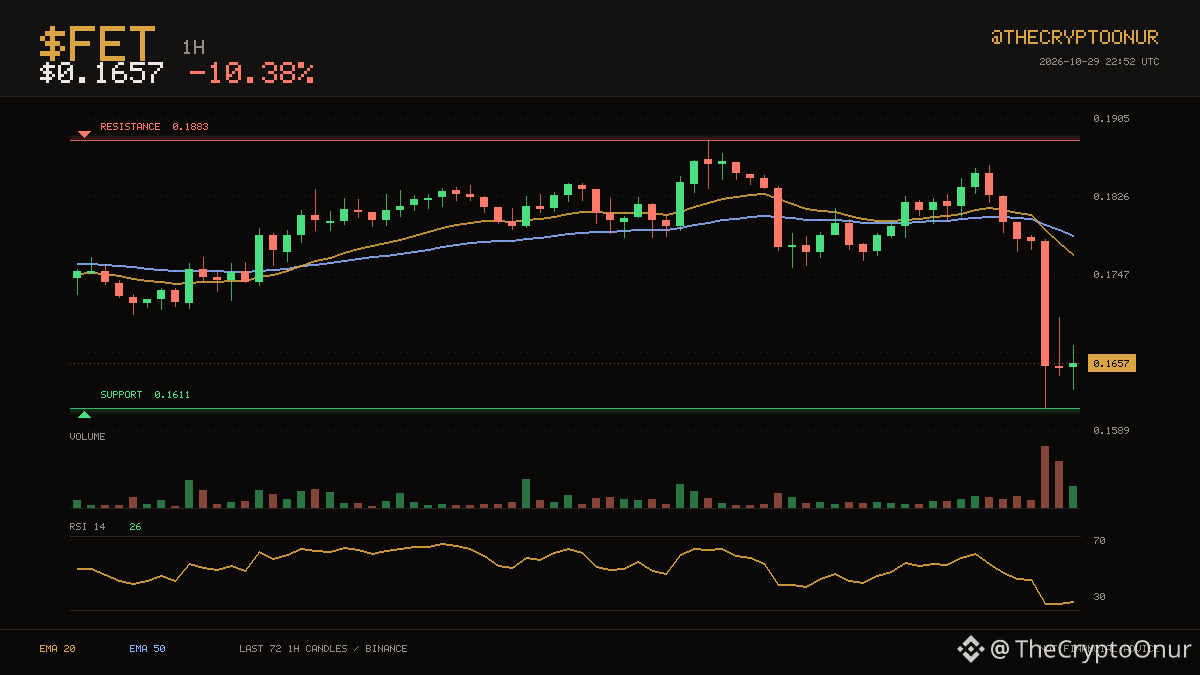
📉 $FET · 1H
$FET trades at $0.1657, still on the weak side of its hourly averages. The $0.1611 area held twice over the last three days and is being tested again. Price is down in the lower third of that range. That is 13.6% to the ceiling and 2.8% to the floor. The 20 crossed below the 50 recently, for only 3 candles, so this leg is still young. RSI at 26 is deep in oversold territory. Over the past day it has traded between $0.1611 and $0.1857, sitting near the bottom of it now. The last 24 hours carried roughly 1.8x normal volume. Down 10.4% over 24 hours.
⚠️ DYOR
$FET #Trading
13
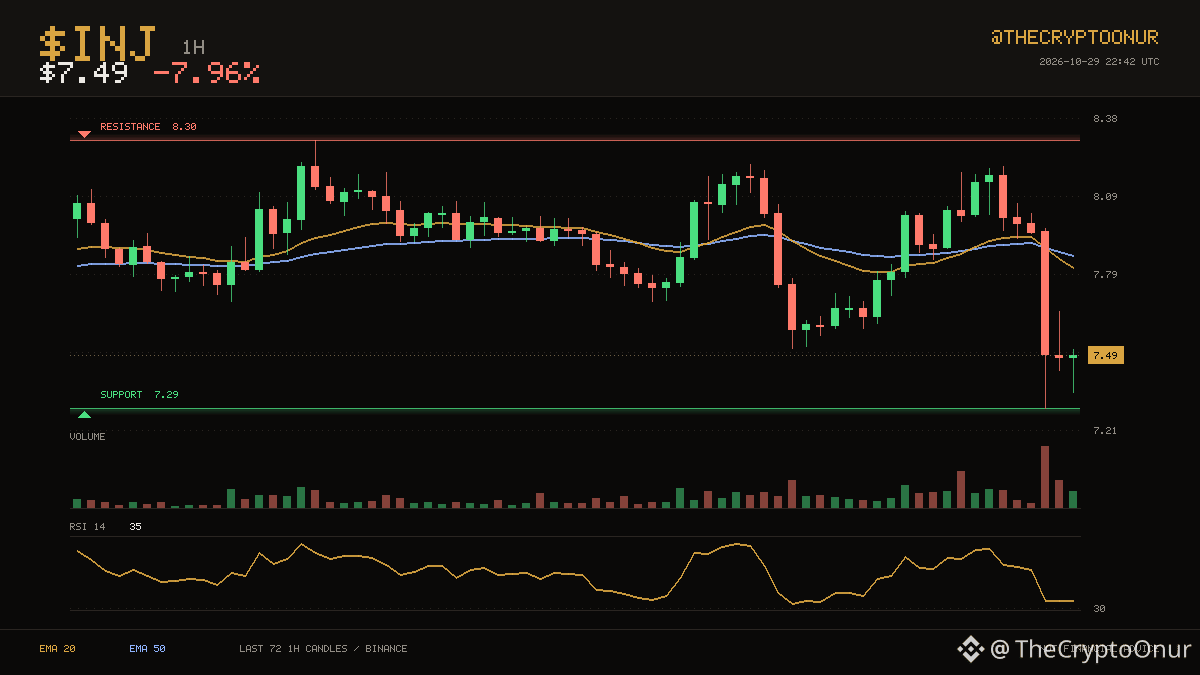
📉 $INJ · 1H
The $7.29 area held twice over the last three days and is being tested again. $INJ is at $7.49, under both its 20 and 50 hourly averages. Price is down in the lower third of that range. That is 10.8% to the ceiling and 2.7% to the floor. The 20 crossed below the 50 recently, for only 3 candles, so this leg is still young. RSI at 35 is neutral, so momentum is not blocking a move either way. Over the past day it has traded between $7.29 and $8.21, sitting near the bottom of it now. The last 24 hours carried roughly 2.2x normal volume. Down 8.0% over 24 hours.
DYOR
$INJ #Binance
18
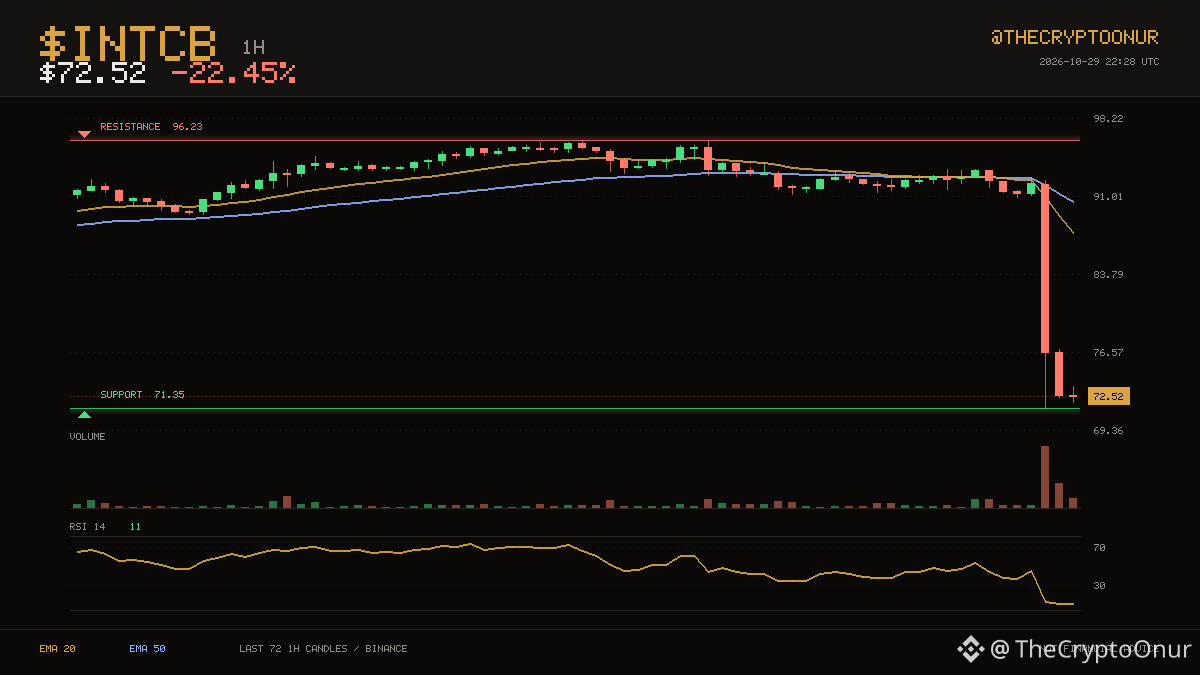
📉 $INTCB · 1H
The $71.35 area held twice over the last three days and is being tested again. $INTCB is at $72.52, under both its 20 and 50 hourly averages. Price is down in the lower third of that range. The floor is 1.6% away and the ceiling is nowhere close. The 20 crossed below the 50 recently, for only 7 candles, so this leg is still young. RSI at 11 is deep in oversold territory. Over the past day it has traded between $71.35 and $93.92, sitting near the bottom of it now. The last 24 hours carried roughly 3.6x normal volume. Down 22.5% over 24 hours.
⚠️ DYOR
$INTCB #Binance
3
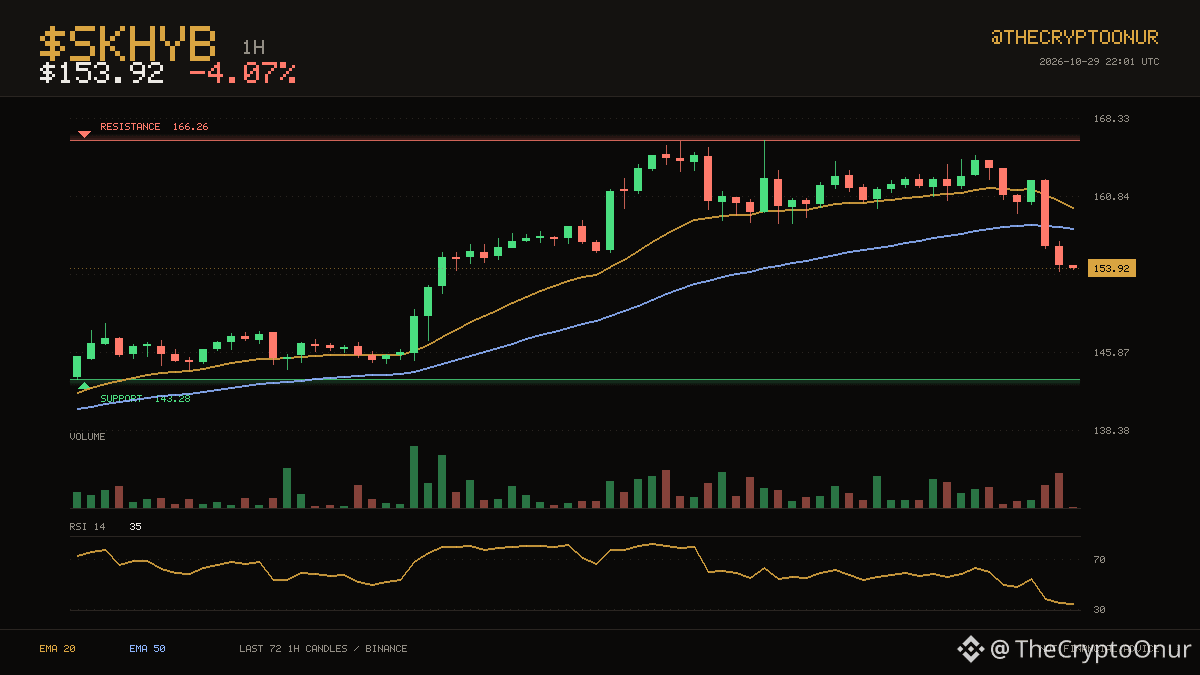
🔴 $SKHYB · 1H
Price is $153.92 and $SKHYB remains below the averages that capped it earlier. $143.28 on the low side and $166.26 on the high side have contained the last three days. Price is roughly mid range here. Resistance sits 8.0% above and support 6.9% below. Averages have been ordered the same way for a long stretch now, with the 20 above the 50. Momentum is mid range with RSI at 35. The 24 hour range runs $153.68 to $166.26, and price is near the bottom of it. Volume over the past day is running about 1.9x the recent average, so there is real participation behind this. Down 4.1% over 24 hours.
DYOR
$SKHYB #Crypto
8
📉 $HBAR · 1D
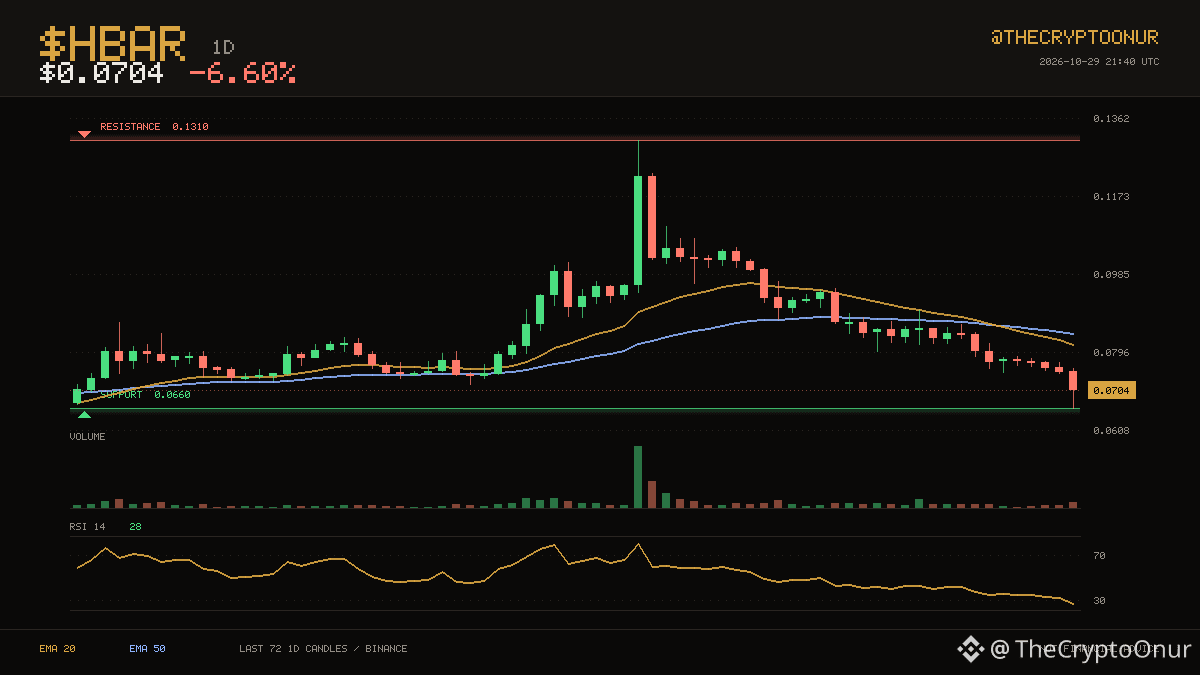
Buyers have been showing up around $0.0660, which is where price is sitting now. $HBAR is at $0.0704, under both its 20 and 50 daily averages. It is sitting in the bottom third of the range. Support is the near one at 6.3% below; the range high is far above. This shift is fresh: the 20 has been below the 50 for only 6 candles. RSI has dropped to 28, the kind of reading that usually comes with a bounce attempt. The 24 hour range runs $0.0660 to $0.0760, and price is around the middle of it. Volume is close to normal at 1.2x the recent average. Down 6.6% over 24 hours.
Binance spot data. ⚠️ DYOR
$HBAR #Binance
17
🔴 $HBAR · 1D
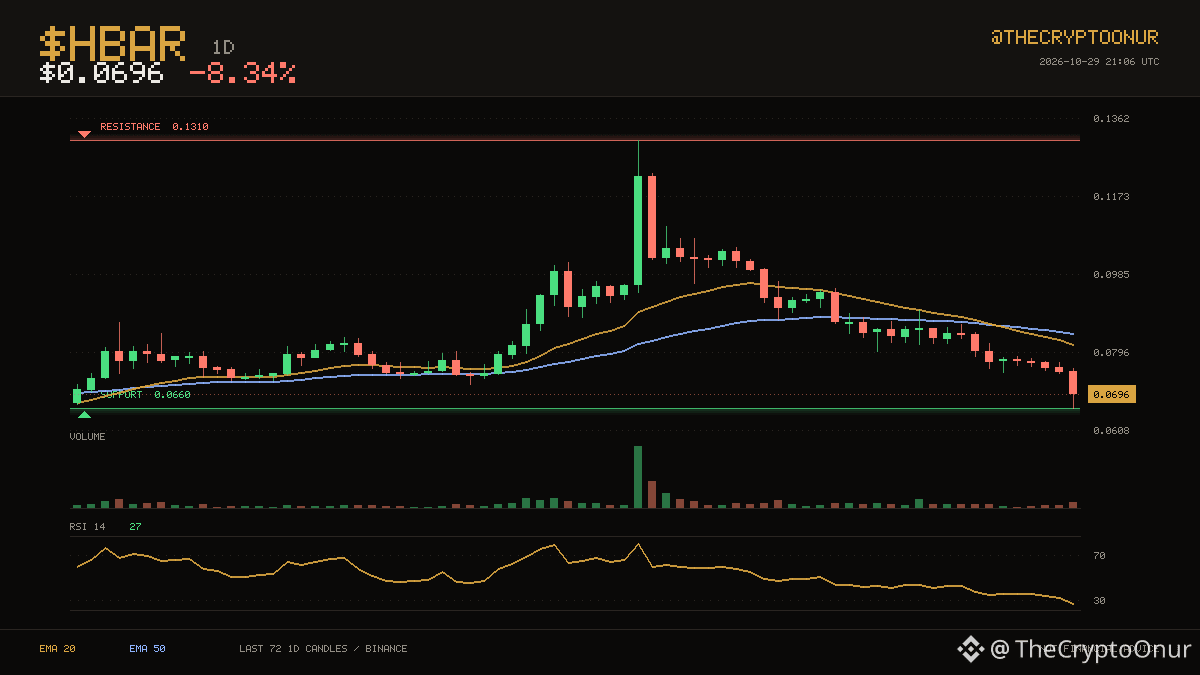
$HBAR is at $0.0696, under both its 20 and 50 daily averages. Buyers have been showing up around $0.0660, which is where price is sitting now. RSI has dropped to 27, the kind of reading that usually comes with a bounce attempt. Support is the near one at 5.1% below; the range high is far above. Down 8.3% over 24 hours.
📈 $INIT · 1D
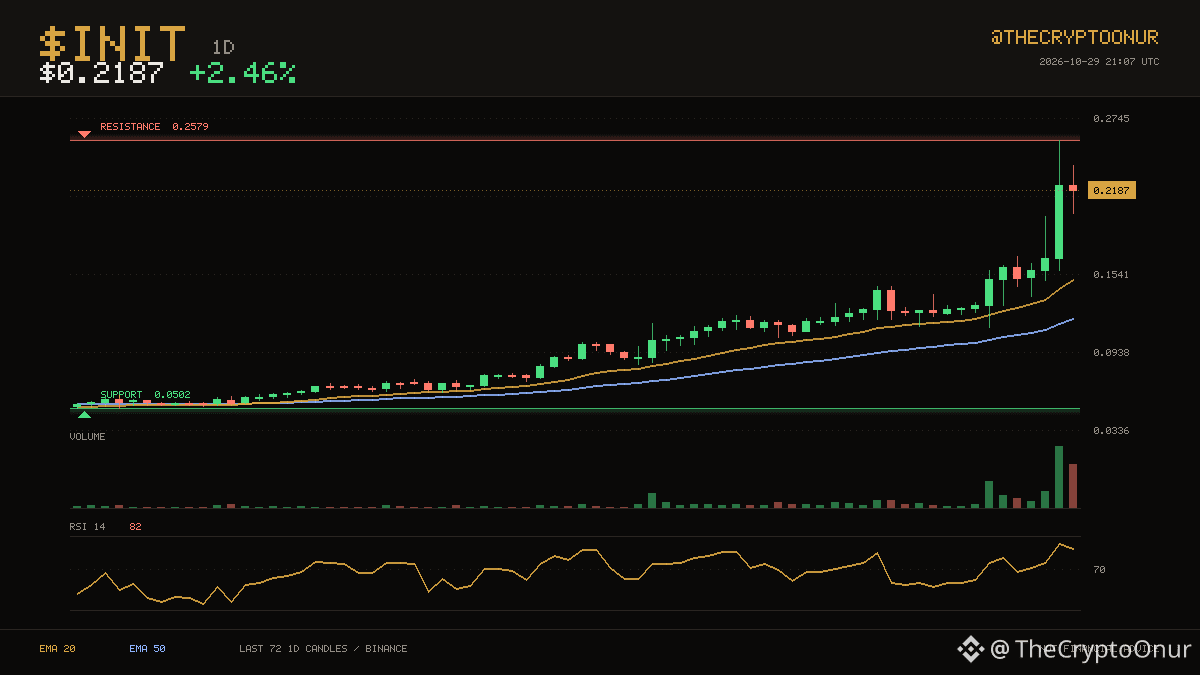
$0.2187 keeps $INIT on the stronger side of its daily averages. $0.2579 has been the ceiling over the last two months and $INIT is back at it. RSI is up at 82, which is stretched enough that pullbacks would not be a surprise. Price is a long way from both ends of this range. Up 2.5% over 24 hours.
Binance spot data. ⚠️ DYOR
$HBAR $INIT #Binance
9
🚨🚨 DELISTING
Binance Will Delist EPIC, QUICK on 2026-10-28
#Binance
🚨🚨 DELISTING
Binance Will Delist EPIC, QUICK on 2026-10-28
#Binance
Binance Will Delist EPIC, QUICK on 2026-10-28
#Binance
9
🔴 $WLD · 4H
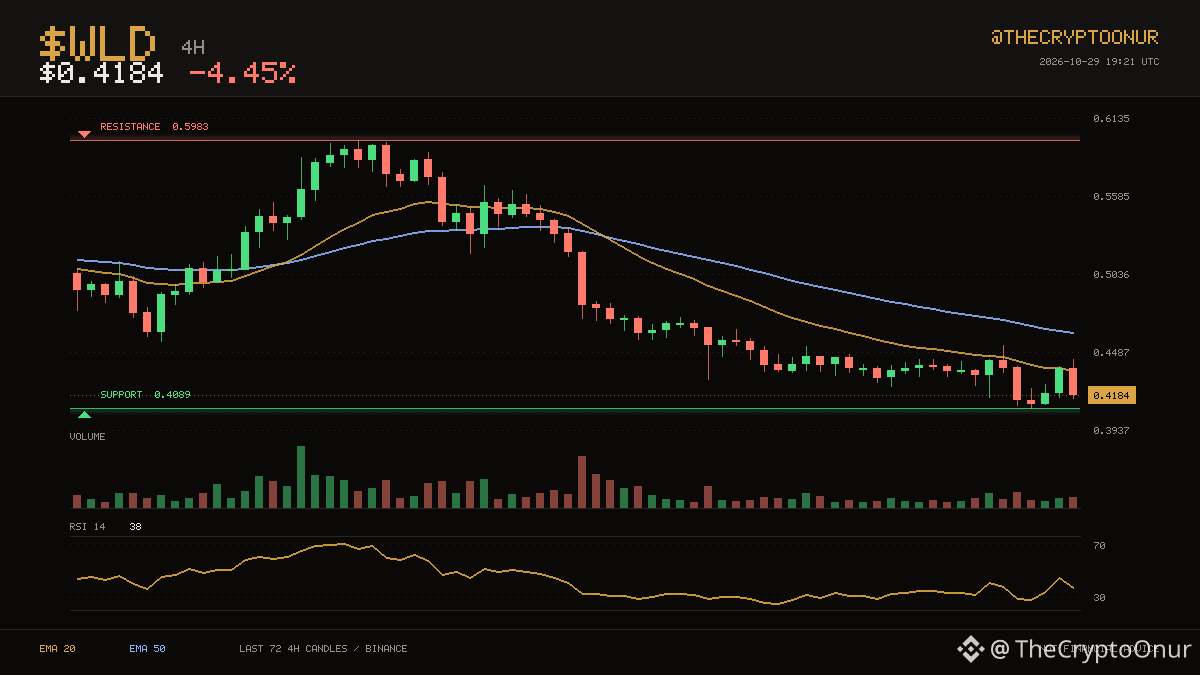
Price is $0.4184 and $WLD remains below the averages that capped it earlier. The $0.4089 area held twice over the last two weeks and is being tested again. Price is down in the lower third of that range. The floor is 2.3% away and the ceiling is nowhere close. The 20 has stayed below the 50 for 34 candles. RSI at 38 is neutral, so momentum is not blocking a move either way. Over the past day it has traded between $0.4089 and $0.4538, sitting near the bottom of it now. Participation is light at about 0.6x average volume. Down 4.5% over 24 hours.
DYOR
$WLD #TechnicalAnalysis
14
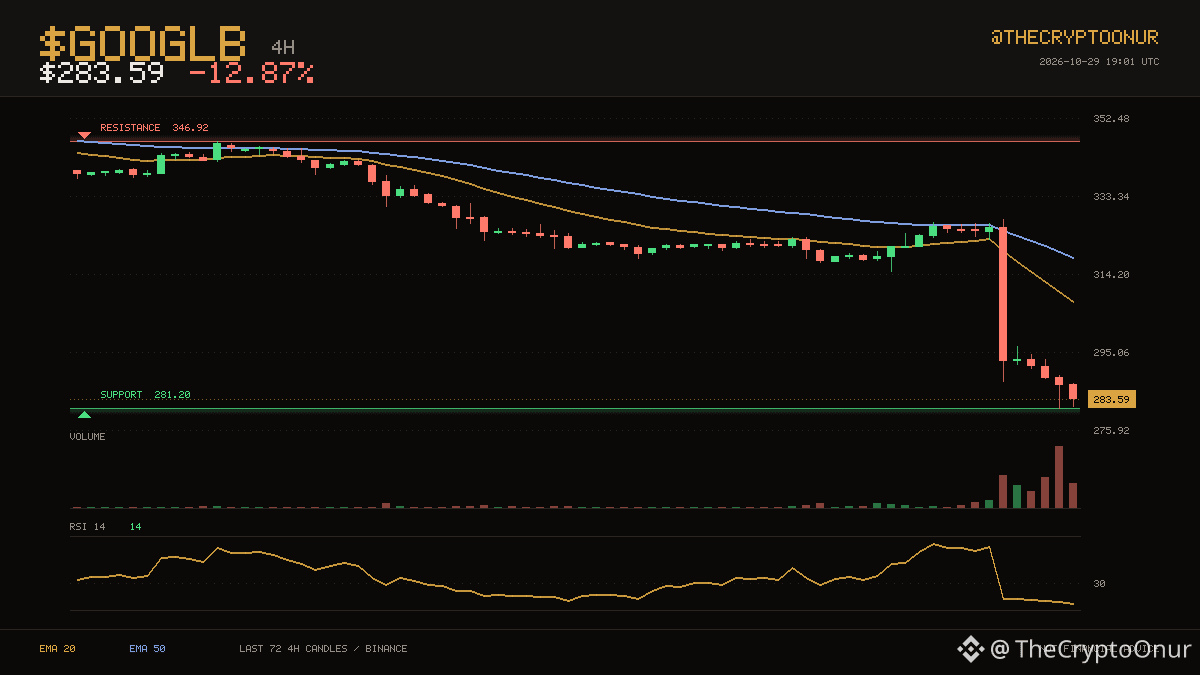
📉 $GOOGLB · 4H
$GOOGLB trades at $283.59, still on the weak side of its 4-hour averages. The $281.20 area held twice over the last two weeks and is being tested again. Price is down in the lower third of that range. The floor is 0.8% away and the ceiling is nowhere close. The 20 has stayed below the 50 for a long stretch now. RSI at 14 is deep in oversold territory. Over the past day it has traded between $281.20 and $327.65, sitting near the bottom of it now. The last 24 hours carried roughly 13.0x normal volume. Down 12.9% over 24 hours.
⚠️ DYOR
$GOOGLB #Trading
4
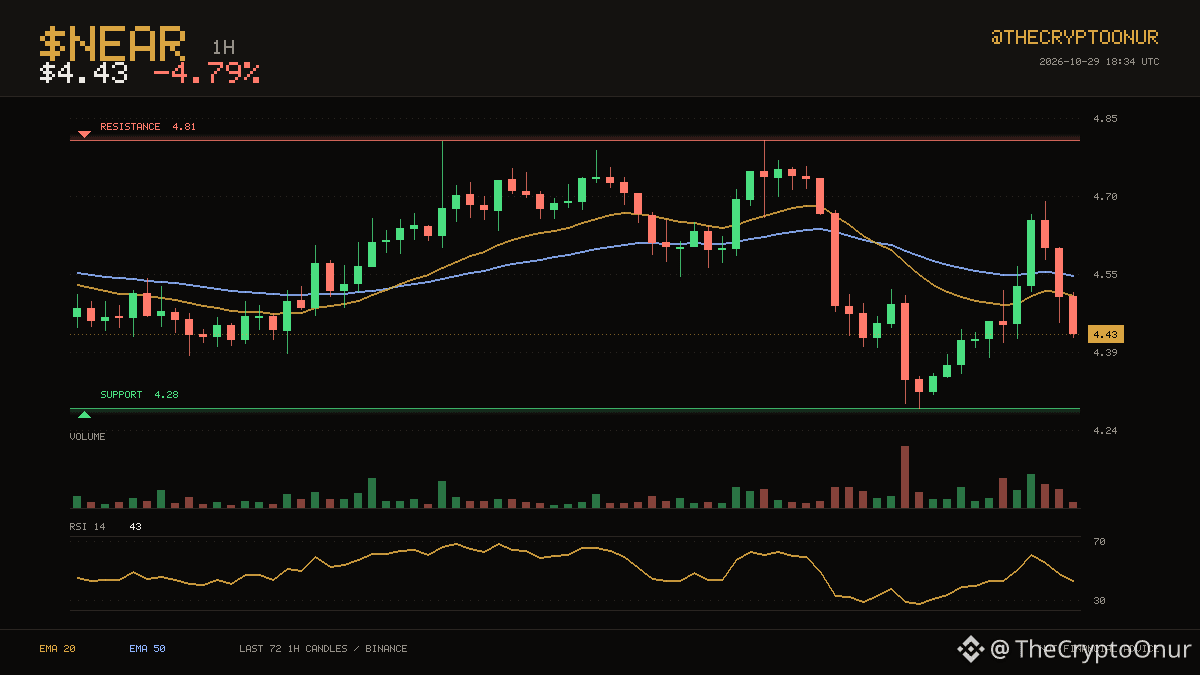
🔴 $NEAR · 1H
Price is $4.43 and $NEAR remains below the averages that capped it earlier. $4.28 on the low side and $4.81 on the high side have contained the last three days. Price is down in the lower third of that range. That is 8.6% to the ceiling and 3.3% to the floor. The 20 has stayed below the 50 for only 15 candles. RSI at 43 is neutral, so momentum is not blocking a move either way. Over the past day it has traded between $4.28 and $4.81, sitting near the bottom of it now. The last 24 hours carried roughly 1.7x normal volume. Down 4.8% over 24 hours.
DYOR
$NEAR #TechnicalAnalysis
11
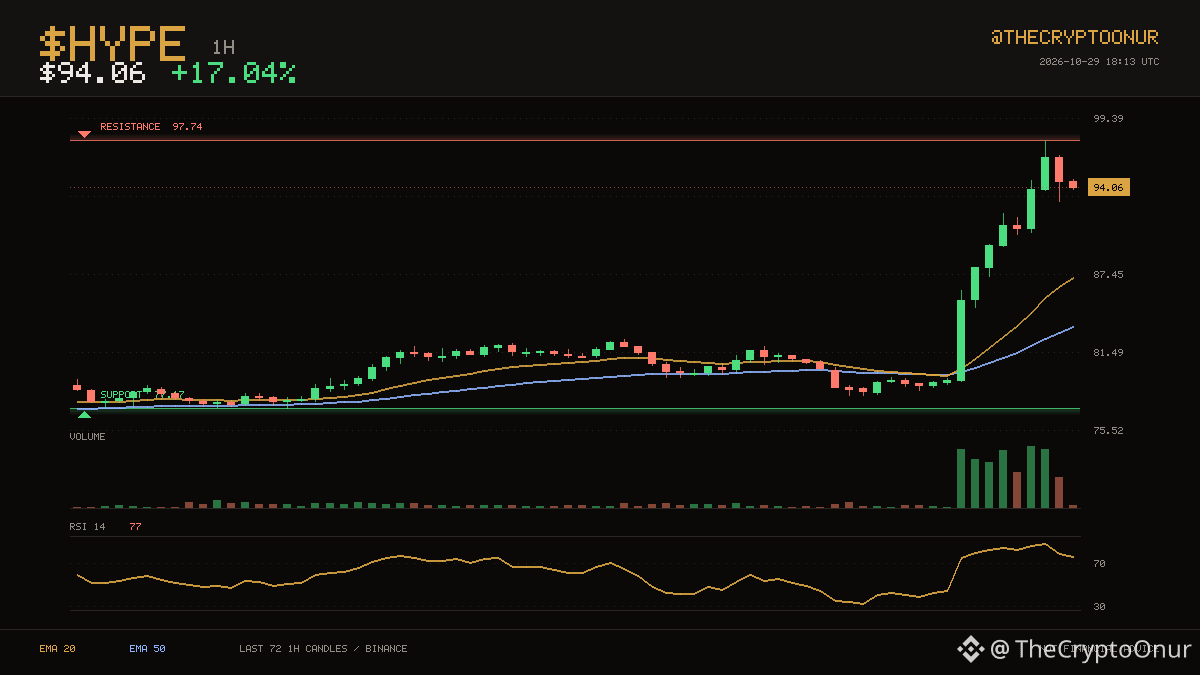
🟢 $HYPE · 1H
$94.06 keeps $HYPE on the stronger side of its hourly averages. $97.74 has been the ceiling over the last three days and $HYPE is back at it. Price is holding in the upper third of that range. The ceiling is 3.9% away while the floor sits well below current levels. The 20 crossed above the 50 recently, for only 9 candles, so this leg is still young. RSI is up at 77, which is stretched enough that pullbacks would not be a surprise. Over the past day it has traded between $78.19 and $97.74, sitting near the top of it now. The last 24 hours carried roughly 6.1x normal volume. Up 17.0% over 24 hours.
⚠️ DYOR
$HYPE #TechnicalAnalysis
15
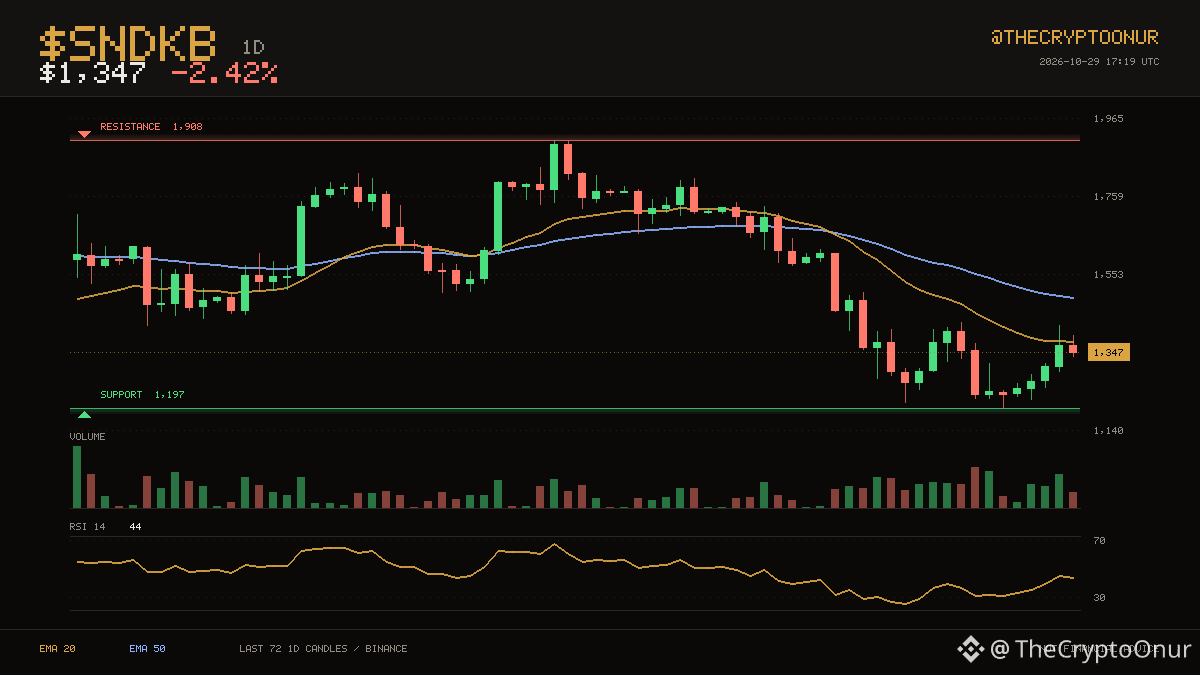
🔴 $SNDKB · 1D
Price is $1,347 and $SNDKB remains below the averages that capped it earlier. $1,197 on the low side and $1,908 on the high side have contained the last two months. It is sitting in the bottom third of the range. Support is the near one at 11.1% below; the range high is far above. Averages have been ordered the same way for only 18 candles, with the 20 below the 50. Momentum is mid range with RSI at 44. The 24 hour range runs $1,337 to $1,419, and price is near the bottom of it. Volume is close to normal at 1.3x the recent average. Down 2.4% over 24 hours.
DYOR
$SNDKB #Crypto
8
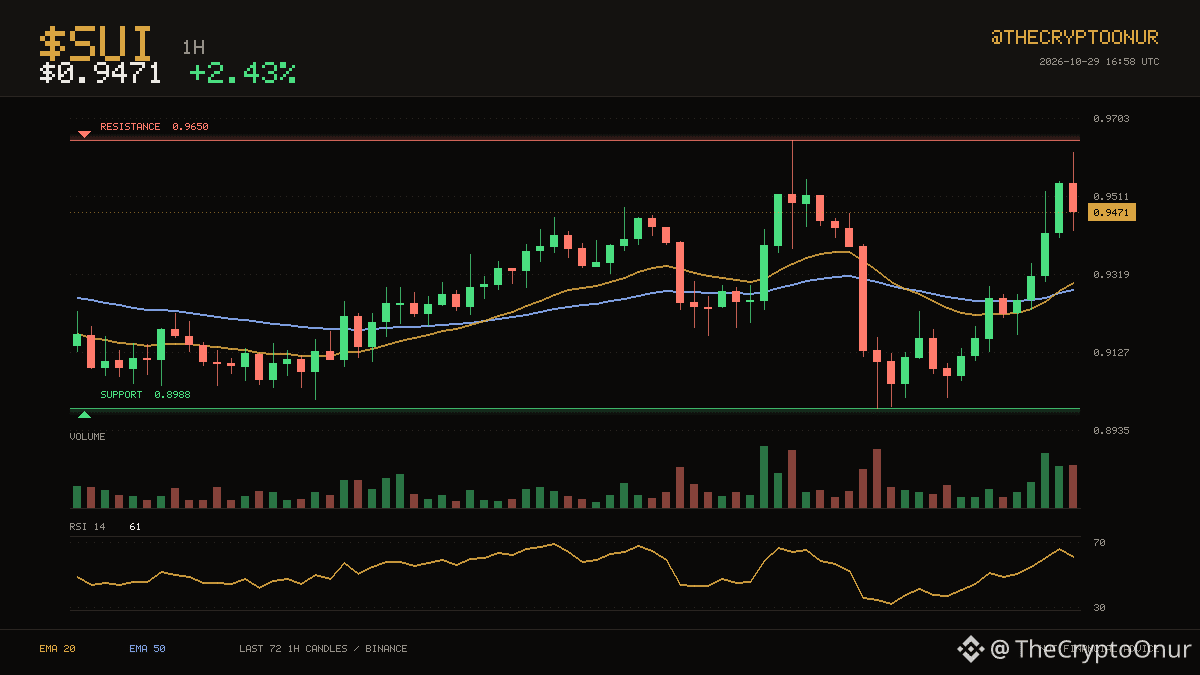
🟢 $SUI · 1H
$0.9471 keeps $SUI on the stronger side of its hourly averages. $0.8988 on the low side and $0.9650 on the high side have contained the last three days. Price is holding in the upper third of that range. That is 1.9% to the ceiling and 5.1% to the floor. The 20 crossed above the 50 recently, for only 2 candles, so this leg is still young. RSI at 61 is neutral, so momentum is not blocking a move either way. Over the past day it has traded between $0.8988 and $0.9650, sitting near the top of it now. Turnover is unremarkable, running 1.5x the recent average. Up 2.4% over 24 hours.
DYOR
$SUI #TechnicalAnalysis
24
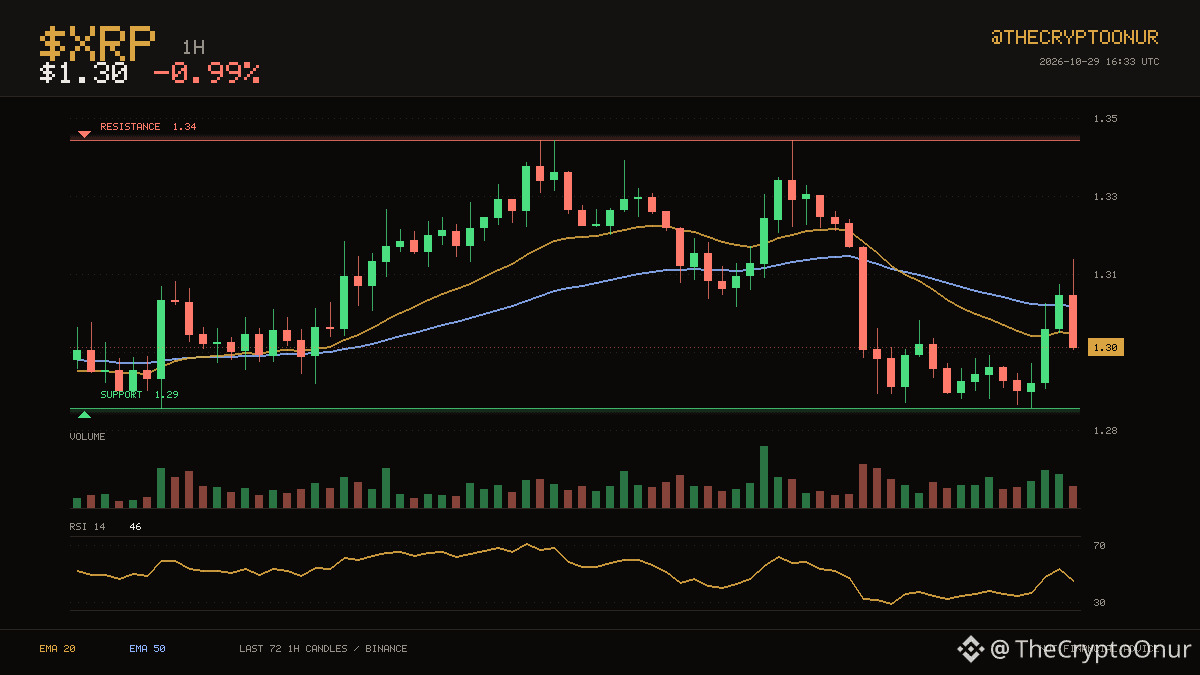
📉 $XRP · 1H
The action has stayed between $1.29 and $1.34 over the last three days. $XRP is at $1.30, under both its 20 and 50 hourly averages. It is sitting in the bottom third of the range. Support is 1.0% below, which is close enough to be tested quickly. Averages have been ordered the same way for only 13 candles, with the 20 below the 50. Momentum is mid range with RSI at 46. The 24 hour range runs $1.29 to $1.34, and price is near the bottom of it. Volume is close to normal at 1.3x the recent average. Down 1.0% over 24 hours.
Binance spot data. DYOR
$XRP #Binance
6
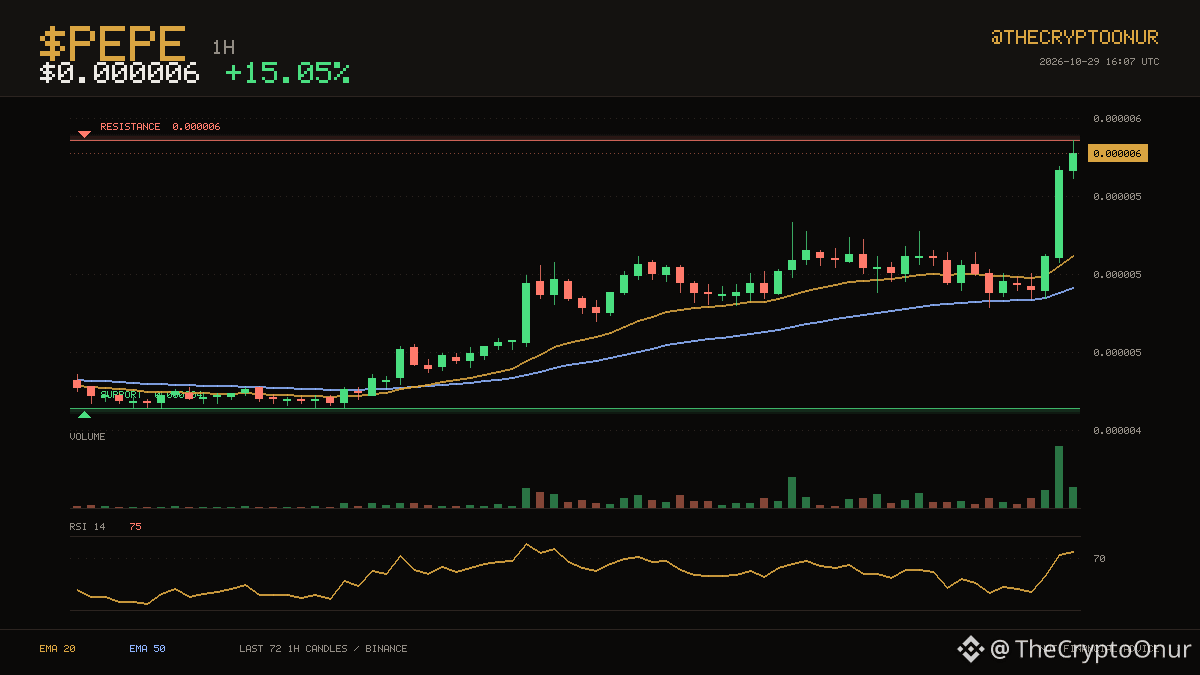
📈 $PEPE · 1H
$0.000006 has been the ceiling over the last three days and $PEPE is back at it. $PEPE is trading at $0.000006, above both its 20 and 50 hourly averages. Price is holding in the upper third of that range. The ceiling is 1.4% away while the floor sits well below current levels. The 20 has stayed above the 50 for 47 candles. RSI is up at 75, which is stretched enough that pullbacks would not be a surprise. Over the past day it has traded between $0.000005 and $0.000006, sitting near the top of it now. The last 24 hours carried roughly 3.3x normal volume. Up 15.1% over 24 hours.
⚠️ DYOR
$PEPE #Binance
15
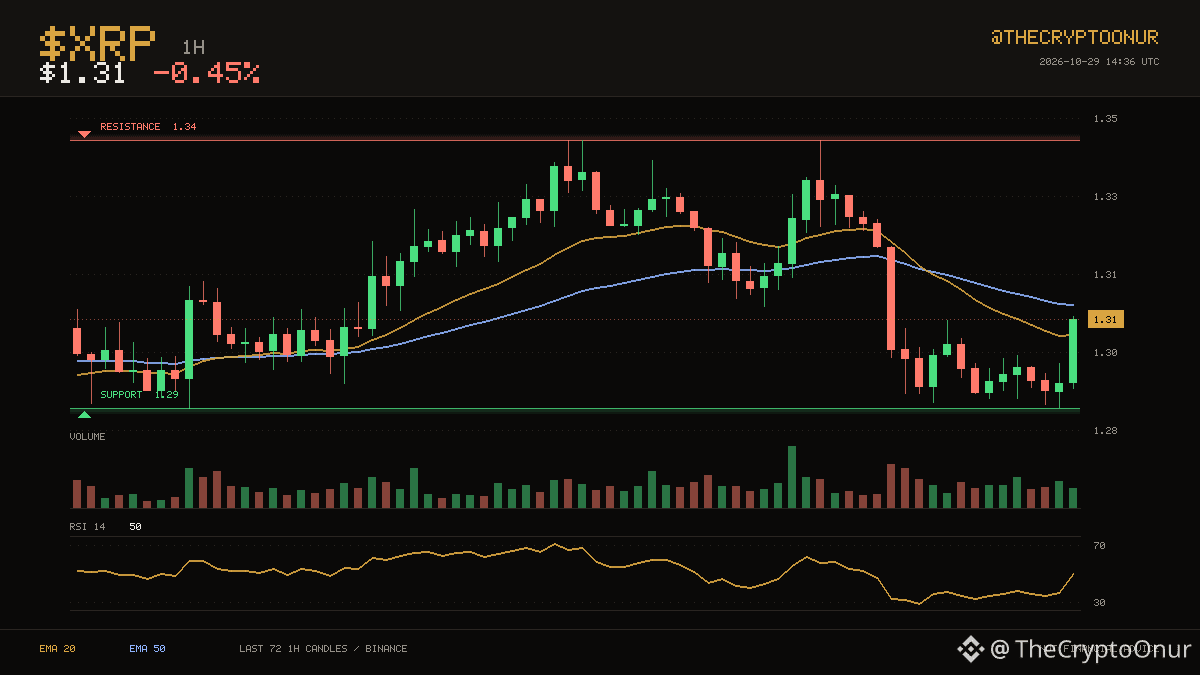
📉 $XRP · 1H
At $1.31, $XRP is sitting right in the middle of its hourly averages. $1.29 on the low side and $1.34 on the high side have contained the last three days. RSI at 50 is neutral, so momentum is not blocking a move either way. That is 3.0% to the ceiling and 1.5% to the floor. Down 0.5% over 24 hours.
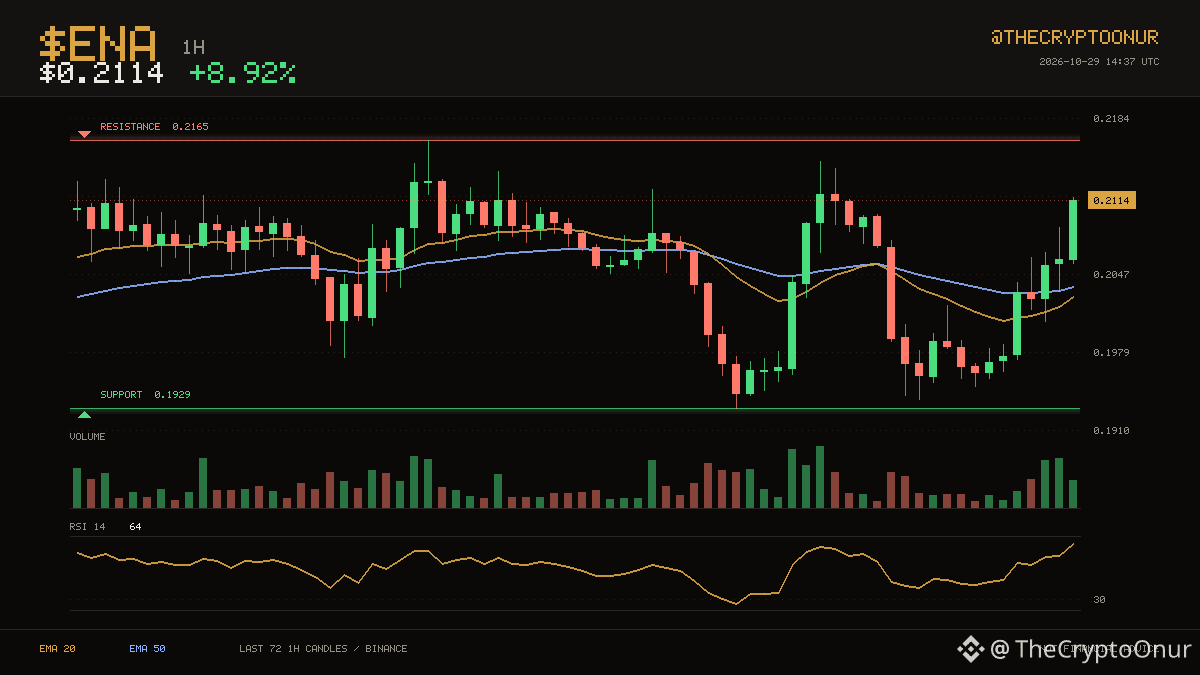
🟢 $ENA · 1H
$ENA sits at $0.2114, with the 20 and 50 hourly averages both below price. The three day range runs from $0.1929 up to $0.2165. Momentum is mid range with RSI at 64. Resistance sits 2.4% above and support 8.8% below. Up 8.9% over 24 hours.
DYOR
$XRP $ENA #Crypto
14
Войдите, чтобы посмотреть больше материала
Присоединяйтесь к пользователям криптовалют по всему миру на Binance Square
⚡️ Получайте новейшую и полезную информацию о криптоактивах.
💬 Нам доверяет крупнейшая в мире криптобиржа.
👍 Получите достоверные аналитические данные от верифицированных создателей контента.
Эл. почта/номер телефона
В тренде
FedWatch
Просмотров: 16.3M
39,524 обсуждают
🚨 🇺🇸 PETER SCHIFF JUST THREW A BIG WARNING AT THE FED!
Peter Schiff is calling Kevin Warsh’s tough talk on inflation a “bluff,” and his prediction could have major implications for the markets.
Schiff believes the Fed could eventually return to money printing through quantitative easing (QE) and even cut interest rates next year, despite inflation continuing to rise.
Think about that for a moment.
🔥 Inflation could remain a problem. 🔥 The Fed could still move toward easier monetary policy. 🔥 More liquidity could flow into financial markets.
If this scenario plays out, it could create a very different market environment for stocks, gold, Bitcoin, and the wider crypto market.
But there’s a catch: if inflation stays high, the Fed could face a difficult choice between fighting rising prices and supporting the economy.
Will Warsh stick to a tough inflation policy, or will the Fed eventually change direction?
The next move could matter a lot for investors.
#FedWatch #EarningsSeason #USMidtermElections #BrazilCryptoExchangesMustApplyForLicensesByFriday #StanDruckenmillerBecomesInvestorInTradeXYZ
Jackson Liam
·Лайков: 4
·Просмотров: 8.7k
EarningsSeason
Просмотров: 6.5M
32,244 обсуждают
USMidtermElections
Просмотров: 52,903
677 обсуждают