

MiFx Trader
1.1k Публикации

MiFx Trader
Отправить жалобу
Заблокировать пользователя
I'm Expert technical analyst delivering timely crypto insights for informed trading decisions. Stay ahead of the curve with my market analysis.
Трейдер с частыми сделками
4.9 г
1 подписок(и/а)
16.2K+ подписчиков(а)
7.8K+ понравилось
Посты
Все
Цитирования
Активно
·
--
Рост
MiFx Trader
·
--
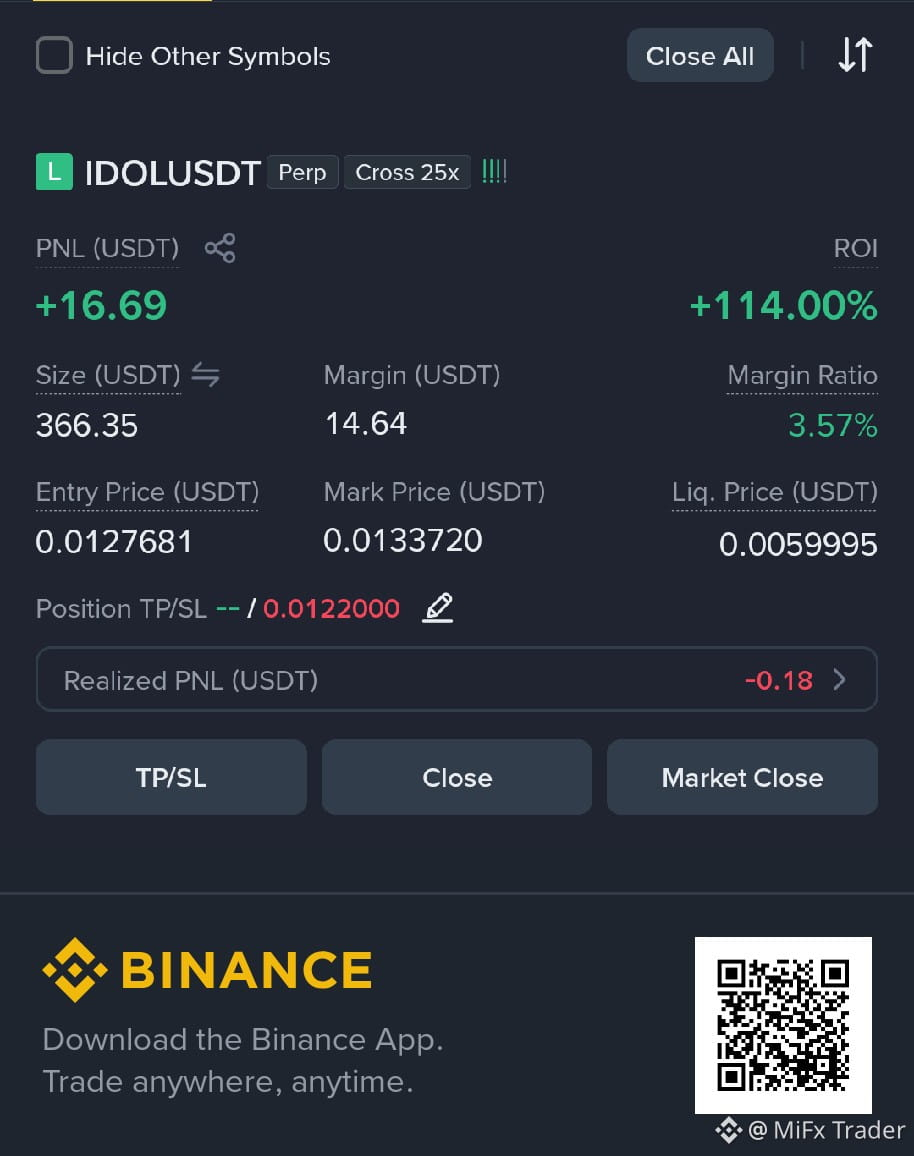
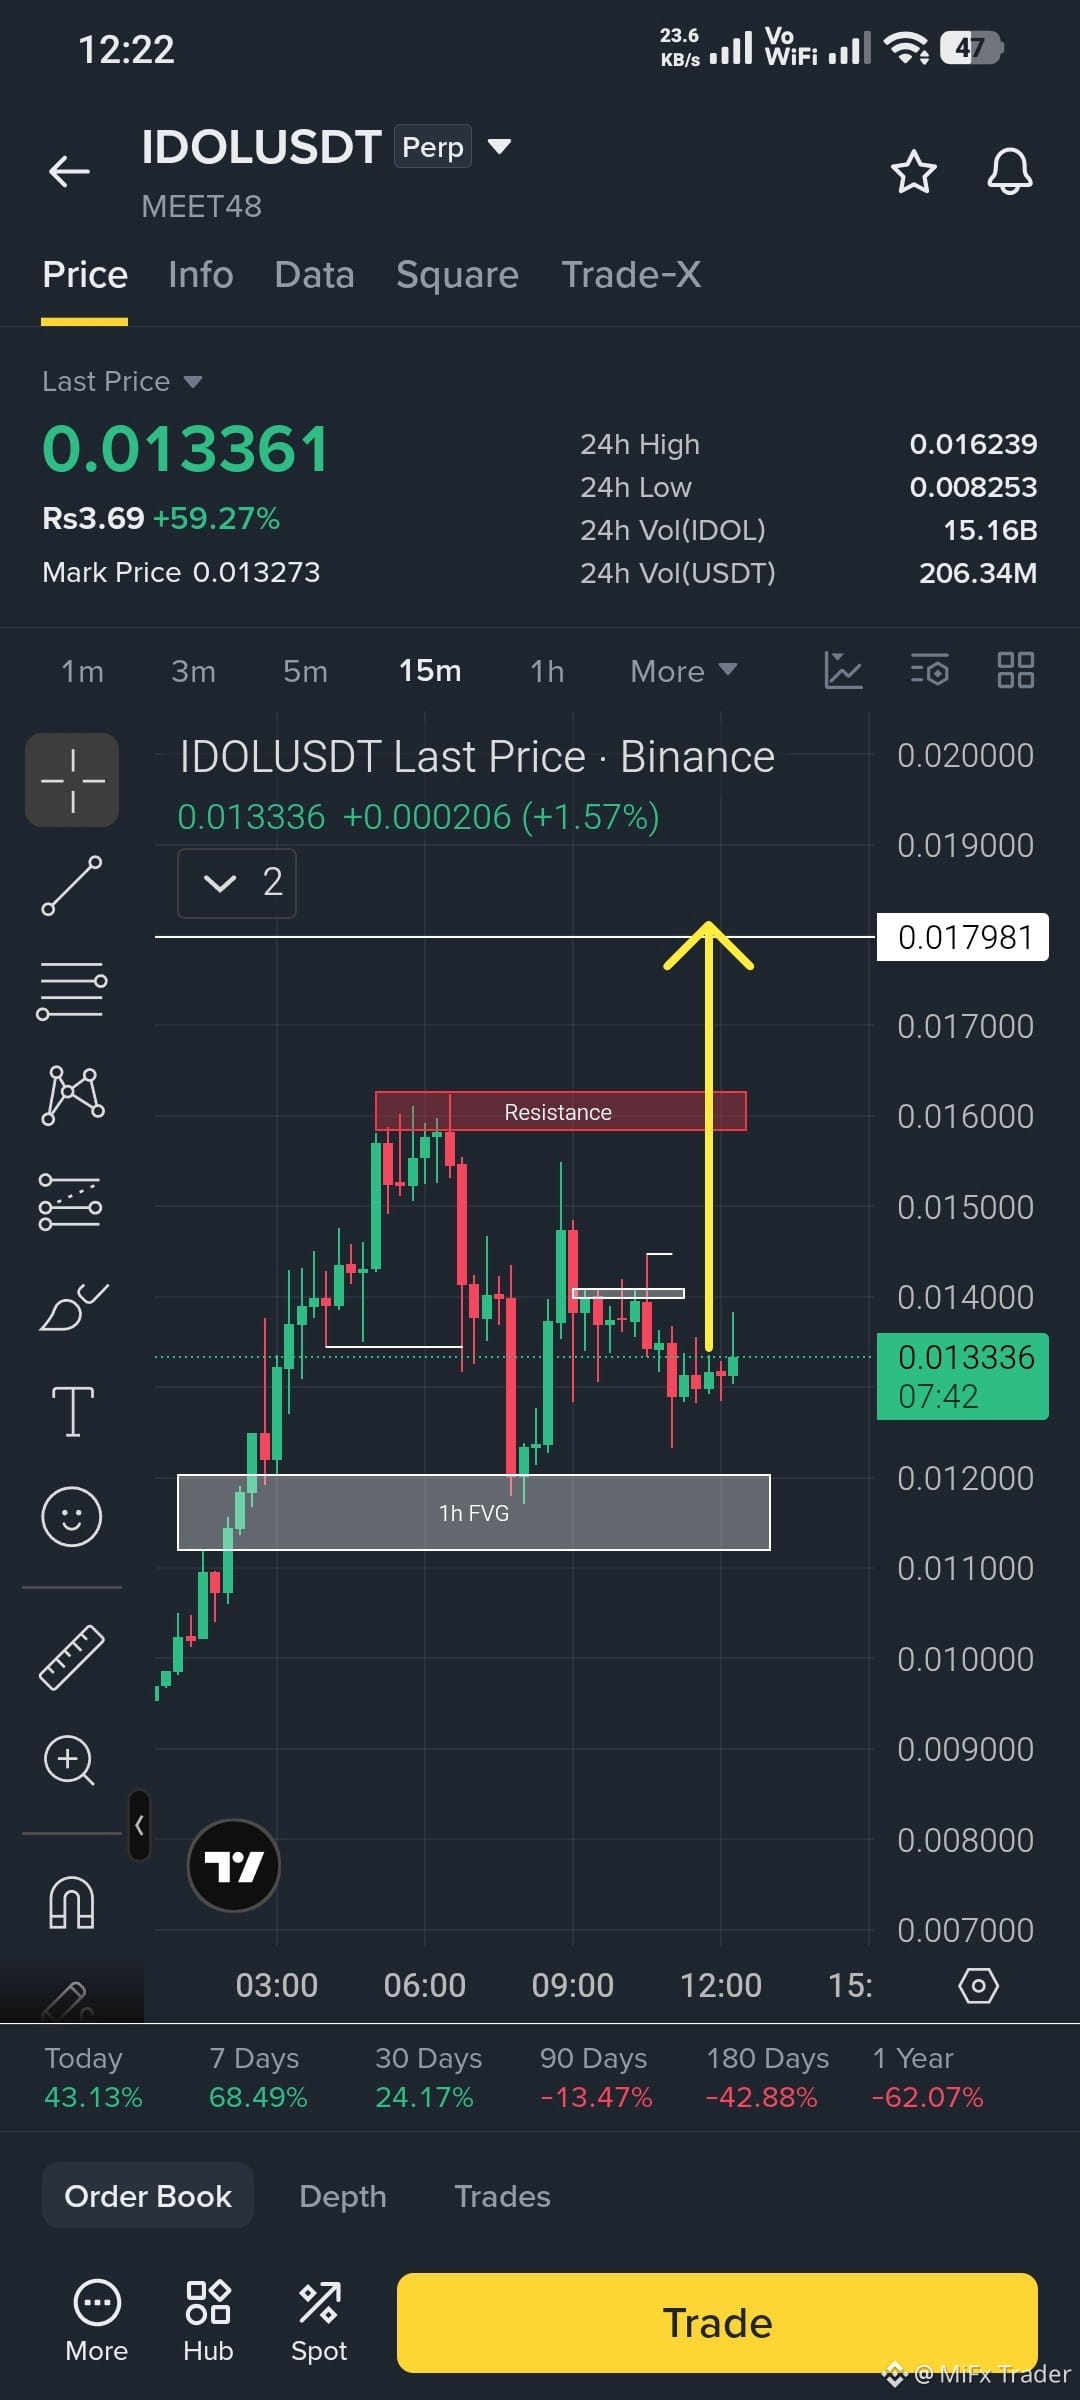
Рост$IDOL Best time to open long here in this, as it's already in bullish trend and bouncing from the 1h FVG also now reacting to a 15m FVG , and looking at 1D time frame I have marked a liquidity level with a while line...
there's three valid reasons to open long in $IDOL
NOTE: Use small margin because coin is too volatile and heavy...
#MiFxTrader
there's three valid reasons to open long in $IDOL
NOTE: Use small margin because coin is too volatile and heavy...
#MiFxTrader
296
·
--
Рост
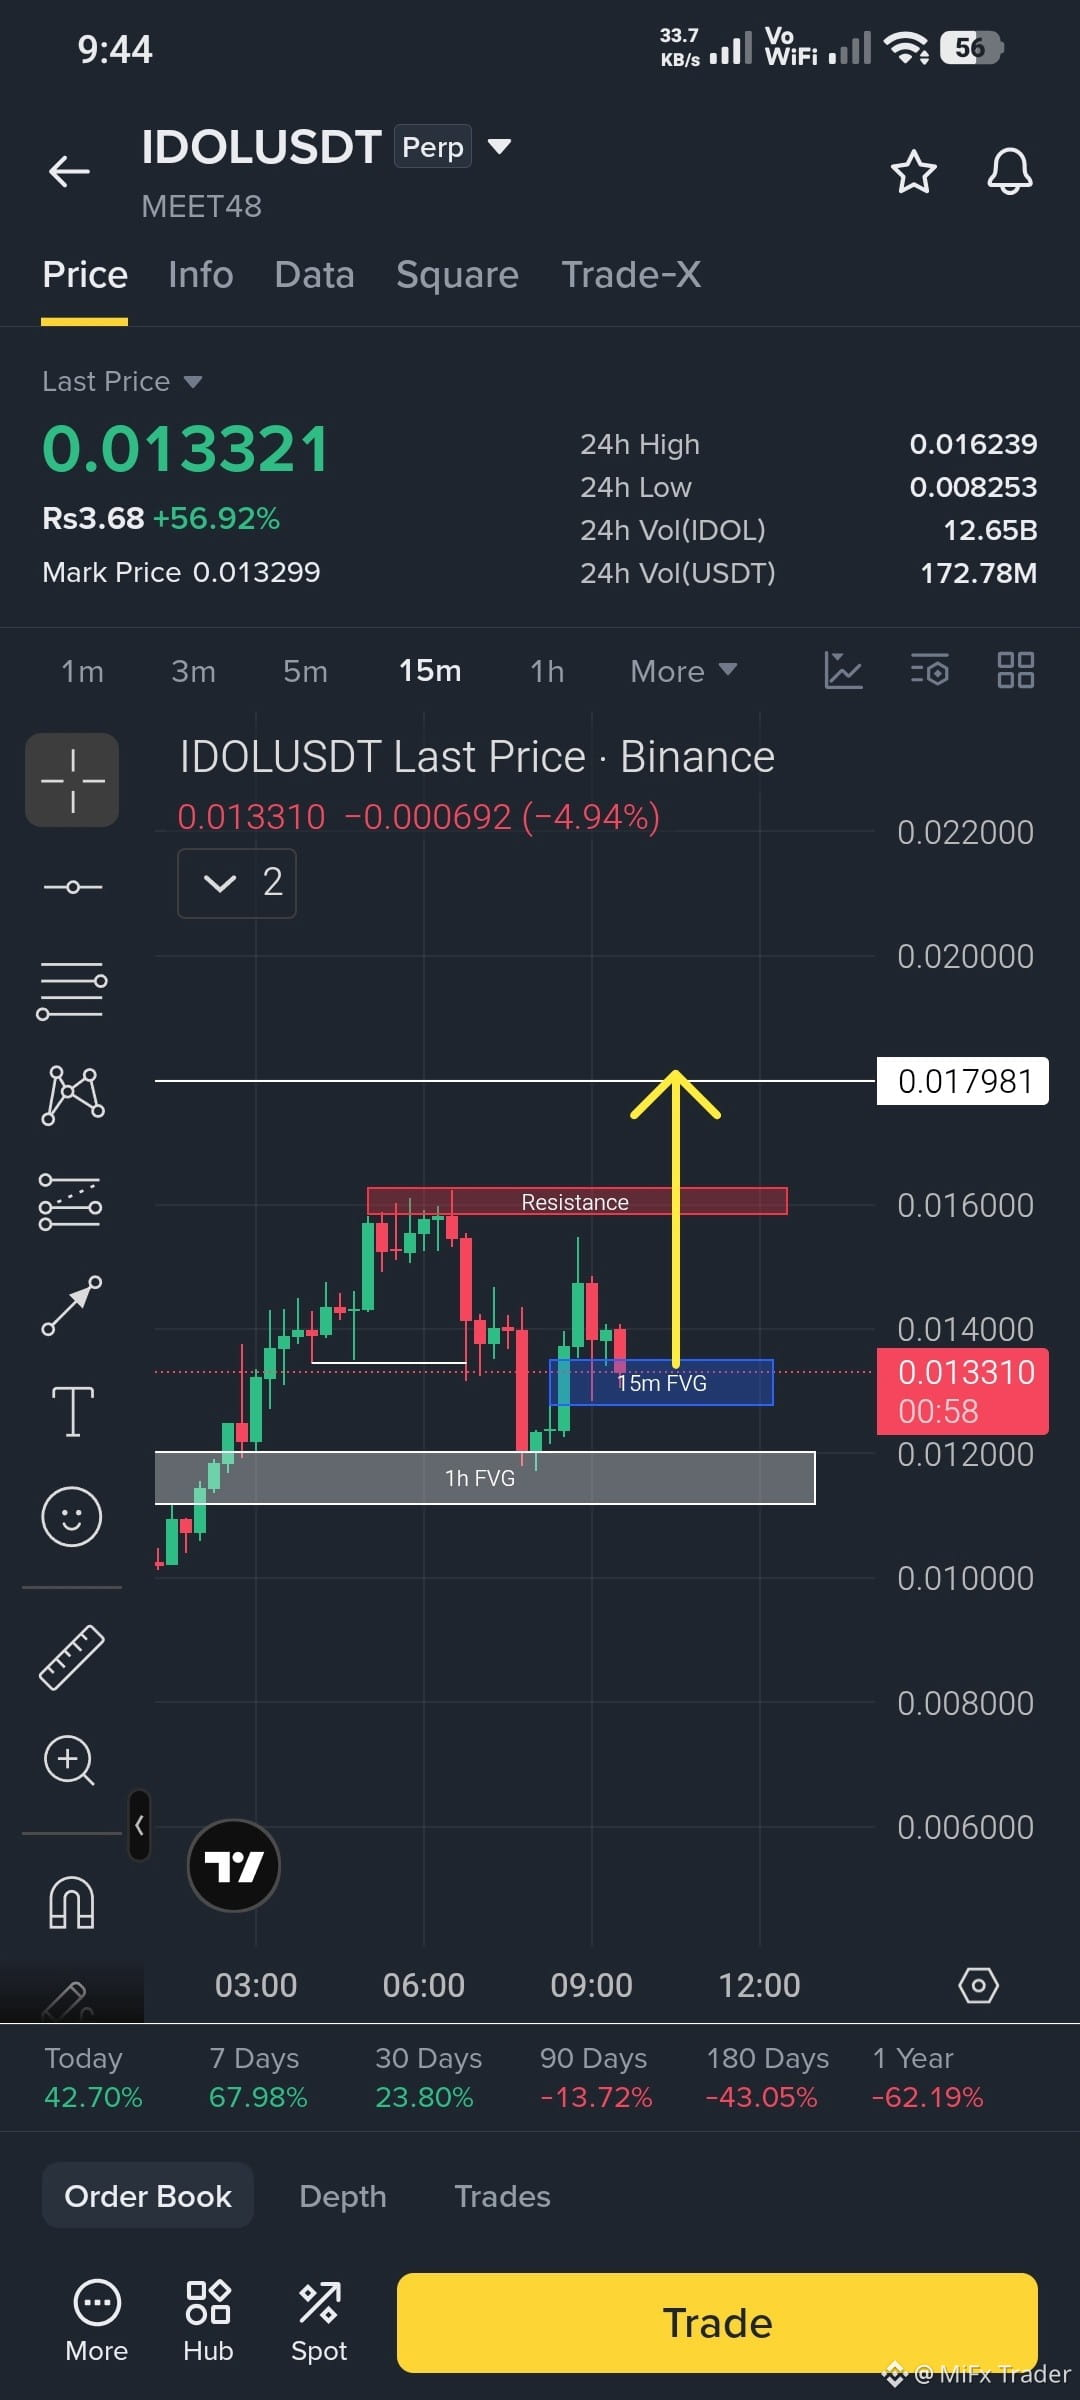
$IDOL Best time to open long here in this, as it's already in bullish trend and bouncing from the 1h FVG also now reacting to a 15m FVG , and looking at 1D time frame I have marked a liquidity level with a while line...
there's three valid reasons to open long in $IDOL
NOTE: Use small margin because coin is too volatile and heavy...
#MiFxTrader
there's three valid reasons to open long in $IDOL
NOTE: Use small margin because coin is too volatile and heavy...
#MiFxTrader
1
424
·
--
Падение
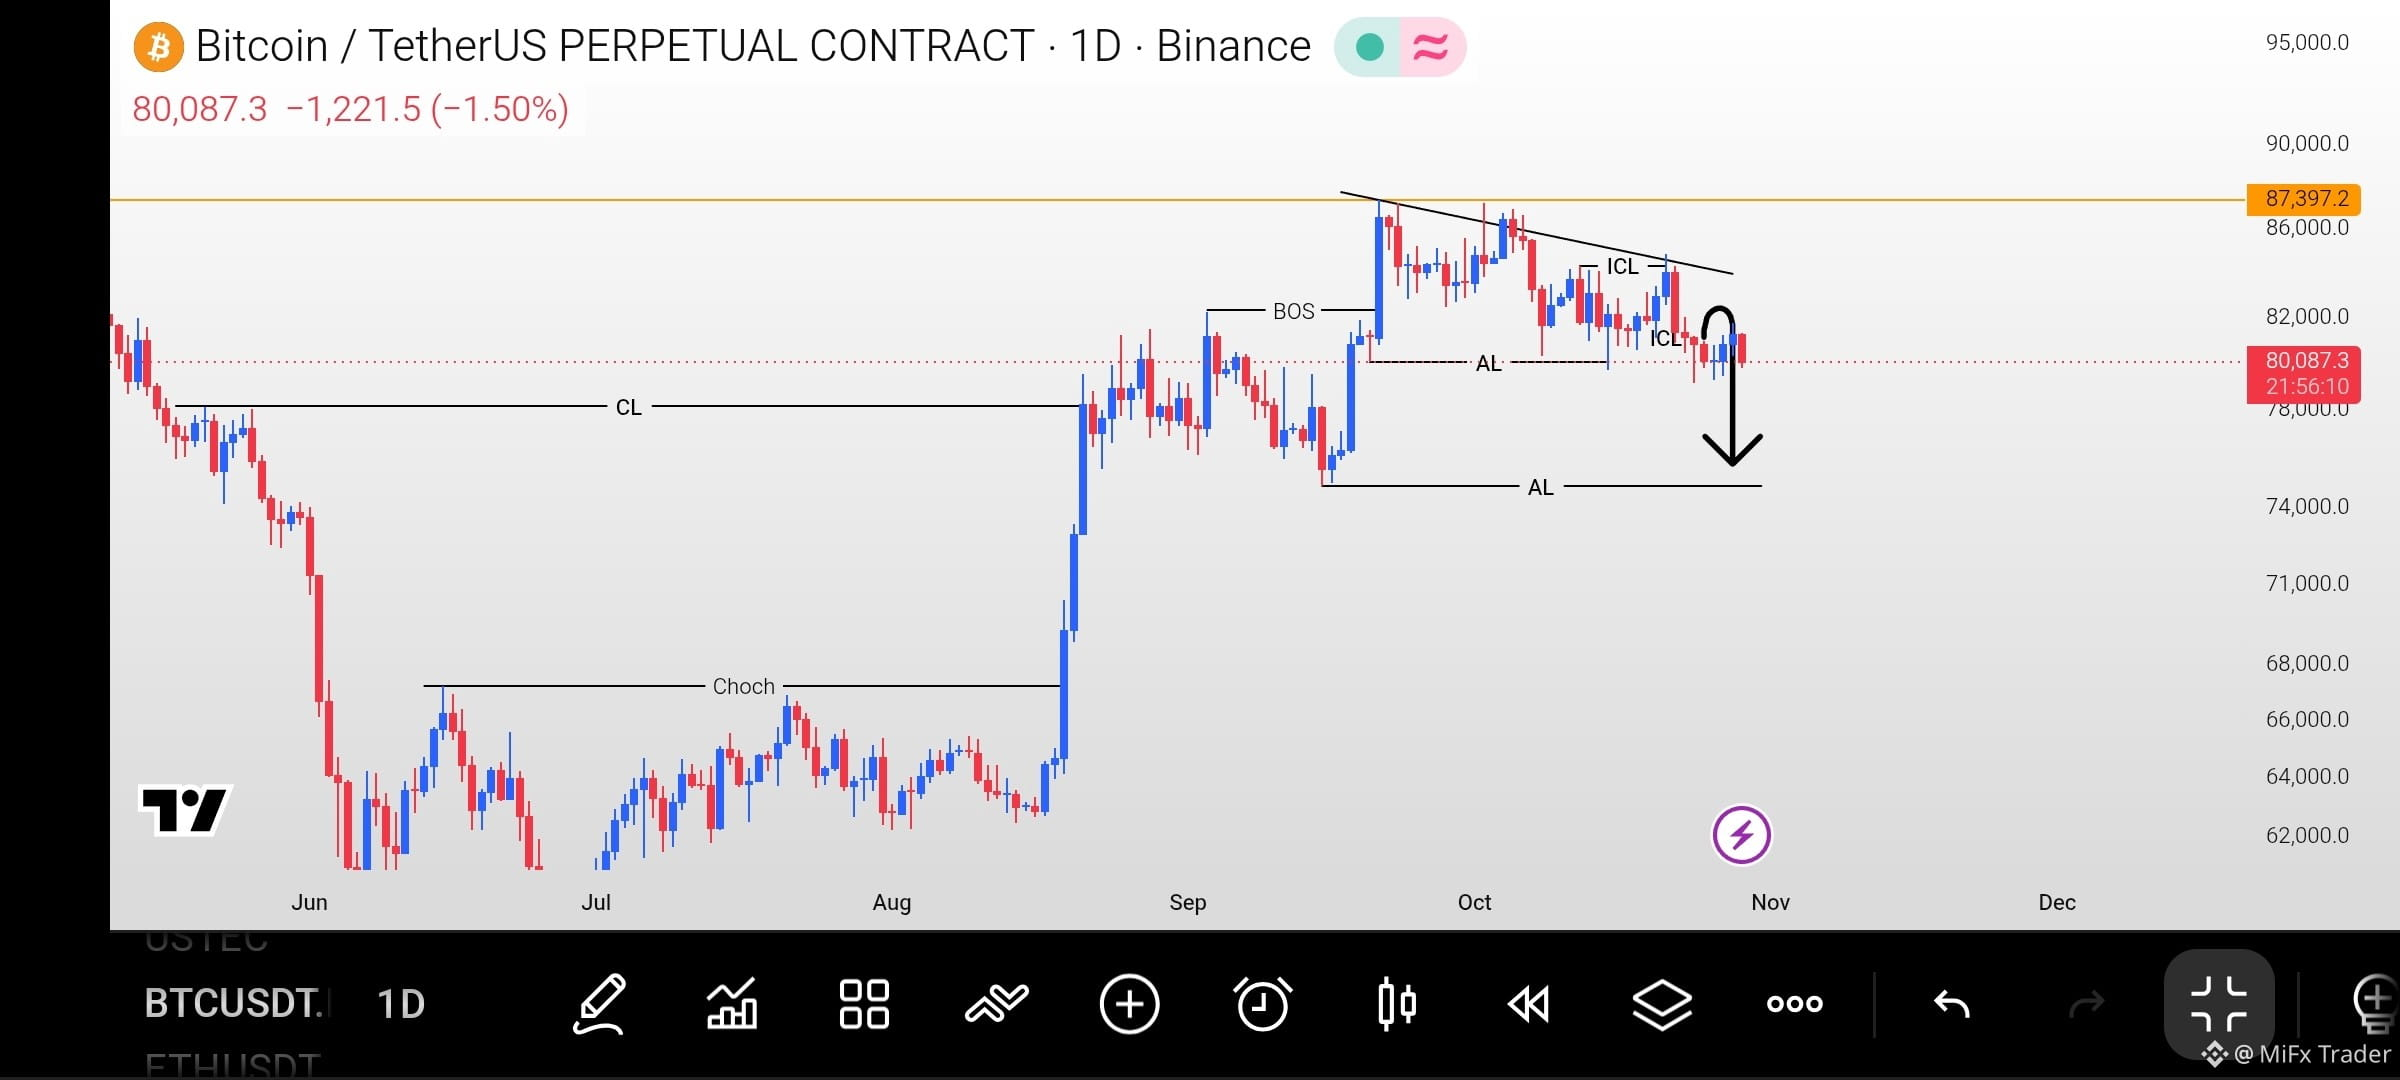
$BTC This BTC UPDATE IS STILL VALID ✅
As it was mentioned that BTC may recover to towards 82.6k level which will be opportunity to open short and exactly happened this...
If you made your short positions , just hold on 75k - 76k is coming soon...
#MiFxTrader
{future}(BTCUSDT)
$BTC This BTC UPDATE IS STILL VALID ✅
As it was mentioned that BTC may recover to towards 82.6k level which will be opportunity to open short and exactly happened this...
If you made your short positions , just hold on 75k - 76k is coming soon...
#MiFxTrader
As it was mentioned that BTC may recover to towards 82.6k level which will be opportunity to open short and exactly happened this...
If you made your short positions , just hold on 75k - 76k is coming soon...
#MiFxTrader
MiFx Trader
·
--
Падение$BTC
BTC DETAILED UPDATE
On the 1D chart, BTC had been consistently bullish and had not broken any major low to confirm a structural shift. However, last week, it wicked below a major low, potentially signaling a reversal, and then broke a recent internal high.
This suggested that BTC might continue its bullish momentum. However, BTC swept that same internal high and then moved back down, wicking below two strong 1D engulfing candles. This is a potential sign of a market structure shift (MSS).
Currently, BTC is moving to the downside in a bearish pattern. A confirmed downside breakout could potentially push BTC toward the $75K–$76K zone.
Before that, a normal recovery toward $82.6K is possible. However, BTC must remain below $84.4K for the bearish outlook to remain valid.
AS PER MY ANALYSIS: Avoid building long positions on BTC for now and look for potential short opportunities.
$BTC
#MiFxTrader
2
355
·
--
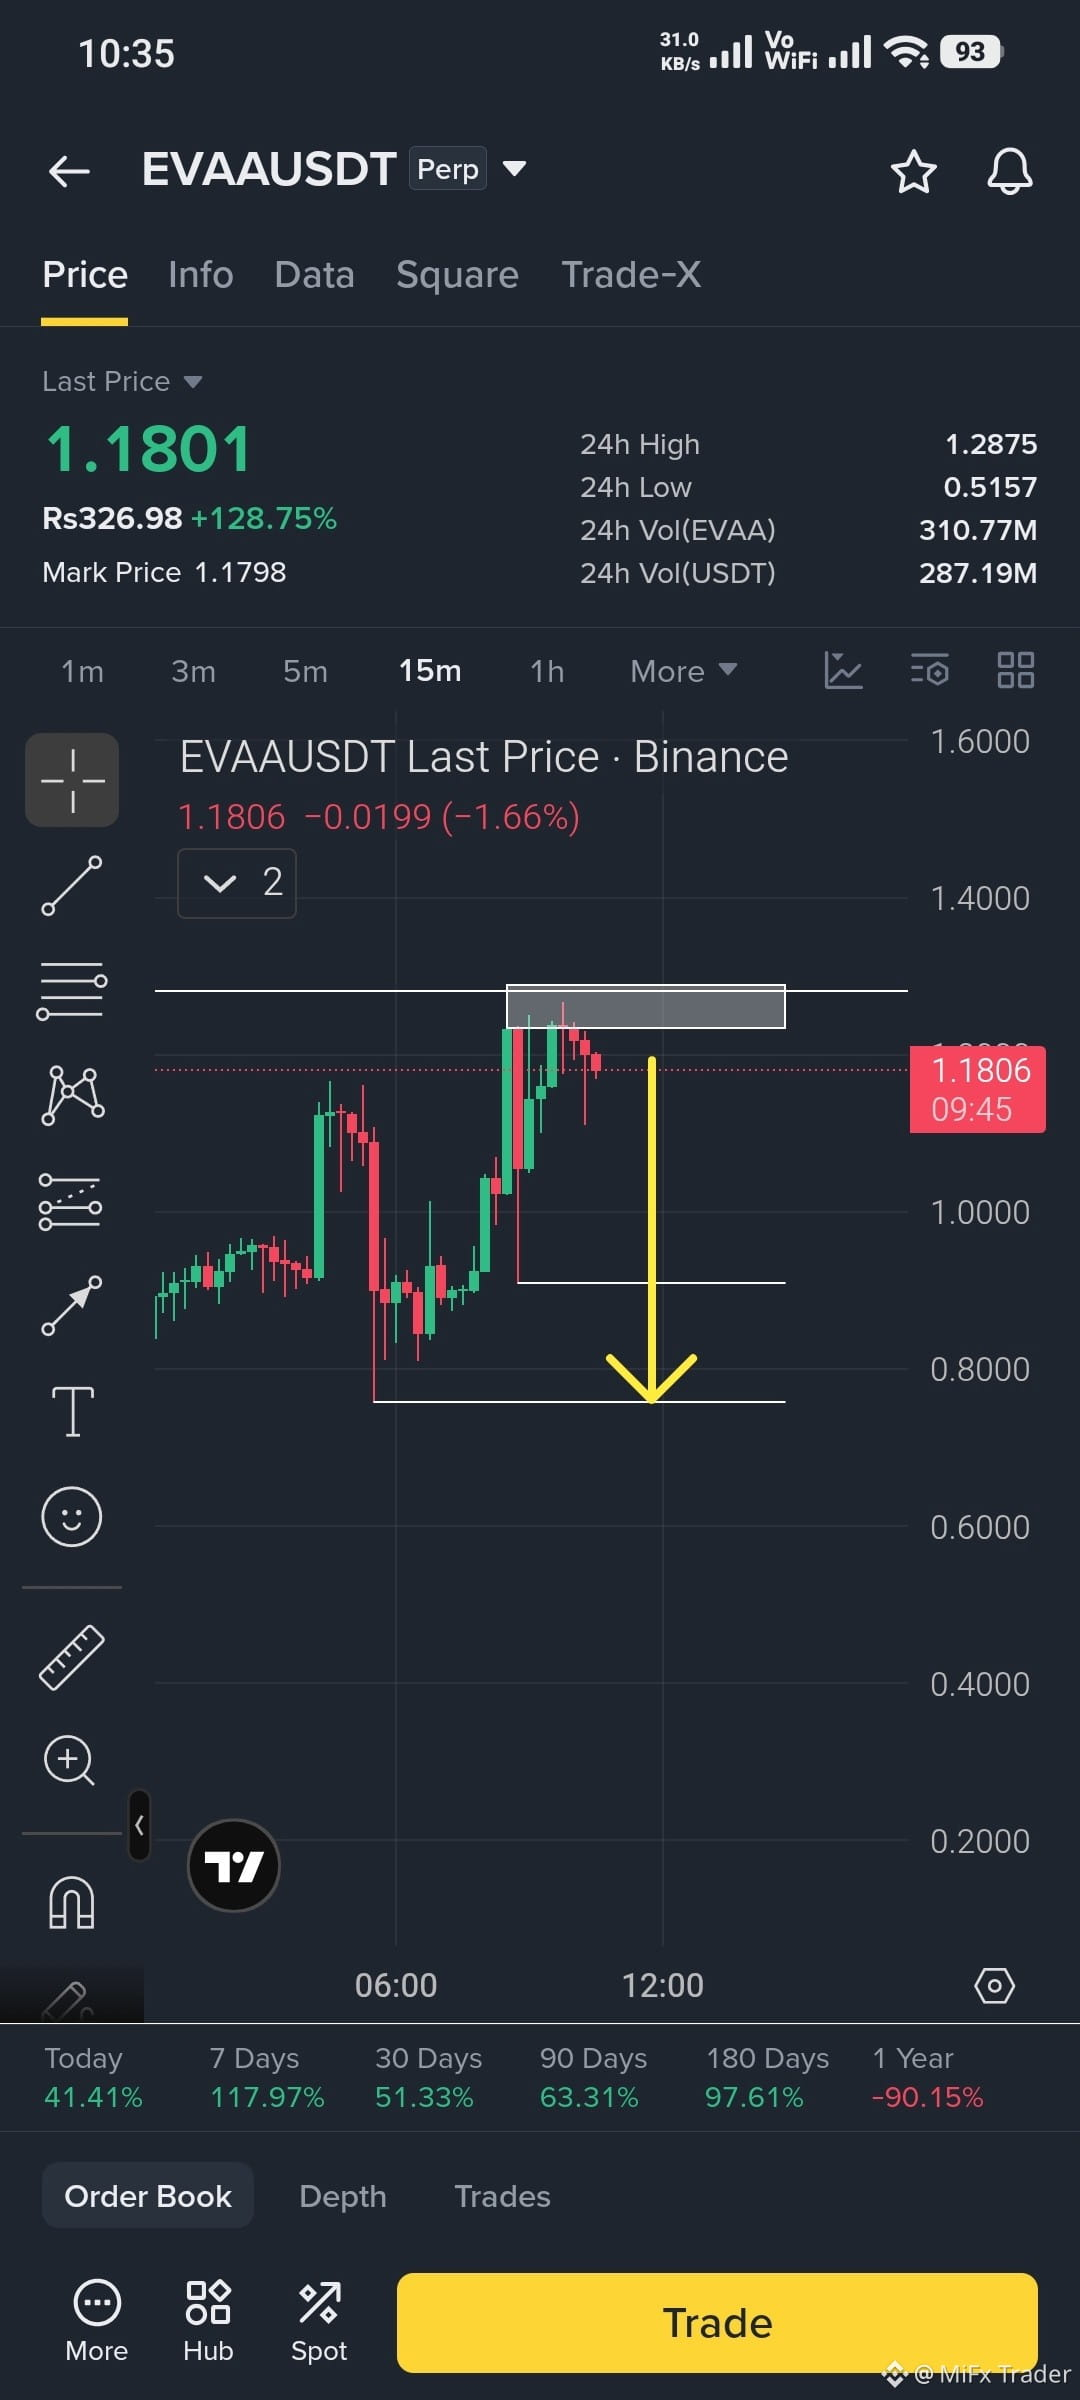
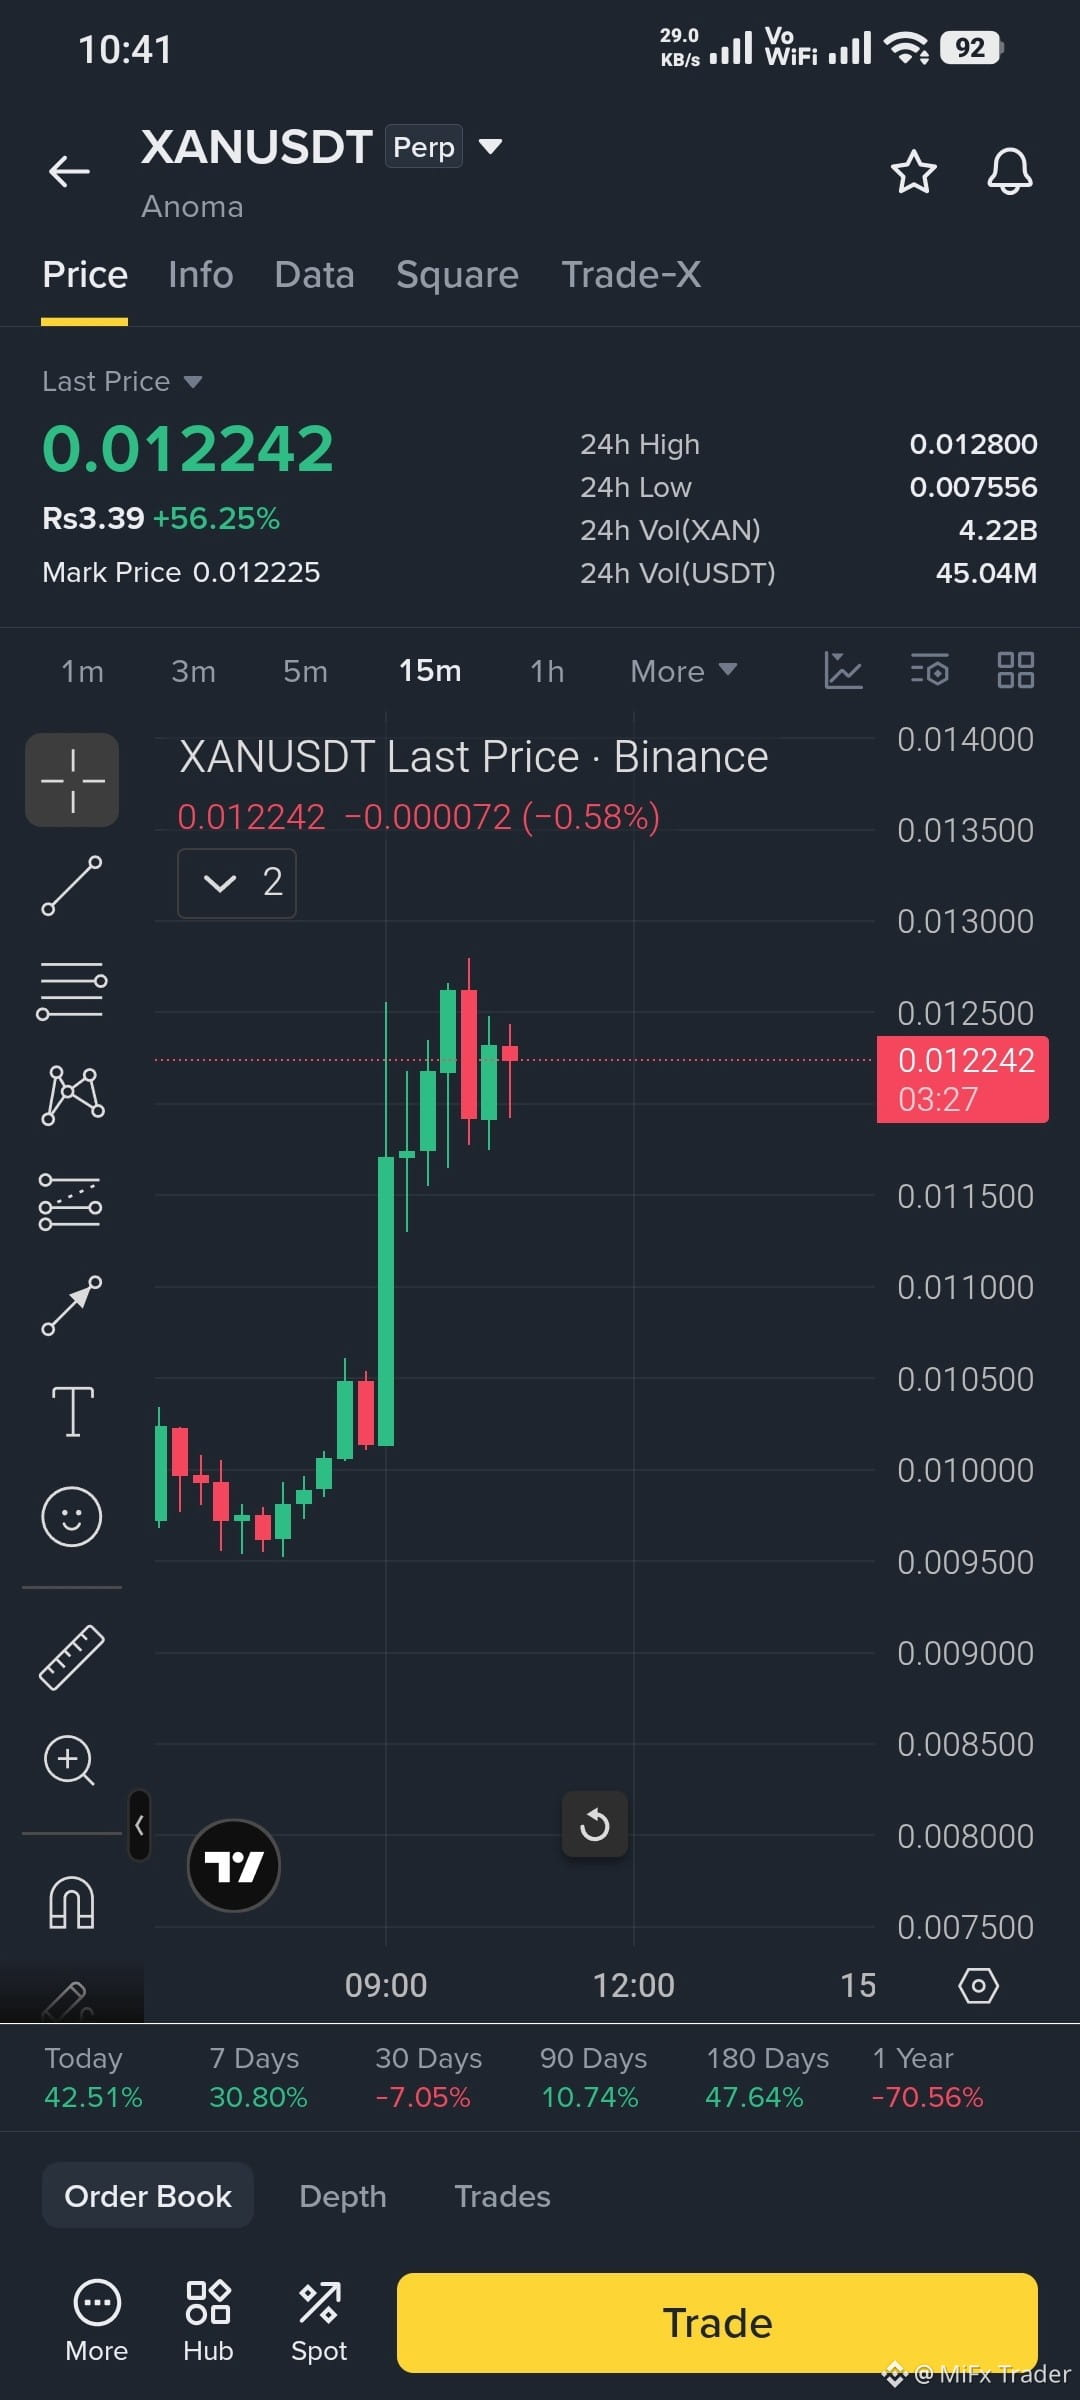
Why people comparing APR and EVAA while they both have totally different charts from each other 🤔🤔
$APR
{future}(APRUSDT)
$EVAA
{future}(EVAAUSDT)
#MiFxTrader
Why people comparing APR and EVAA while they both have totally different charts from each other 🤔🤔
$APR
$EVAA
#MiFxTrader
$APR
$EVAA
#MiFxTrader
518
·
--
Падение
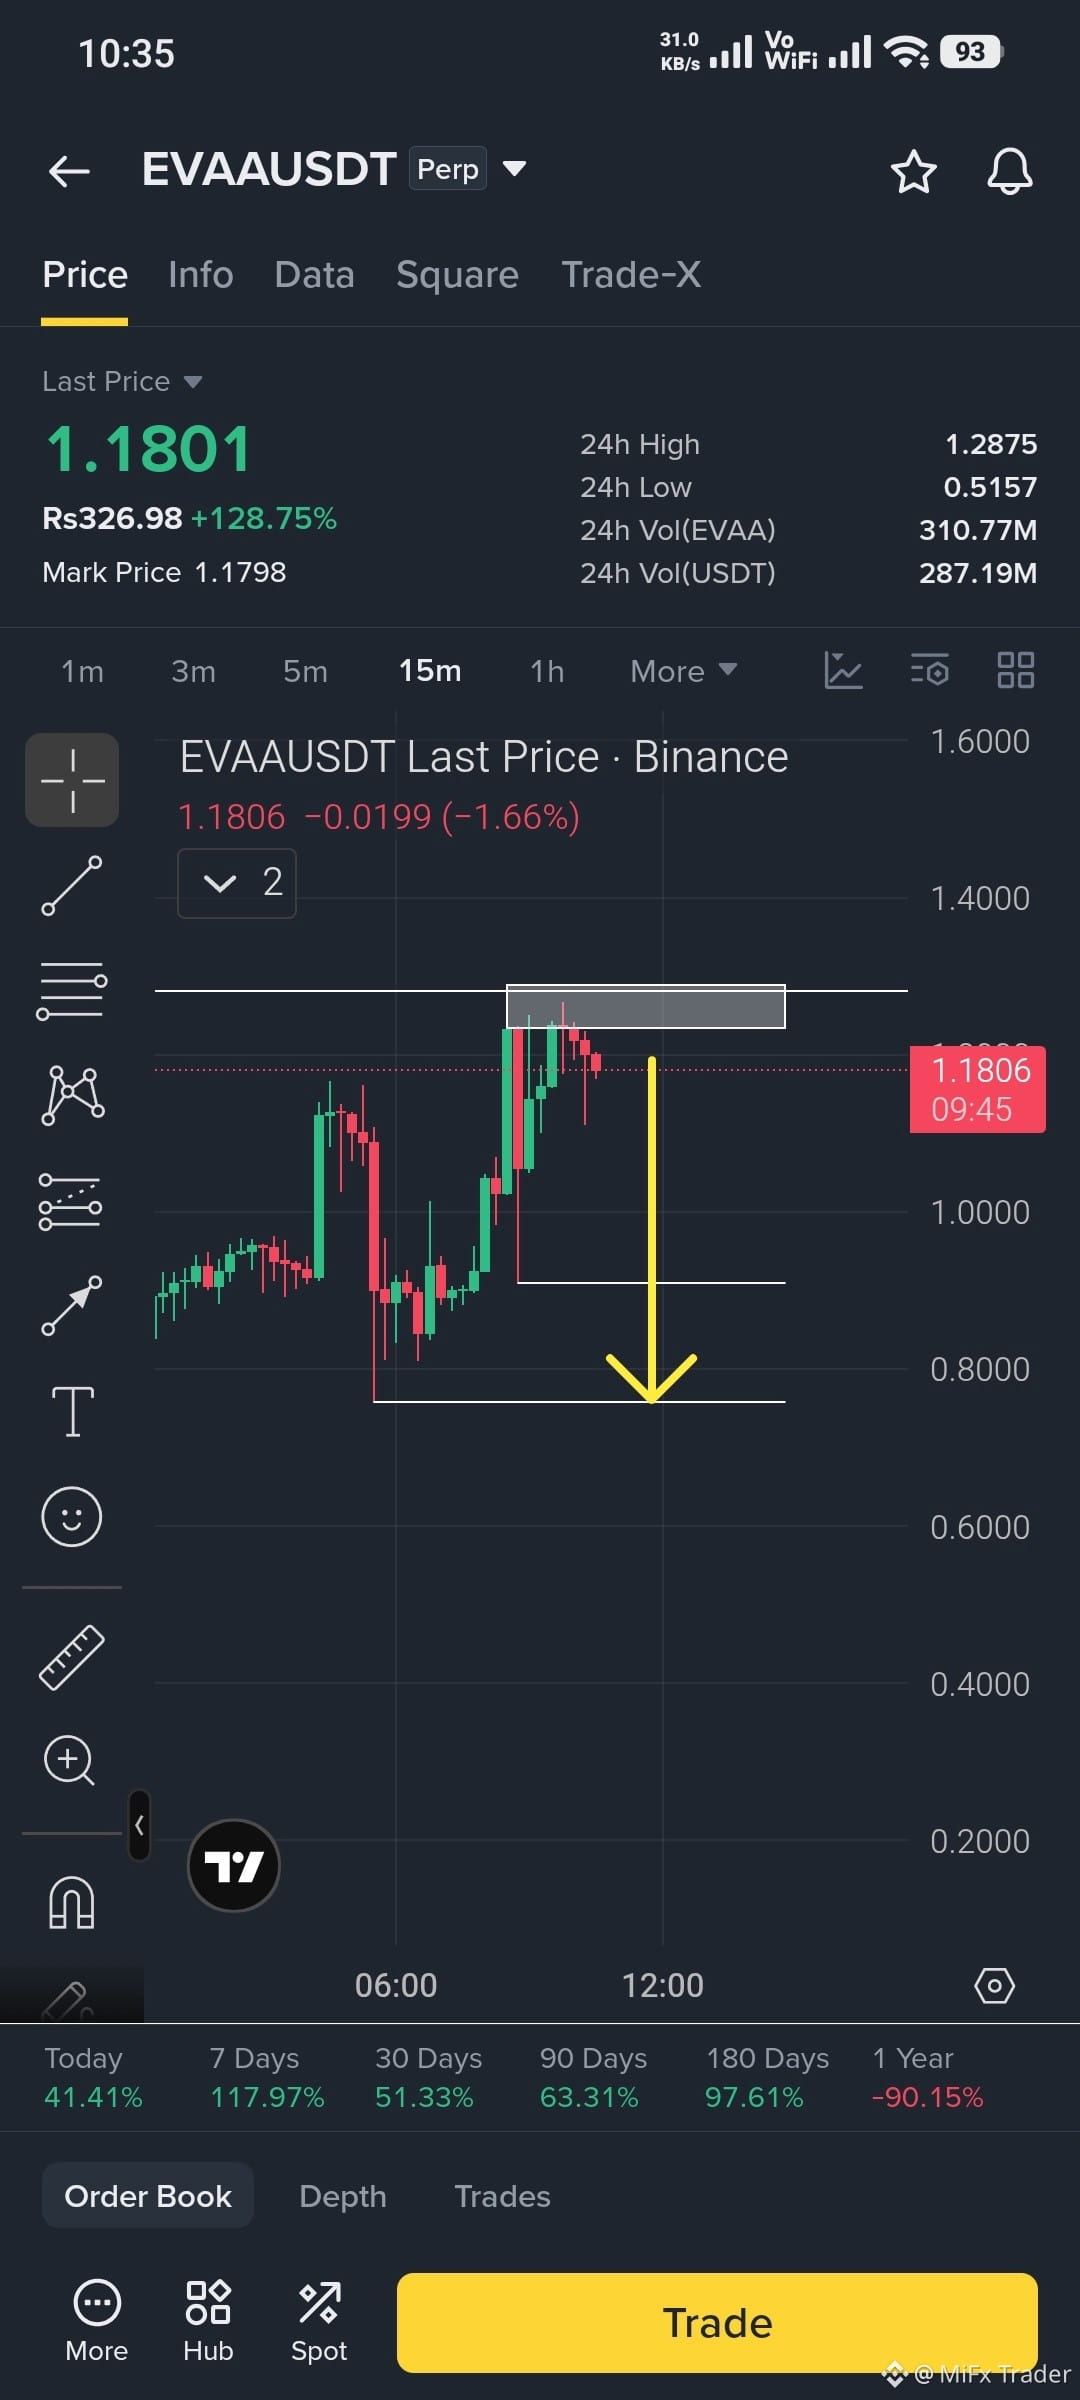
$EVAA losing it's buying strength as it hits a 1D gap and can have a solid rejection...
I'm going short in this with stop loss above the recent high and expecting target 0.9000 and 0.075000.
#MiFxTrader
$EVAA losing it's buying strength as it hits a 1D gap and can have a solid rejection...
I'm going short in this with stop loss above the recent high and expecting target 0.9000 and 0.075000.
#MiFxTrader
I'm going short in this with stop loss above the recent high and expecting target 0.9000 and 0.075000.
#MiFxTrader
313
·
--
Рост
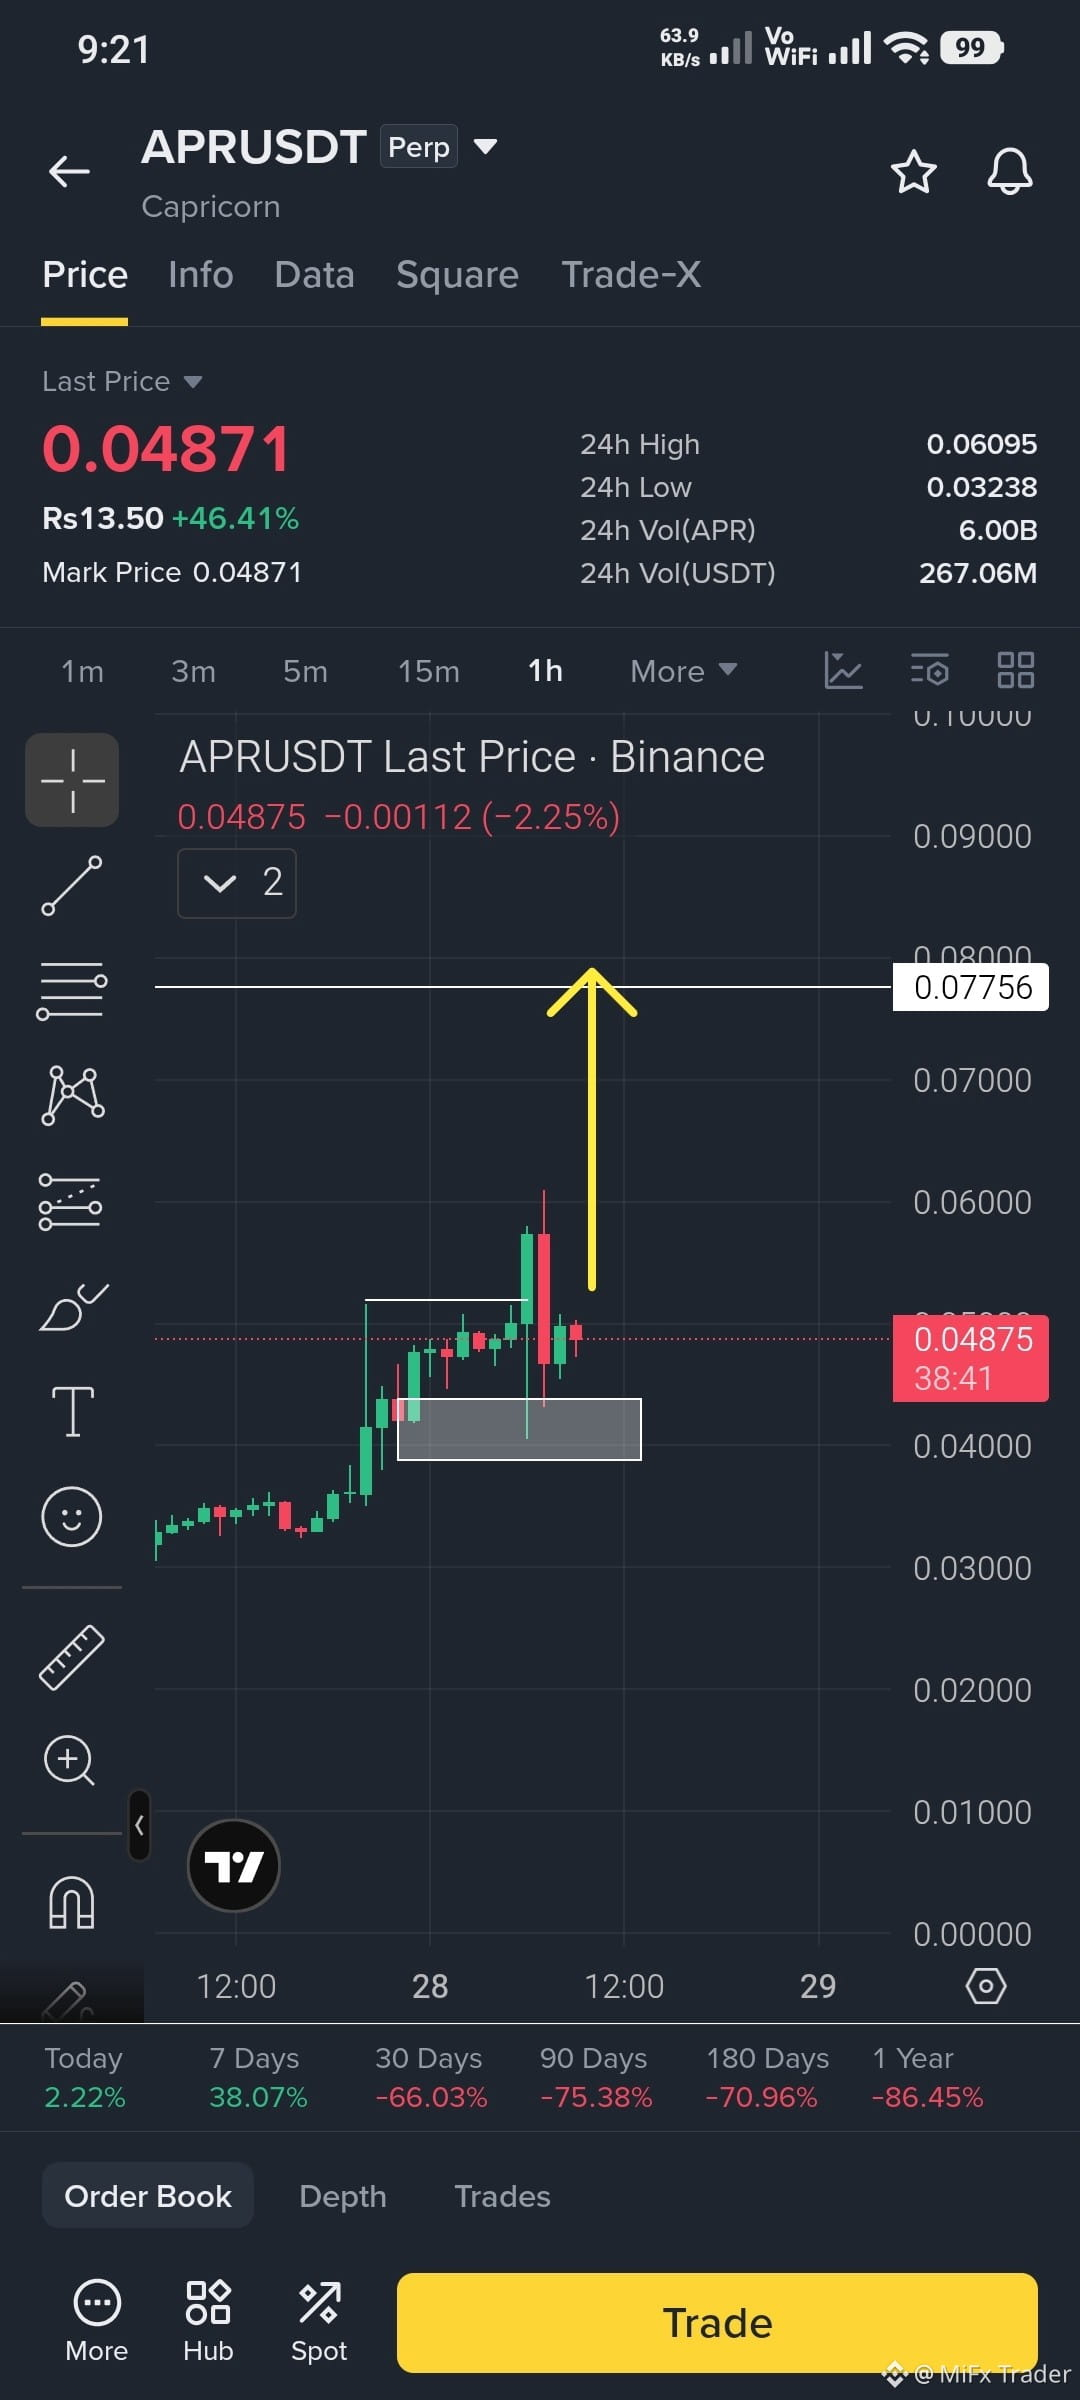
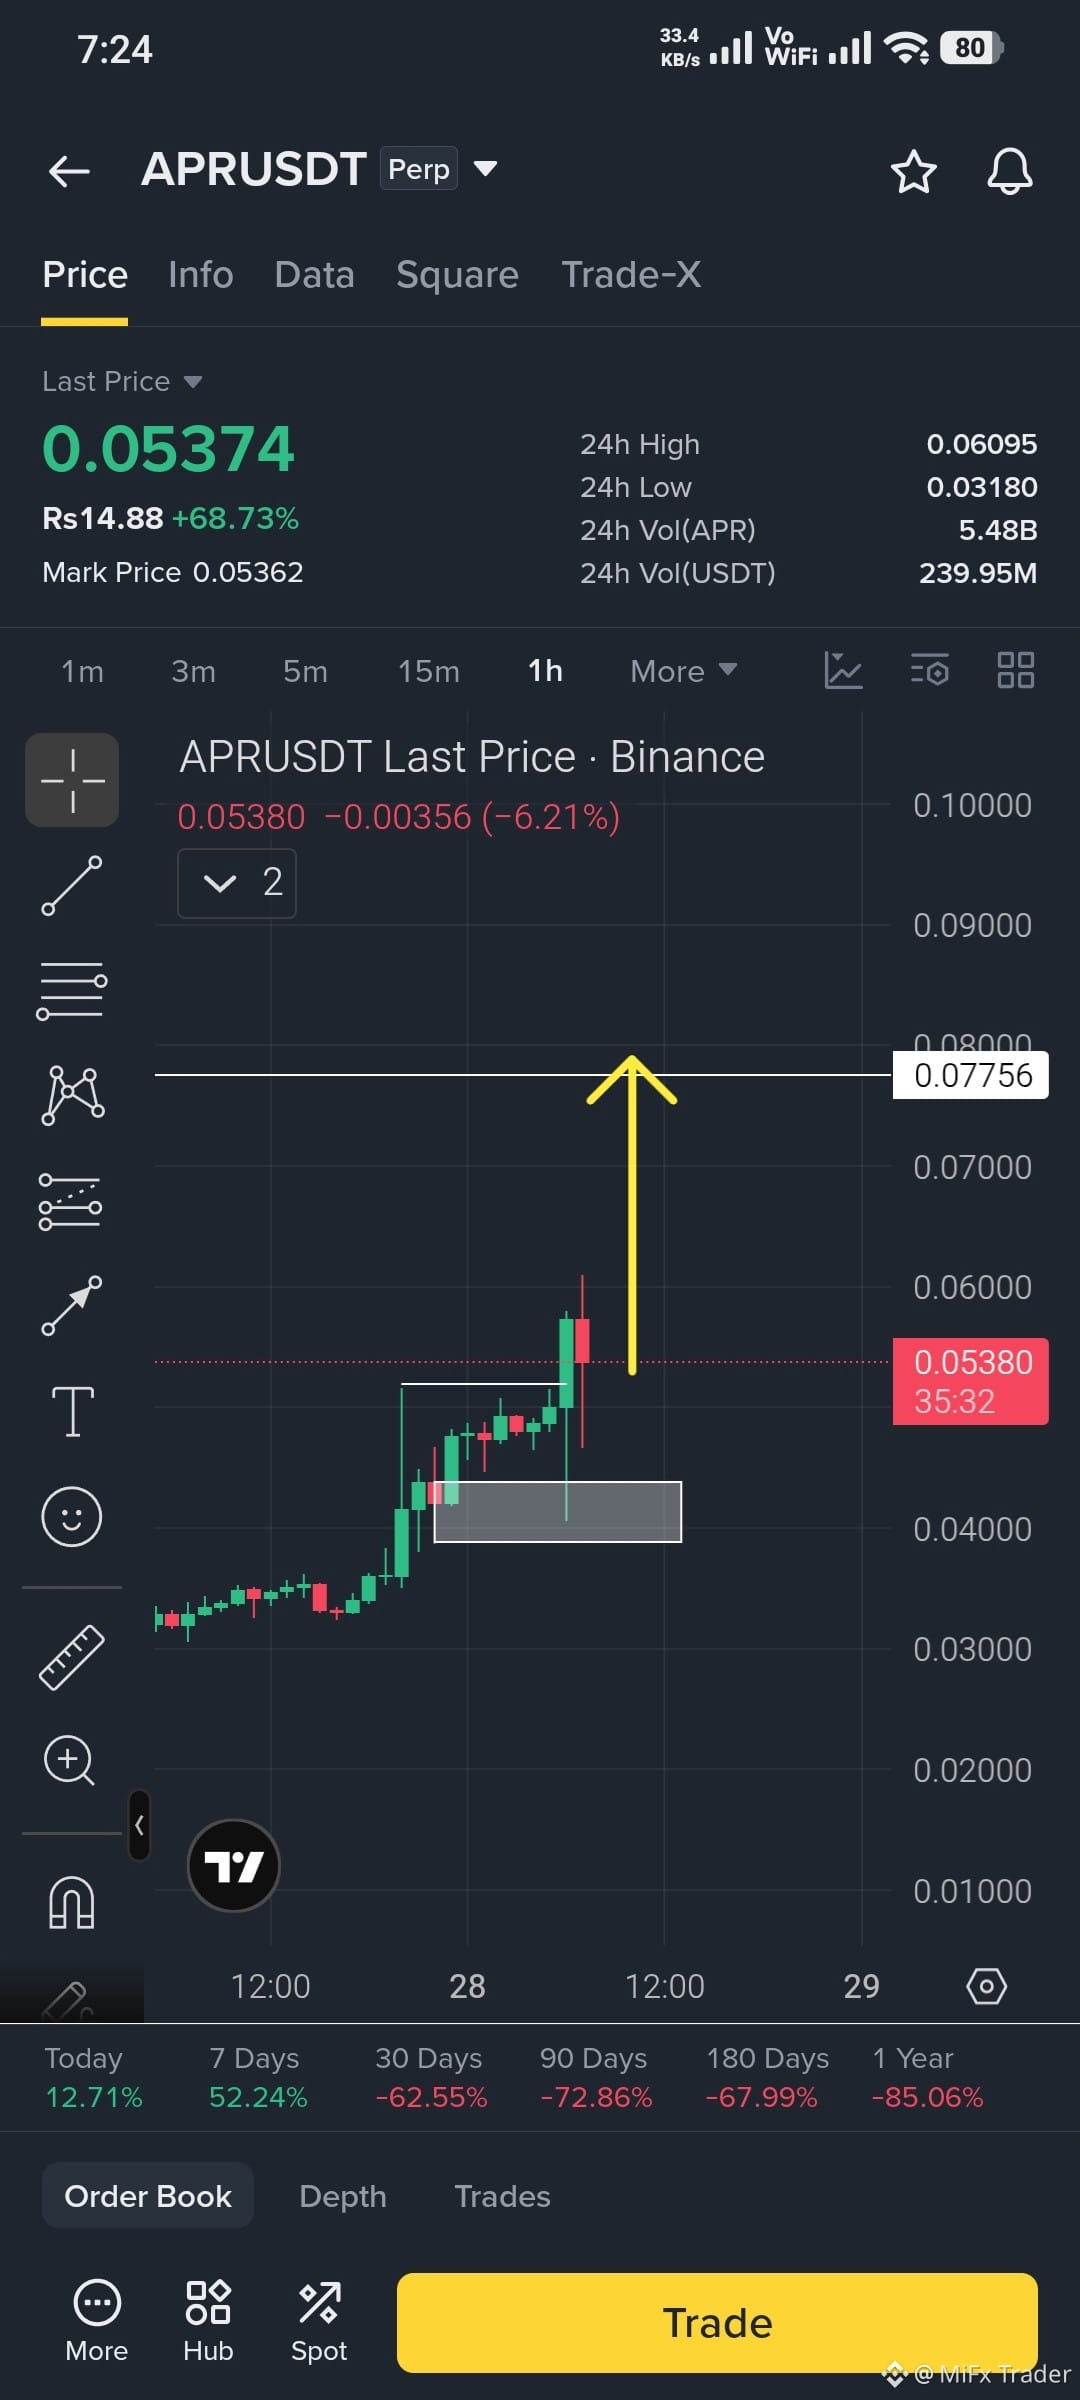
$APR Is back to retest, it's a good price to enter long here with stop loss of ( 0.04000 ) and expecting a target of ( 0.07700 ).
I'm going in guys 🚀🚀🚀 let's see if I win or lose 😜
#MiFxTrader
$APR Is back to retest, it's a good price to enter long here with stop loss of ( 0.04000 ) and expecting a target of ( 0.07700 ).
I'm going in guys 🚀🚀🚀 let's see if I win or lose 😜
#MiFxTrader
I'm going in guys 🚀🚀🚀 let's see if I win or lose 😜
#MiFxTrader
2
514
·
--
Рост
$APR smartly moving up with a strong bullish trend , expecting it to hit ( 0.07700 ) soon in next few hours...
it's good to long it by putting stop loss below the previous 1 Hour candle low.
NOTE: Use small margin because coin is heavy and also volatile..
$APR
{future}(APRUSDT)
#MiFxTrader
$APR smartly moving up with a strong bullish trend , expecting it to hit ( 0.07700 ) soon in next few hours...
it's good to long it by putting stop loss below the previous 1 Hour candle low.
NOTE: Use small margin because coin is heavy and also volatile..
$APR
#MiFxTrader
it's good to long it by putting stop loss below the previous 1 Hour candle low.
NOTE: Use small margin because coin is heavy and also volatile..
$APR
#MiFxTrader
1
1
789
·
--
Рост
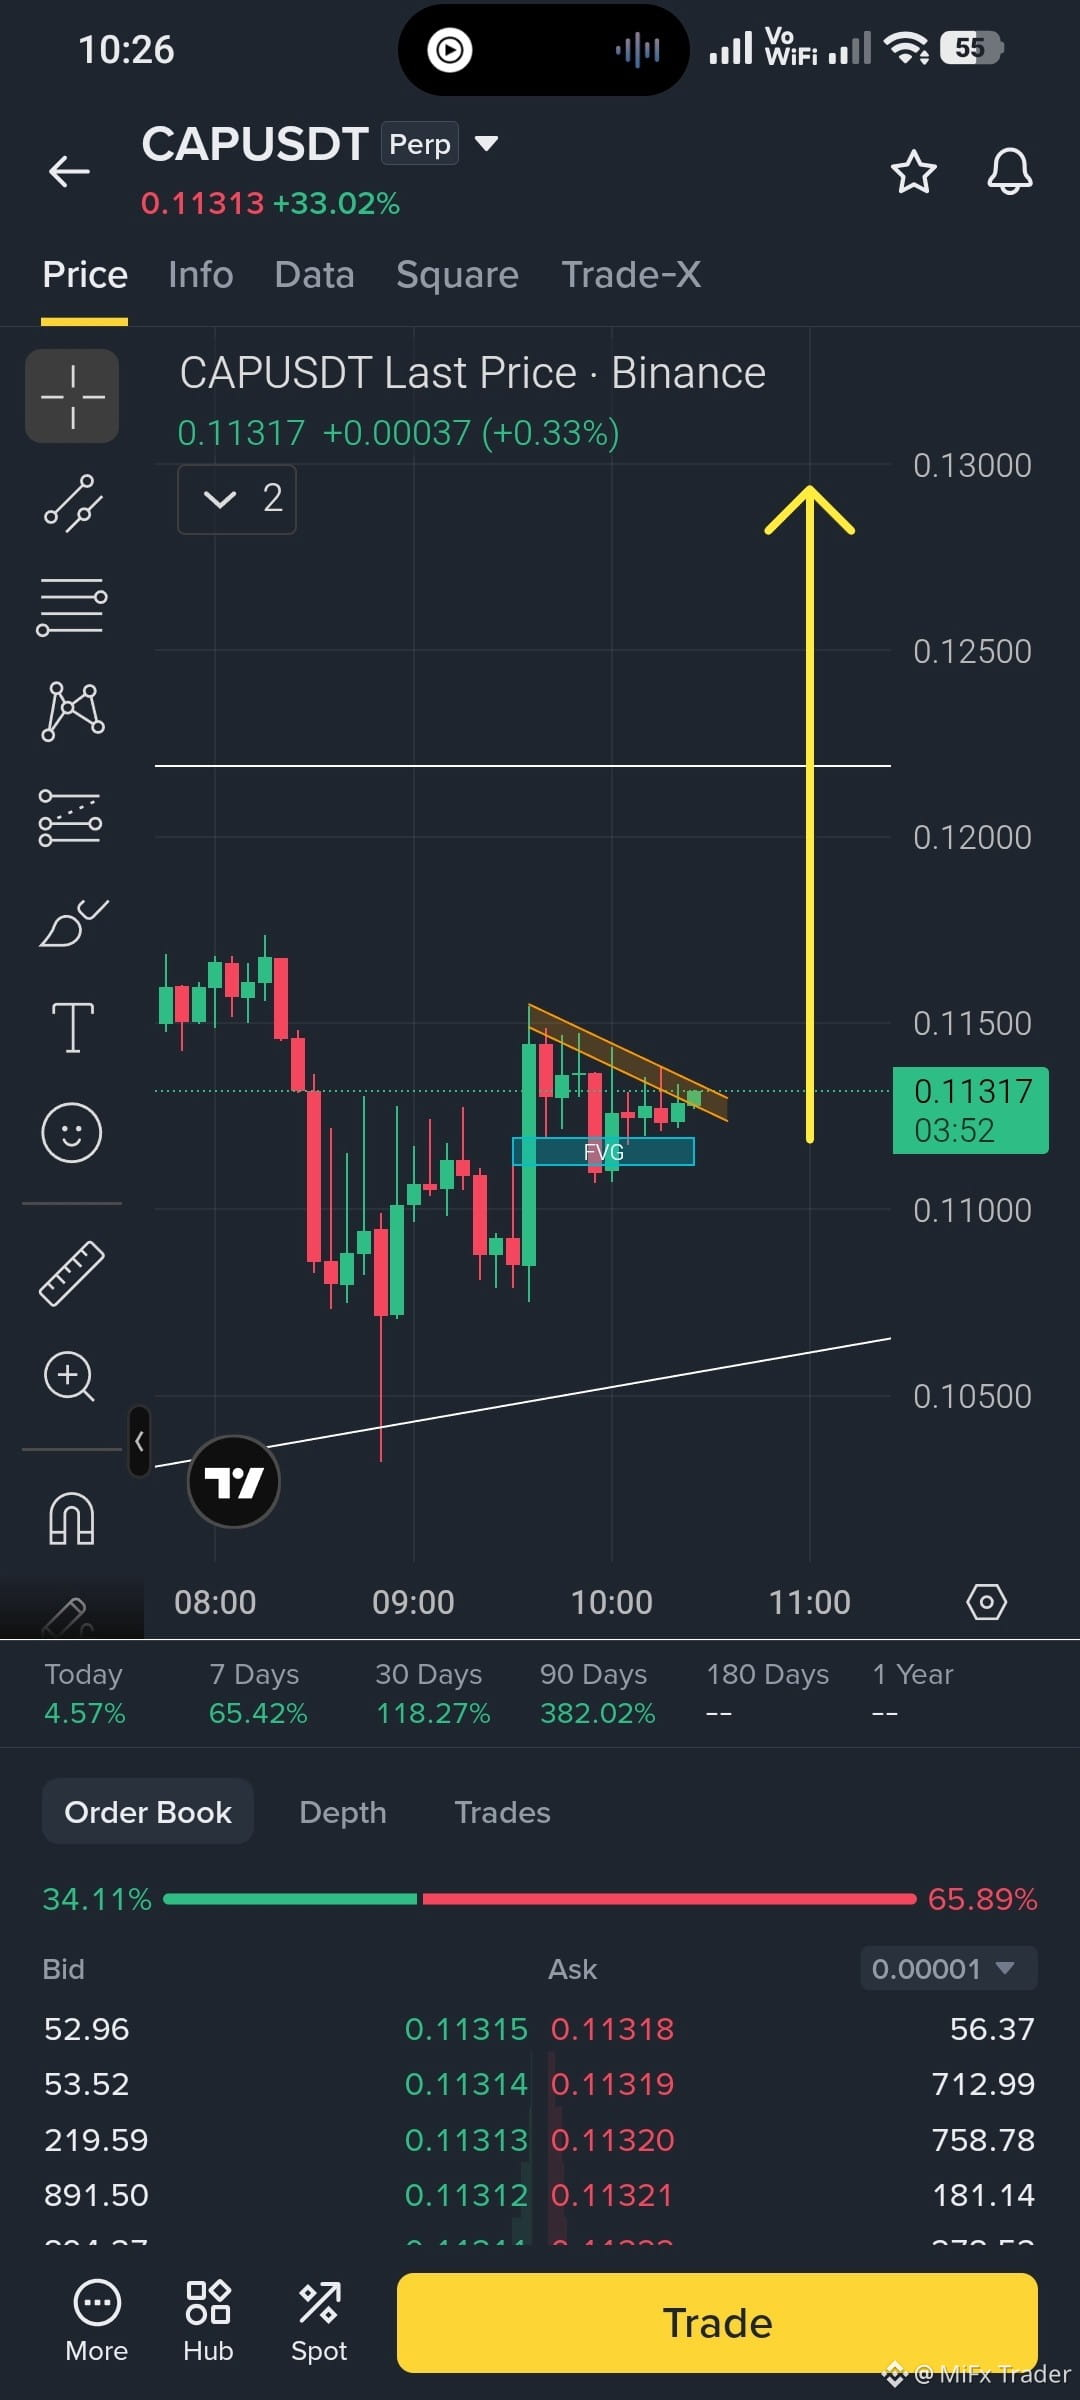
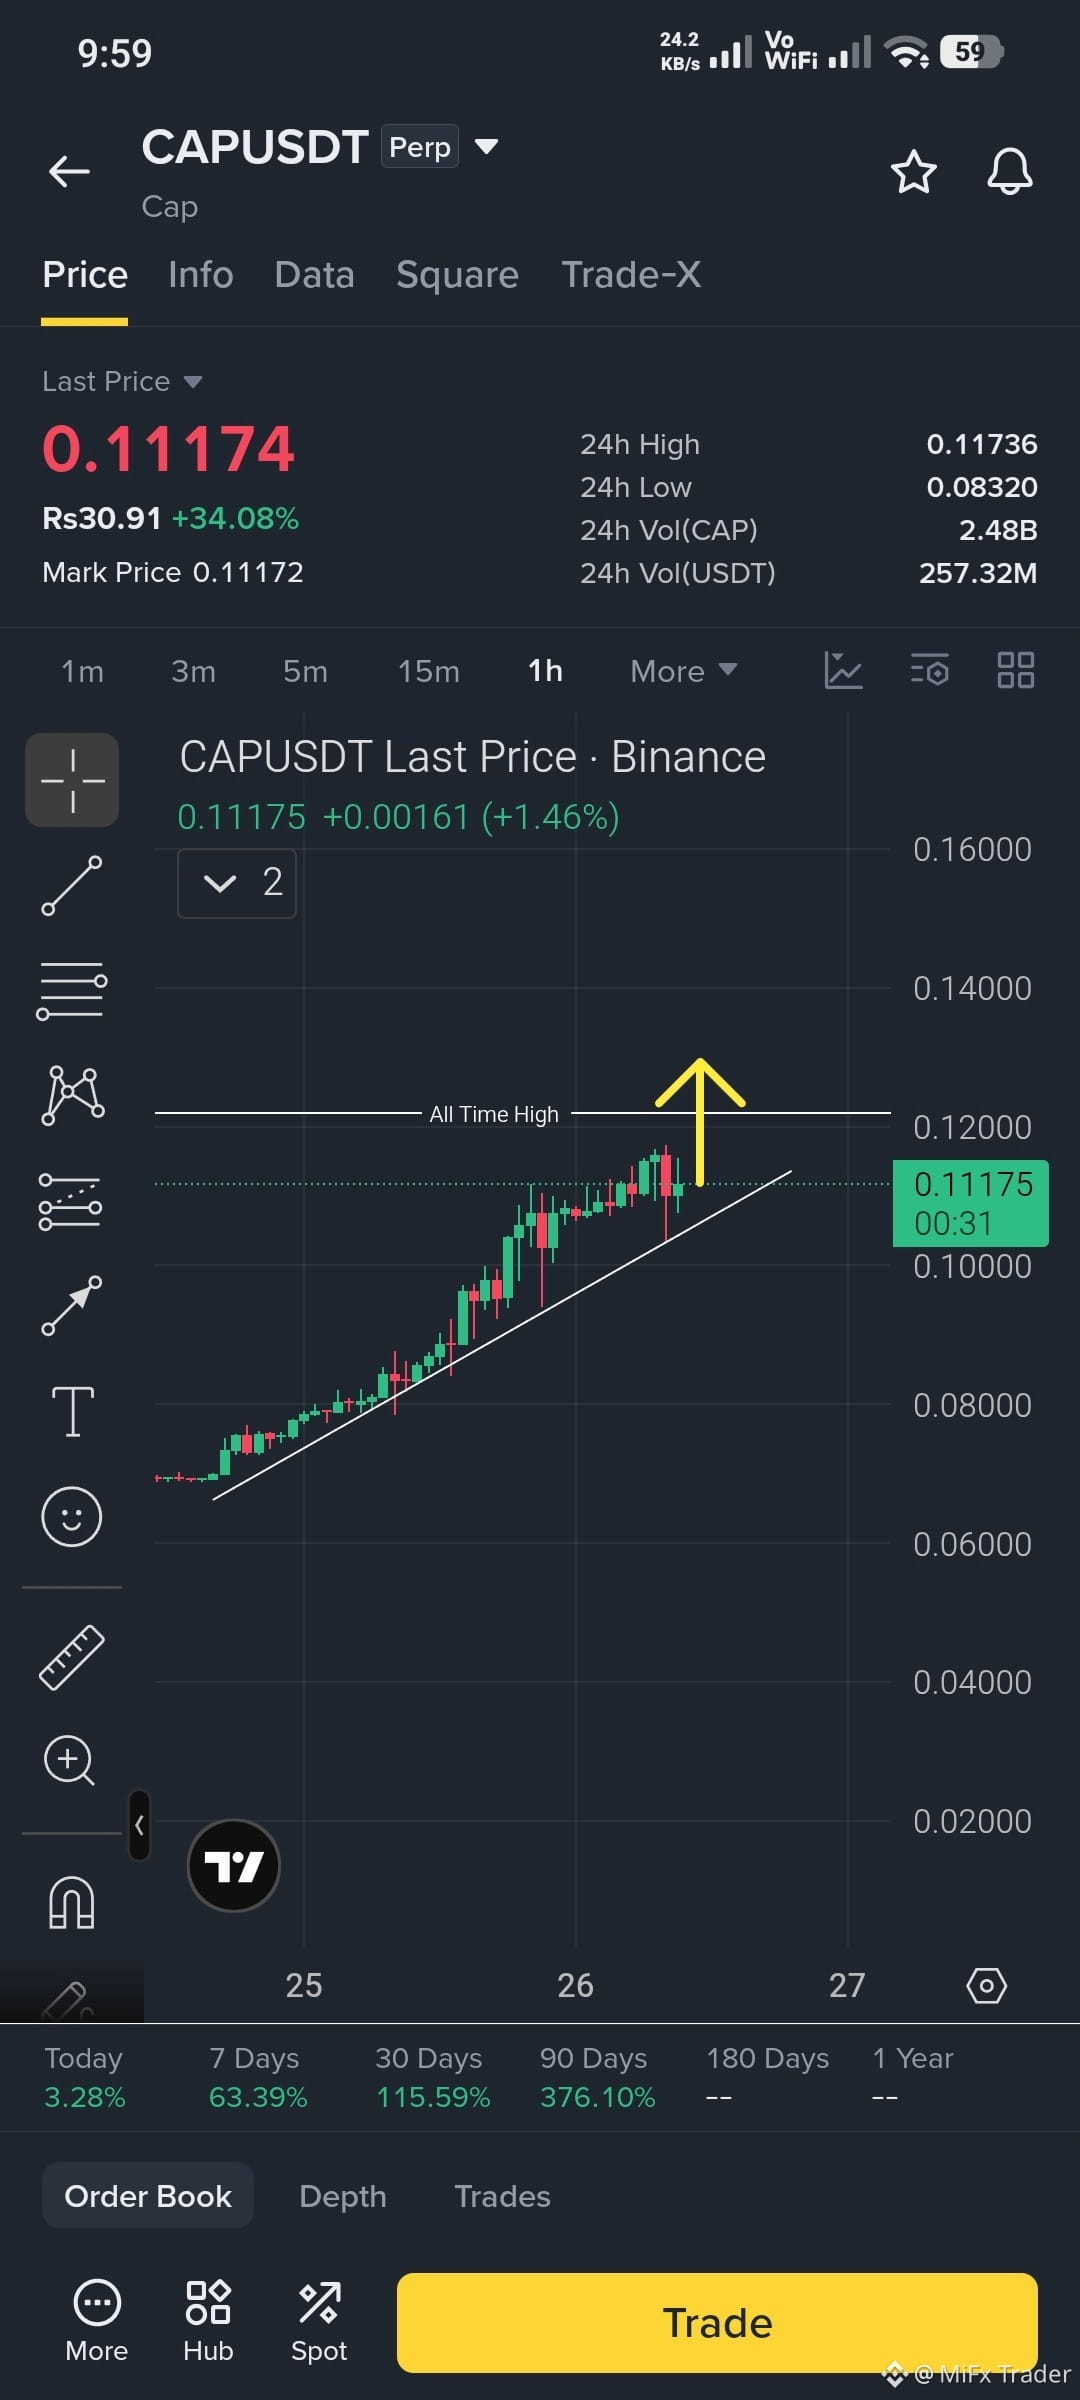
$CAP Is ready to make new ALL TIME HIGH 🚀🚀
Just buy and hold a little , soon will reach ATH.
$CAP
{future}(CAPUSDT)
#MiFxTrader
$CAP Is ready to make new ALL TIME HIGH 🚀🚀
Just buy and hold a little , soon will reach ATH.
$CAP
#MiFxTrader
Just buy and hold a little , soon will reach ATH.
$CAP
#MiFxTrader
365
·
--
Рост
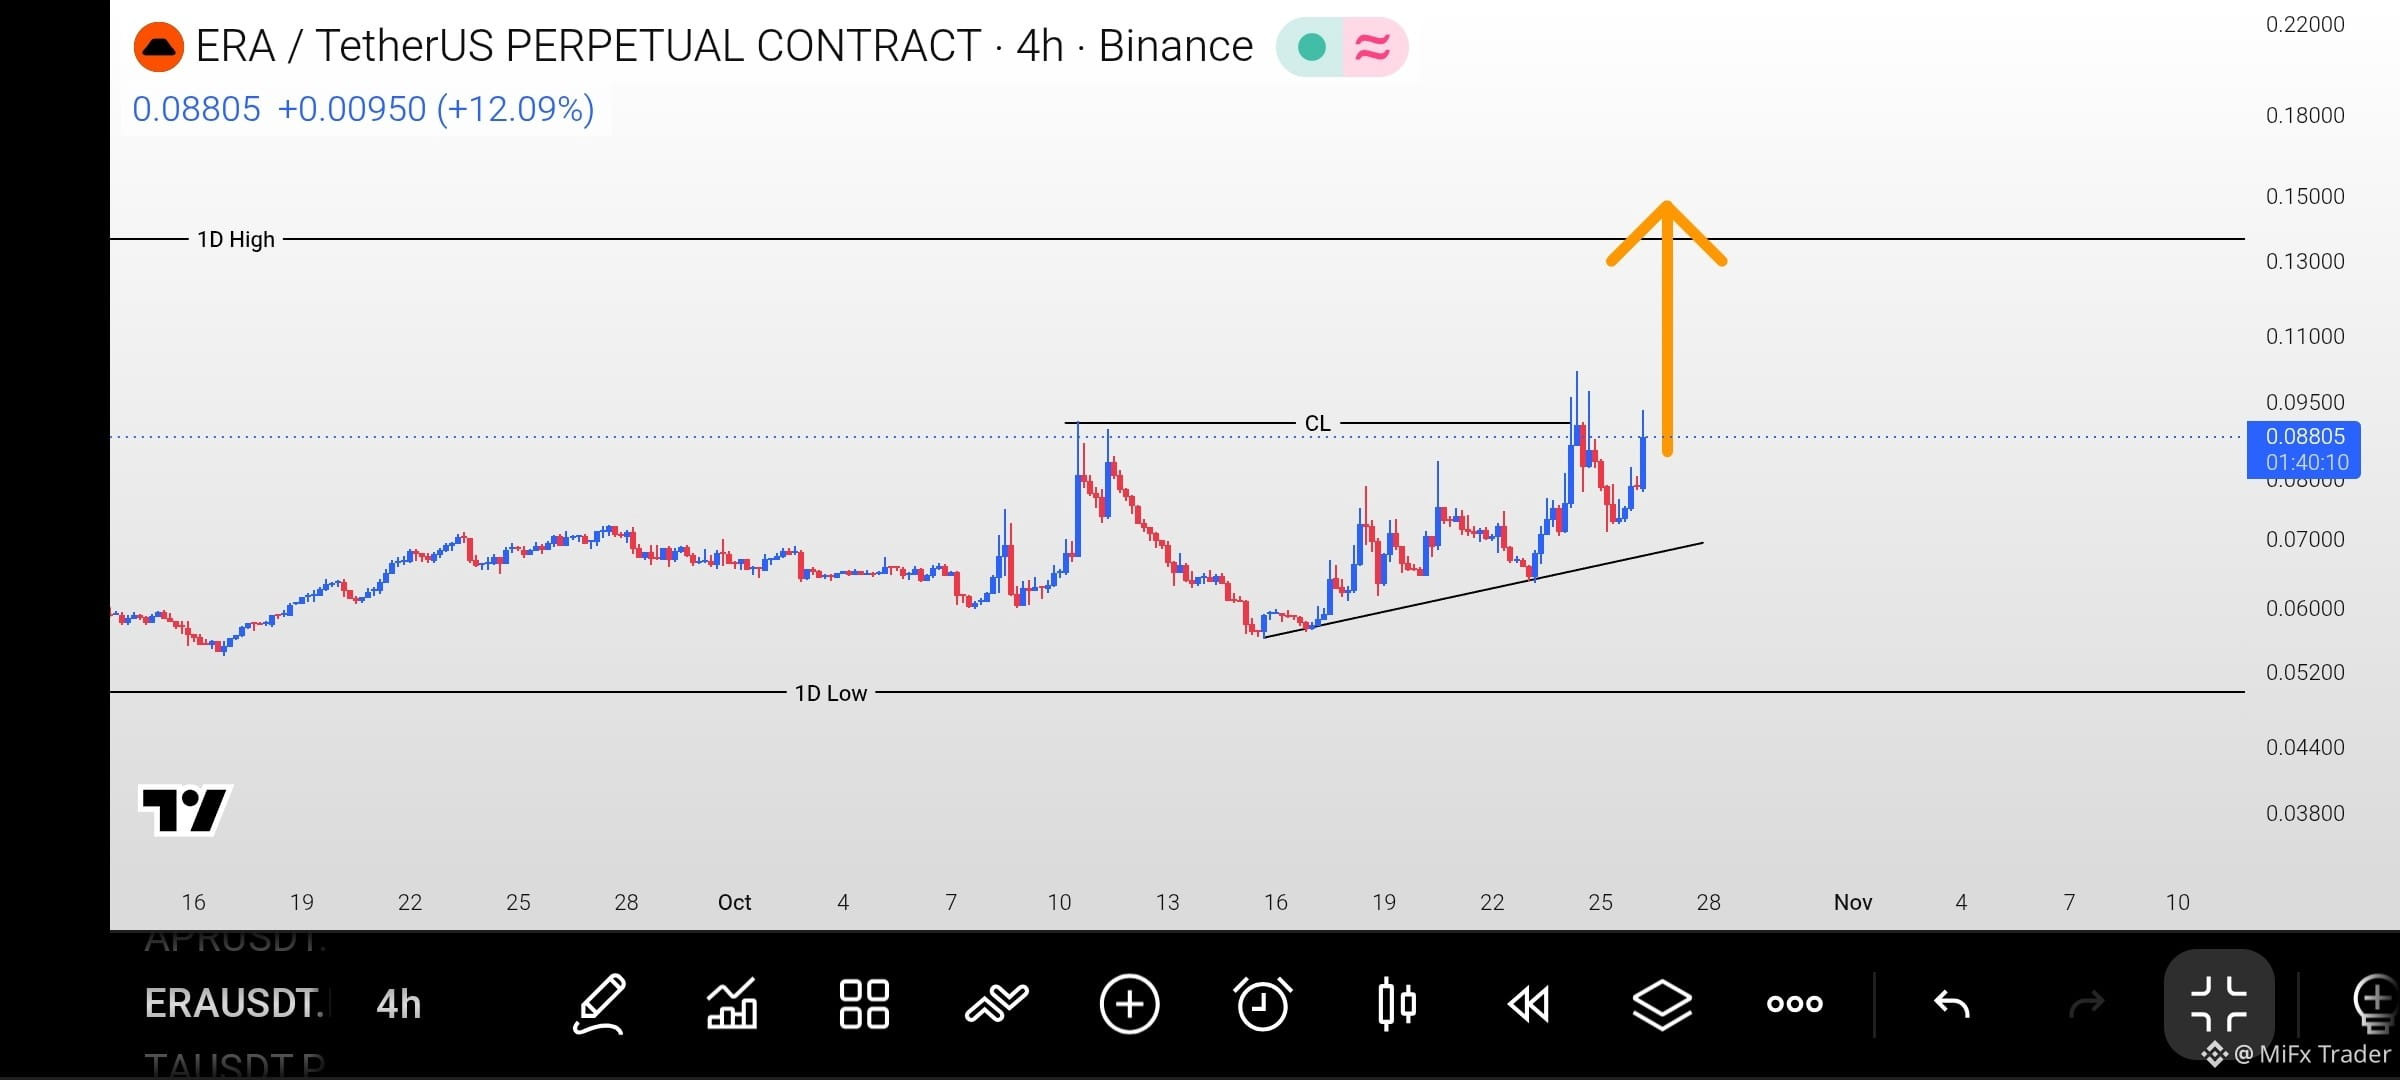
$ERA Is bullish on higher time frames including 1 Day , as it swept recent previous high ( CL ) and then started moving up again...
Recommended to go long on this as far as it's above the trendLine ( 0.06000 ) and keep eyes on the 1 Day high for the Target ( 0.13000 ).
$ERA
{future}(ERAUSDT)
#MiFxTrader
$ERA Is bullish on higher time frames including 1 Day , as it swept recent previous high ( CL ) and then started moving up again...
Recommended to go long on this as far as it's above the trendLine ( 0.06000 ) and keep eyes on the 1 Day high for the Target ( 0.13000 ).
$ERA
#MiFxTrader
Recommended to go long on this as far as it's above the trendLine ( 0.06000 ) and keep eyes on the 1 Day high for the Target ( 0.13000 ).
$ERA
#MiFxTrader
373
·
--
Рост
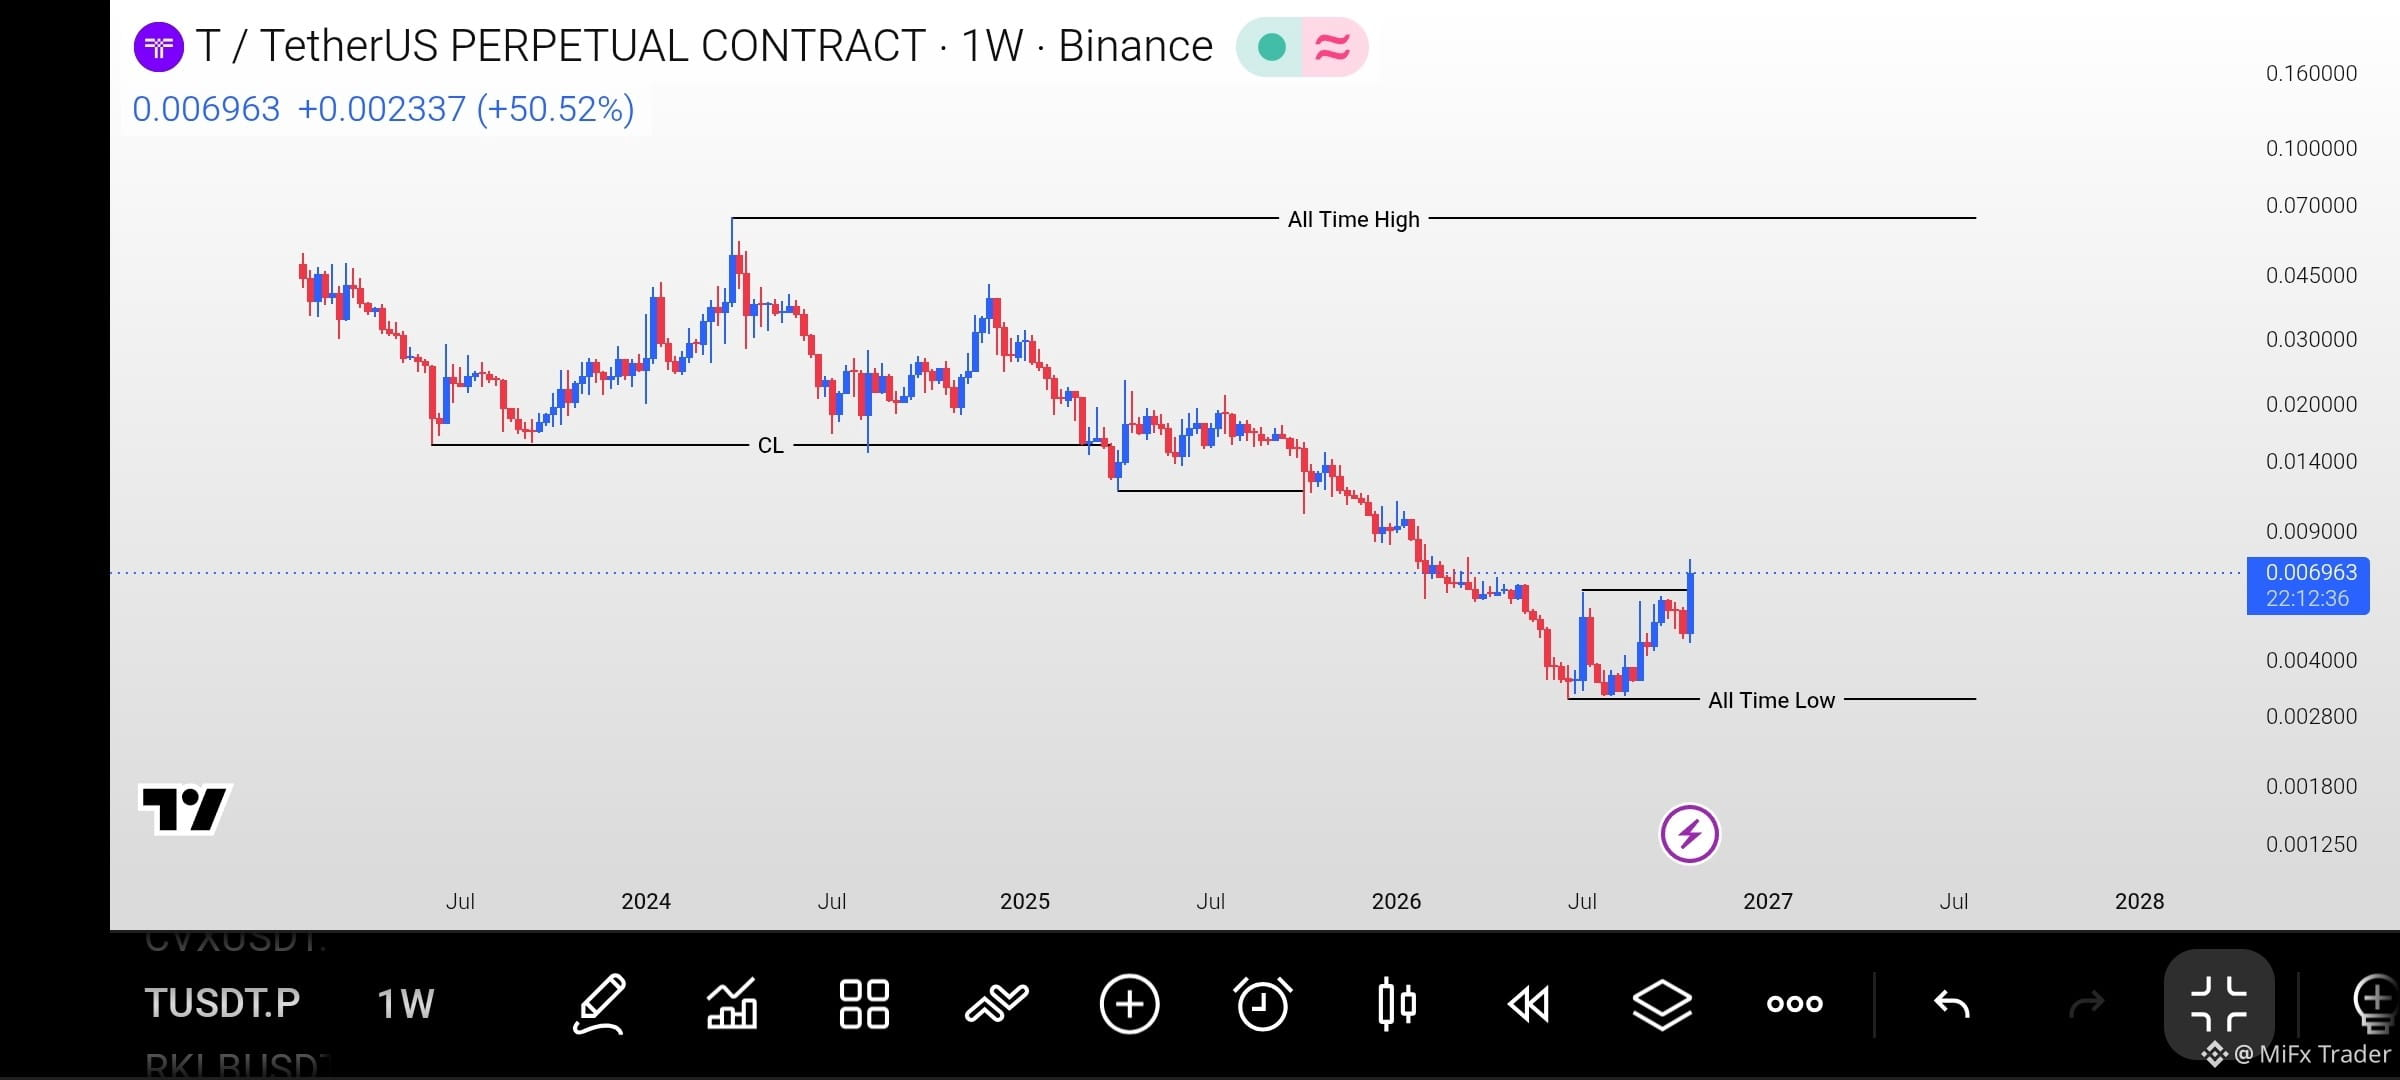
$T Why this coin started pumping from it's ALL TIME LOW !!
Is it going to make new ALL TIME HIGH 🤔
$T
{future}(TUSDT)
#MiFxTrader
$T Why this coin started pumping from it's ALL TIME LOW !!
Is it going to make new ALL TIME HIGH 🤔
$T
#MiFxTrader
Is it going to make new ALL TIME HIGH 🤔
$T
#MiFxTrader
650
·
--
Падение
MiFx Trader
·
--
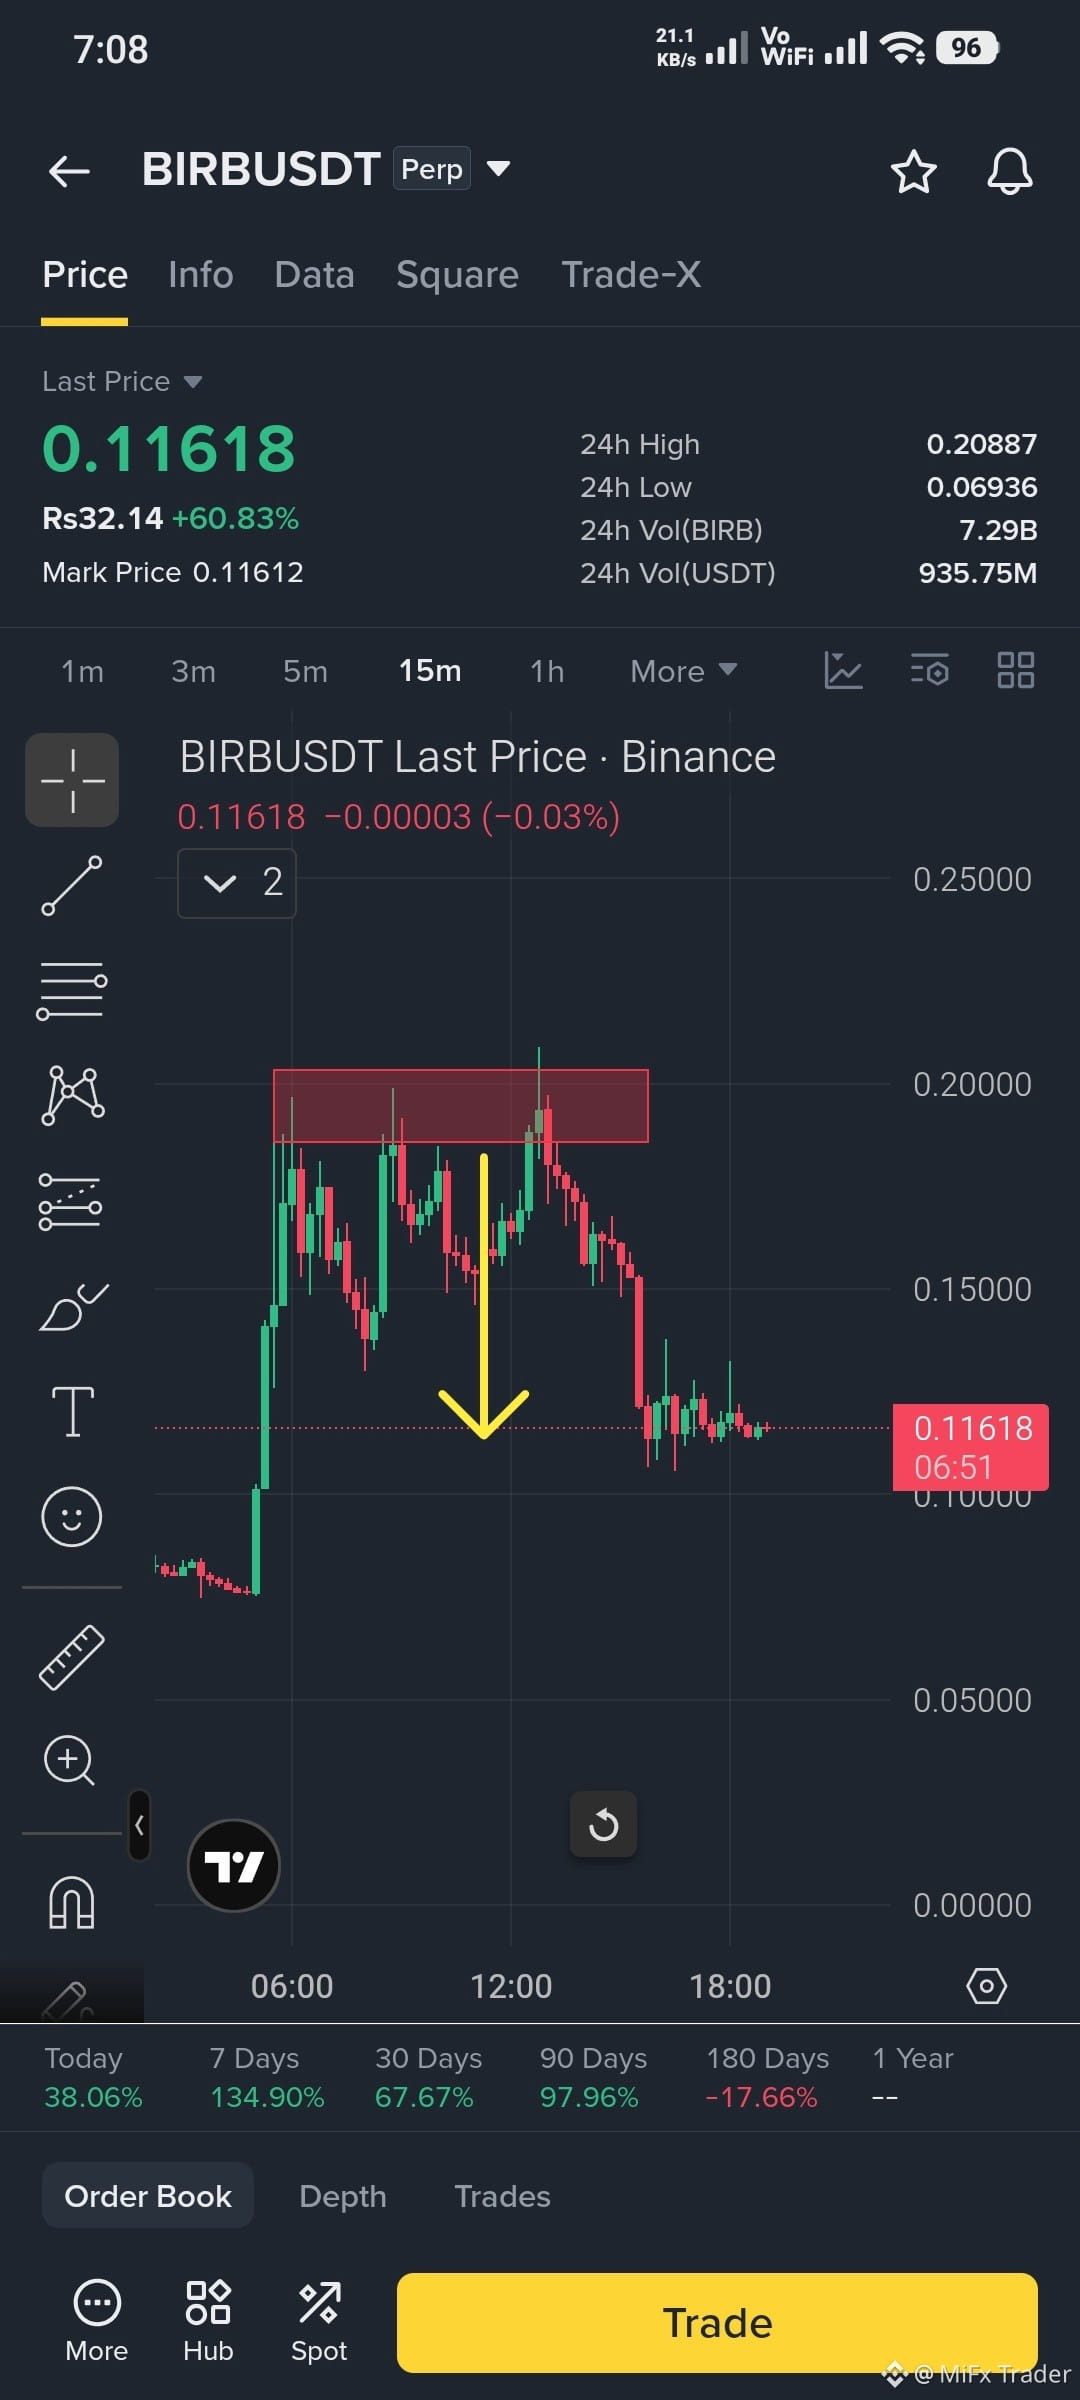
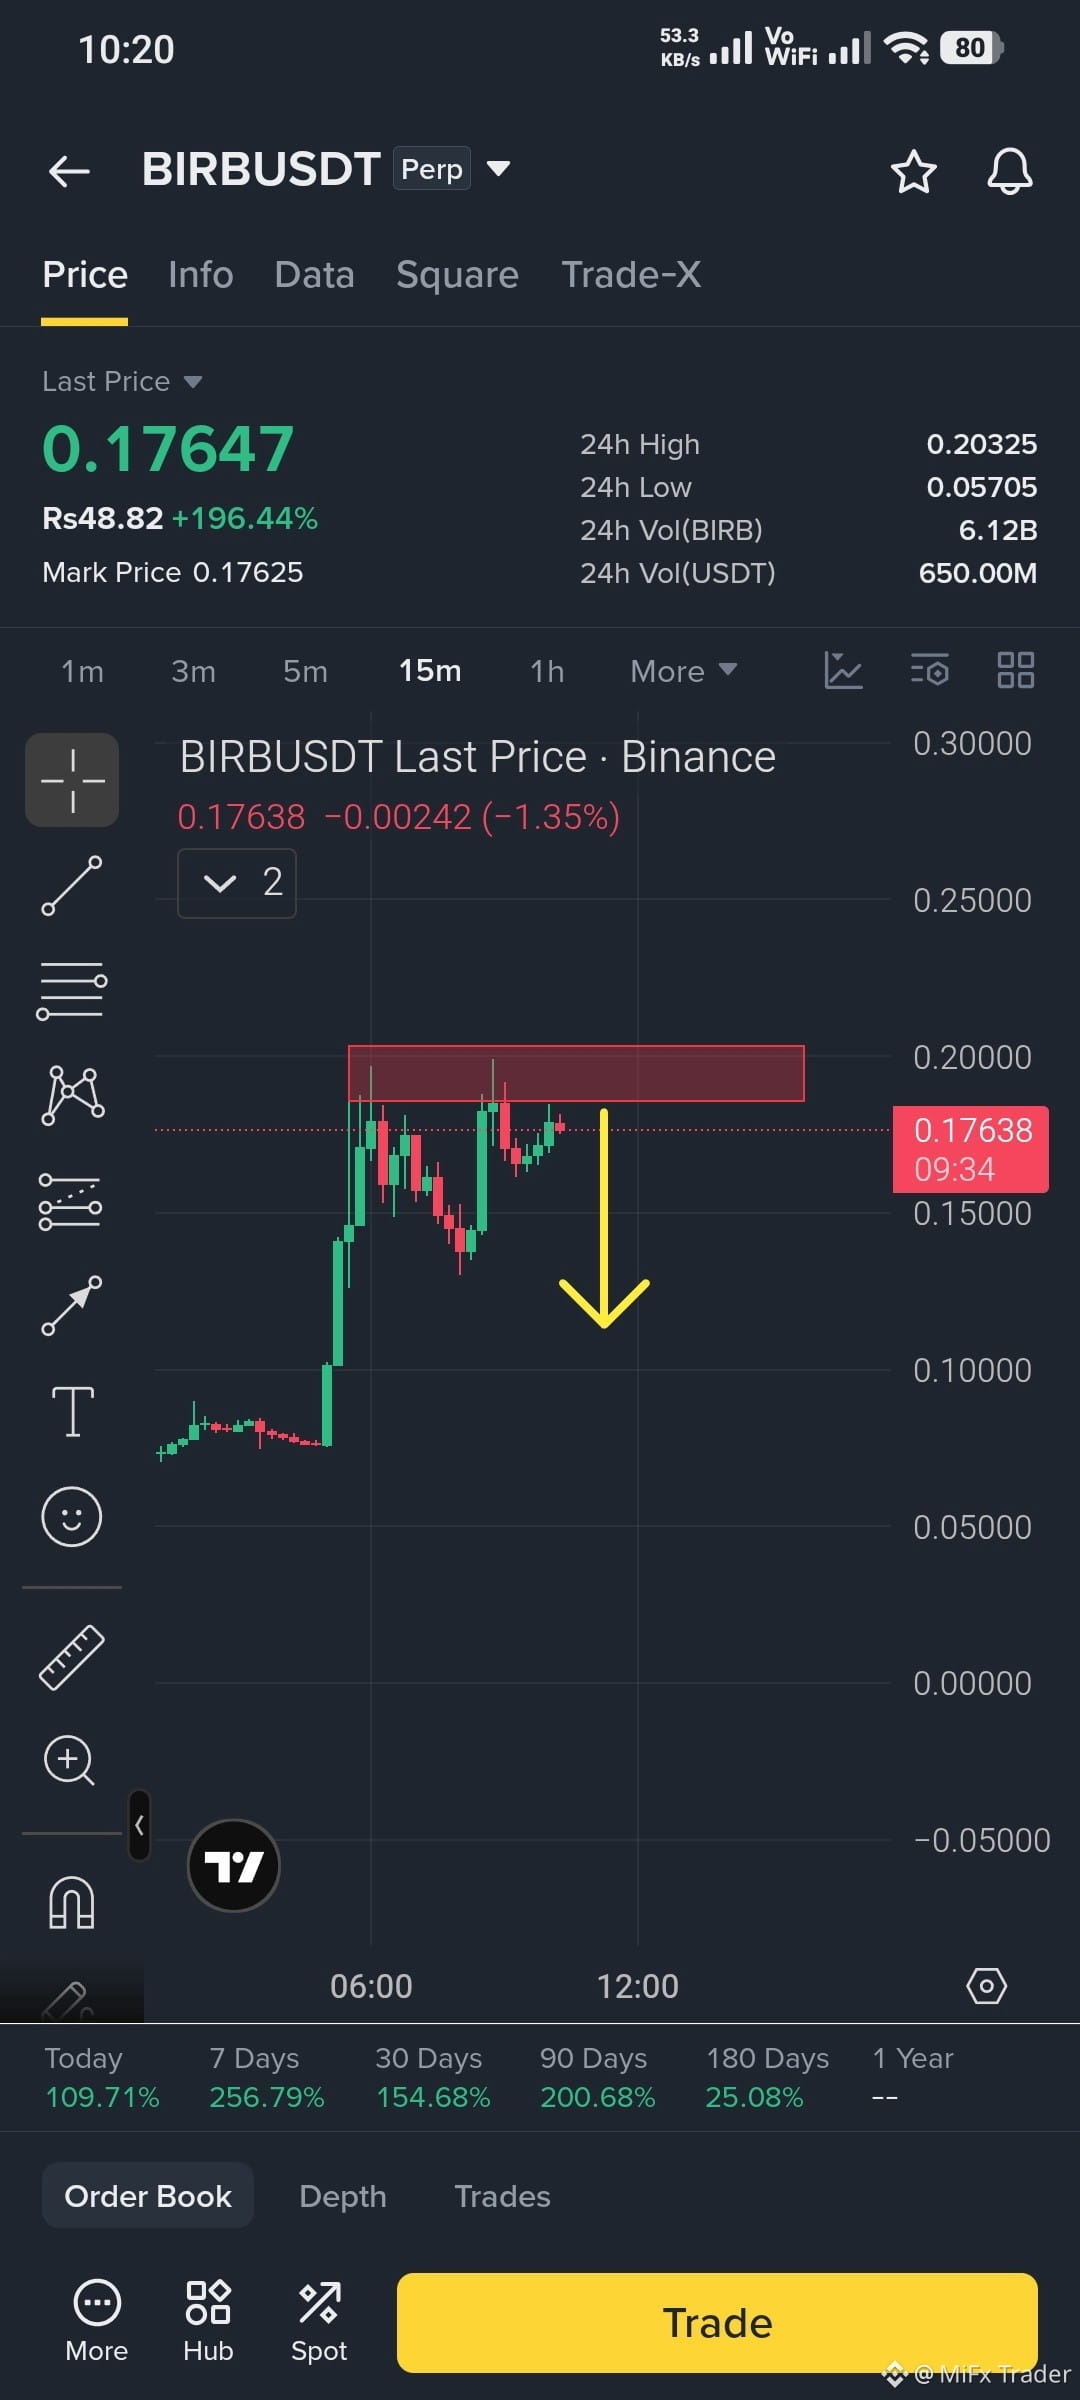
Падение$BIRB Look for short in this coin , a fast drop can be happen in next hour...
#MiFxTrader
#MiFxTrader
720
·
--
Рост
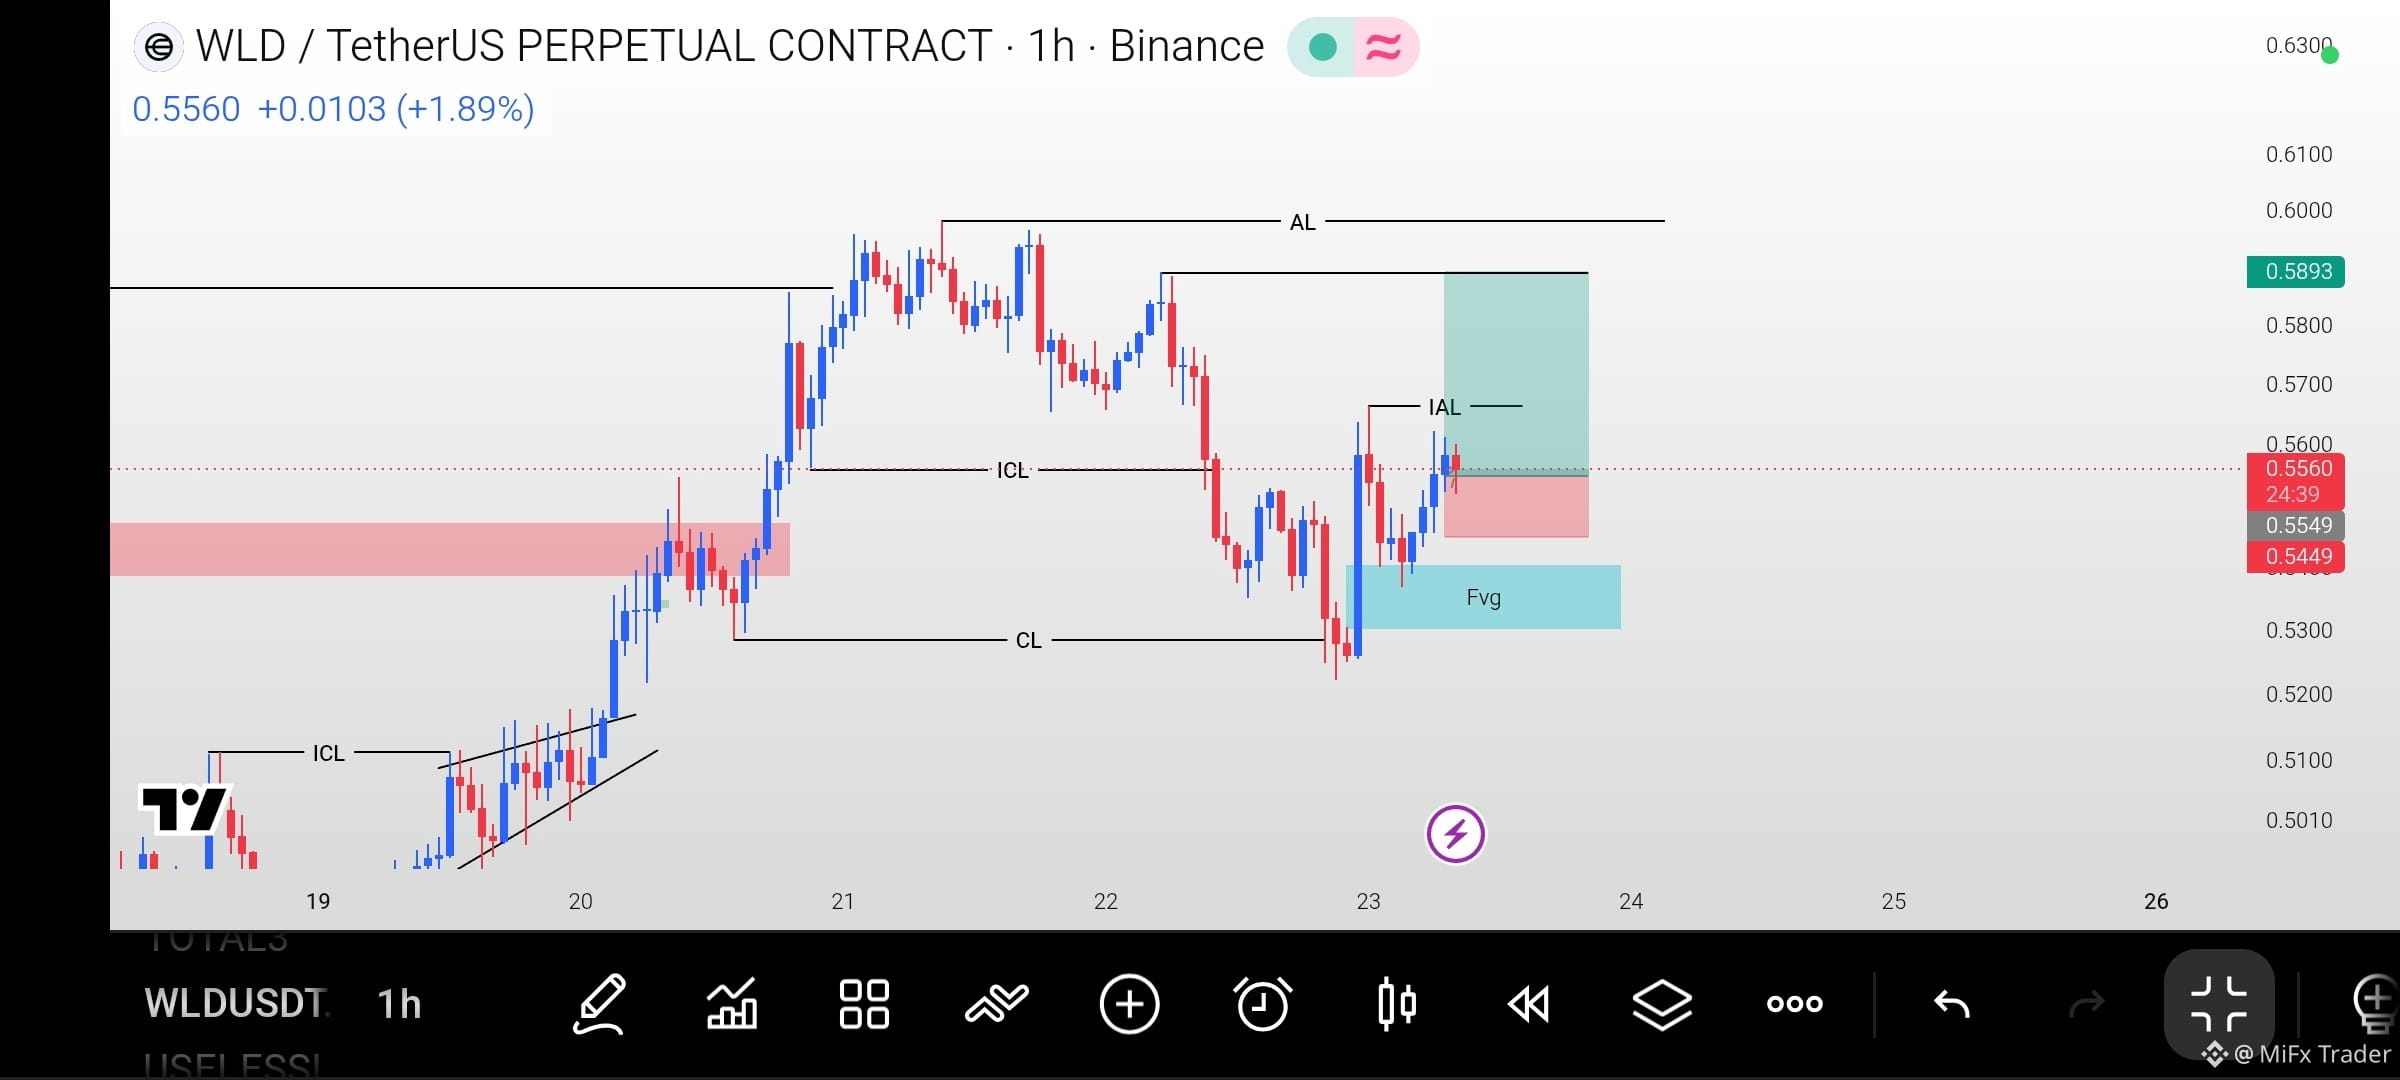
$WLD Long setup
Entry ( 0.5520 - 0.5545 )
SL ( 0.5445 )
TARGETS 🎯
0.5590
0.5640
0.5700
0.5750
0.5800
0.5850
Note: Use small margin to avoid big loss in case of SL.
#MiFxTrader
$WLD Long setup
Entry ( 0.5520 - 0.5545 )
SL ( 0.5445 )
TARGETS 🎯
0.5590
0.5640
0.5700
0.5750
0.5800
0.5850
Note: Use small margin to avoid big loss in case of SL.
#MiFxTrader
Entry ( 0.5520 - 0.5545 )
SL ( 0.5445 )
TARGETS 🎯
0.5590
0.5640
0.5700
0.5750
0.5800
0.5850
Note: Use small margin to avoid big loss in case of SL.
#MiFxTrader
1
574
·
--
Падение
$BTC
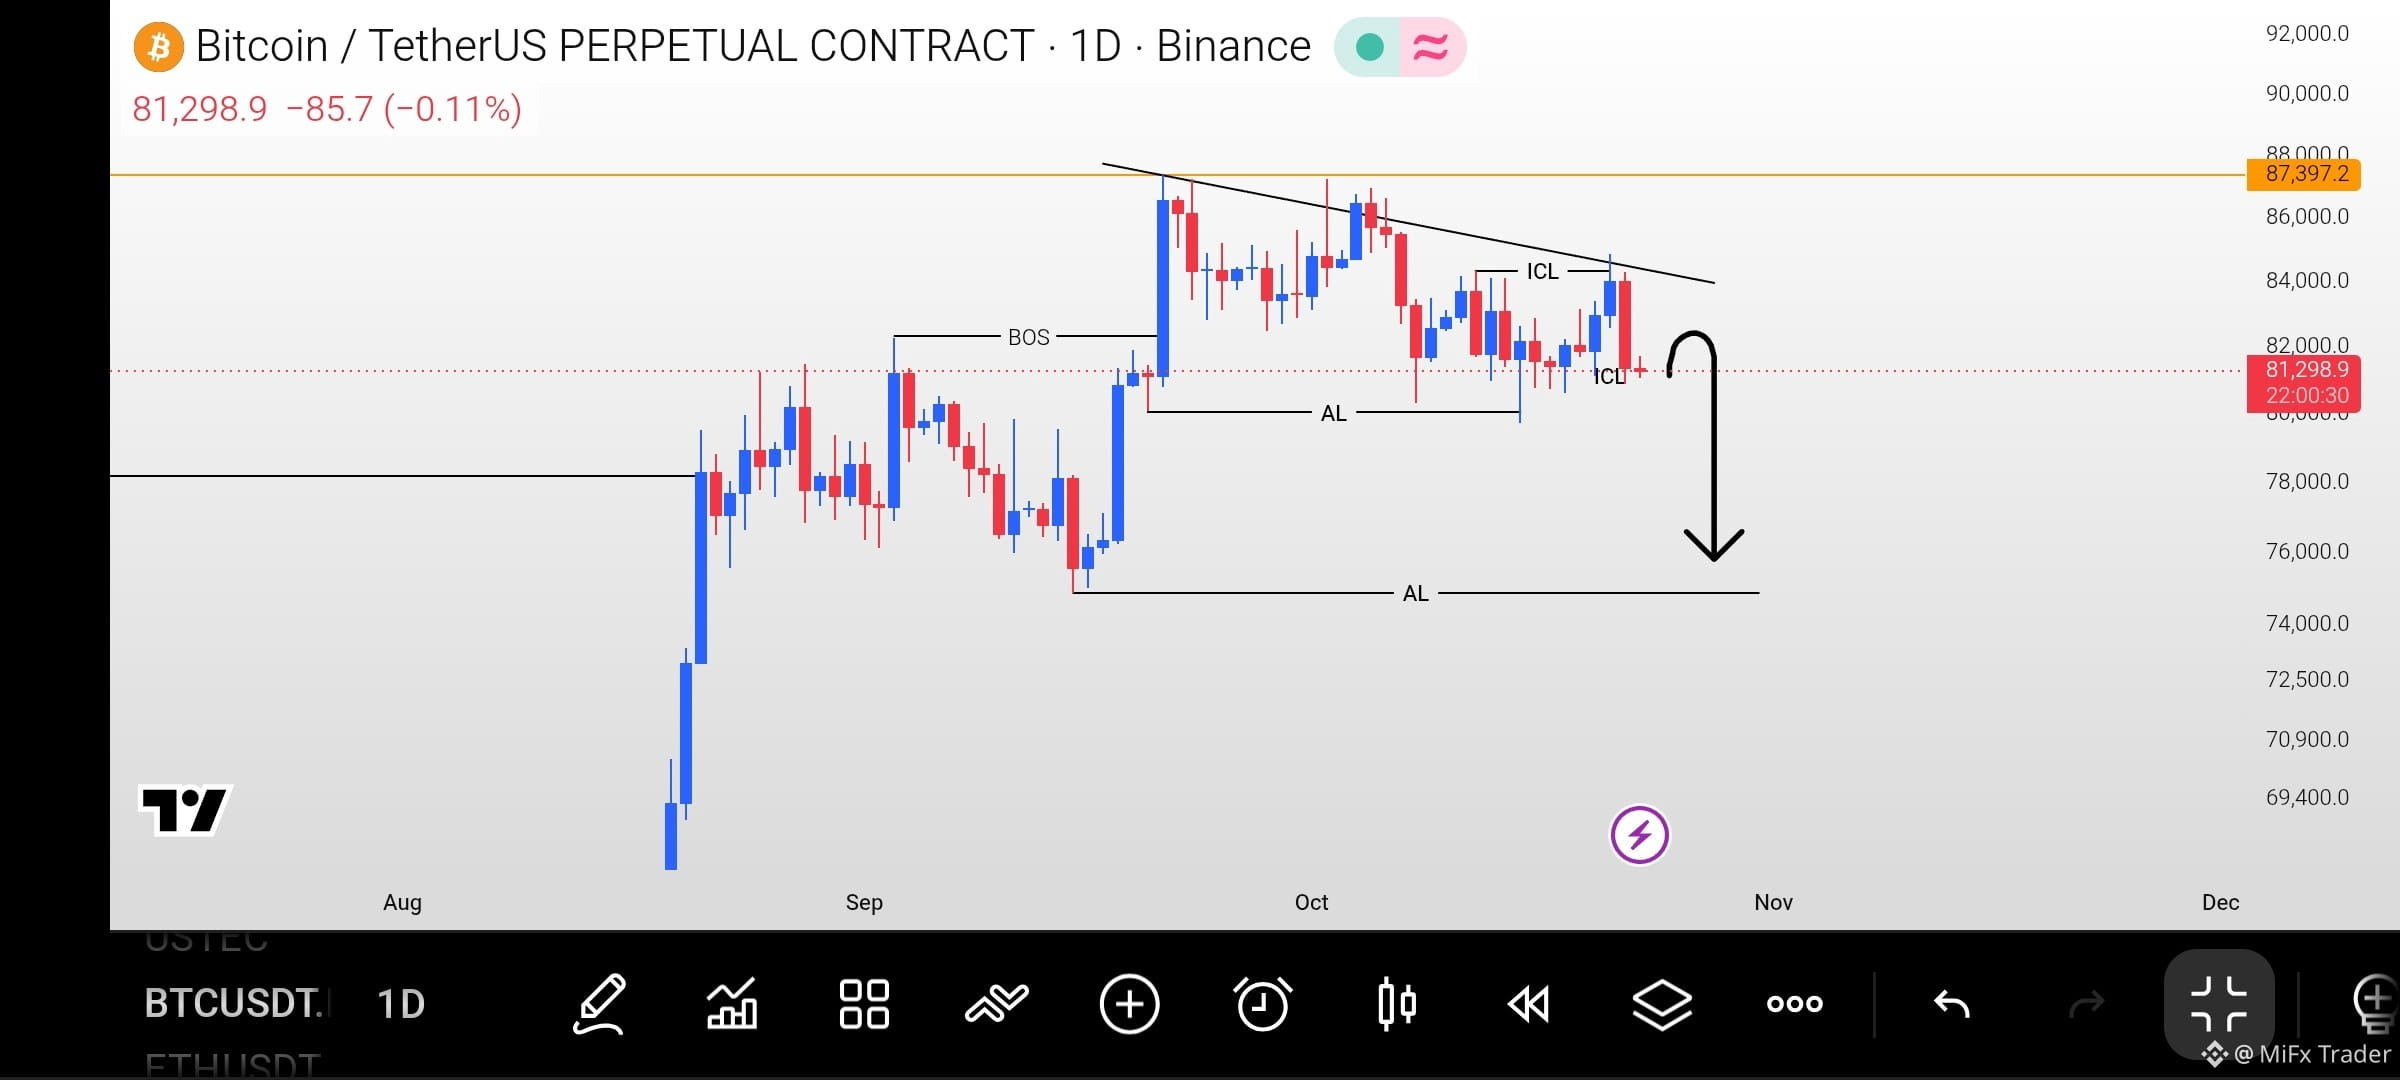
BTC DETAILED UPDATE
On the 1D chart, BTC had been consistently bullish and had not broken any major low to confirm a structural shift. However, last week, it wicked below a major low, potentially signaling a reversal, and then broke a recent internal high.
This suggested that BTC might continue its bullish momentum. However, BTC swept that same internal high and then moved back down, wicking below two strong 1D engulfing candles. This is a potential sign of a market structure shift (MSS).
Currently, BTC is moving to the downside in a bearish pattern. A confirmed downside breakout could potentially push BTC toward the $75K–$76K zone.
Before that, a normal recovery toward $82.6K is possible. However, BTC must remain below $84.4K for the bearish outlook to remain valid.
AS PER MY ANALYSIS: Avoid building long positions on BTC for now and look for potential short opportunities.
$BTC
{future}(BTCUSDT)
#MiFxTrader
$BTC
BTC DETAILED UPDATE
On the 1D chart, BTC had been consistently bullish and had not broken any major low to confirm a structural shift. However, last week, it wicked below a major low, potentially signaling a reversal, and then broke a recent internal high.
This suggested that BTC might continue its bullish momentum. However, BTC swept that same internal high and then moved back down, wicking below two strong 1D engulfing candles. This is a potential sign of a market structure shift (MSS).
Currently, BTC is moving to the downside in a bearish pattern. A confirmed downside breakout could potentially push BTC toward the $75K–$76K zone.
Before that, a normal recovery toward $82.6K is possible. However, BTC must remain below $84.4K for the bearish outlook to remain valid.
AS PER MY ANALYSIS: Avoid building long positions on BTC for now and look for potential short opportunities.
$BTC
#MiFxTrader
1
1.2k
·
--
Рост
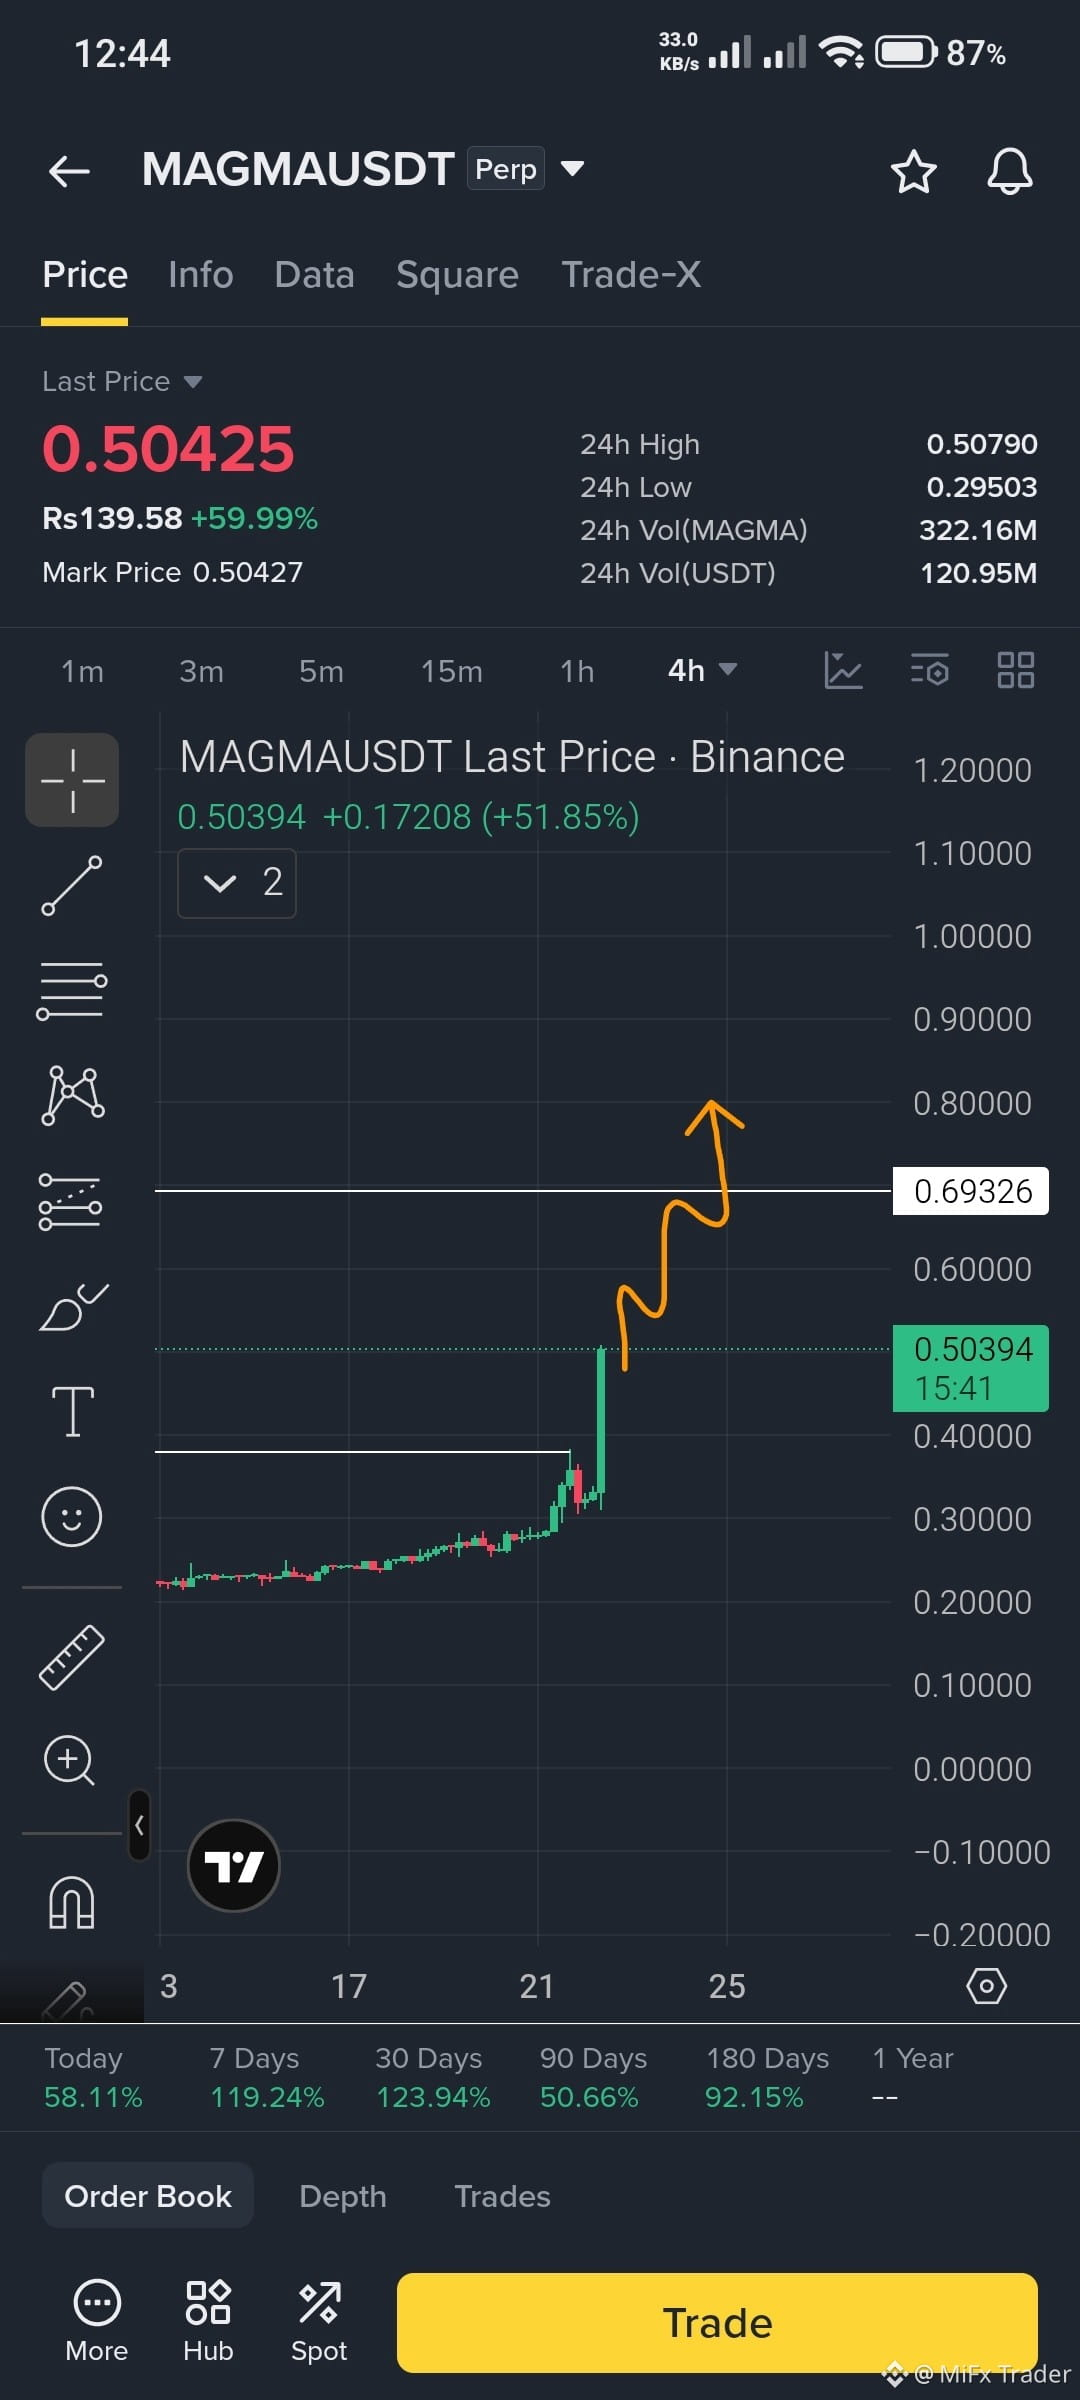
$MAGMA Heading towards the 1D high following the strong bullish trend , possibly it will hit 0.6900 soon.
while at the moment I do not suggest to make any long entry , just watch it and wait to open short when it hits ( 0.6900 )
#MiFxTrader
$MAGMA Heading towards the 1D high following the strong bullish trend , possibly it will hit 0.6900 soon.
while at the moment I do not suggest to make any long entry , just watch it and wait to open short when it hits ( 0.6900 )
#MiFxTrader
while at the moment I do not suggest to make any long entry , just watch it and wait to open short when it hits ( 0.6900 )
#MiFxTrader
499
·
--
Рост
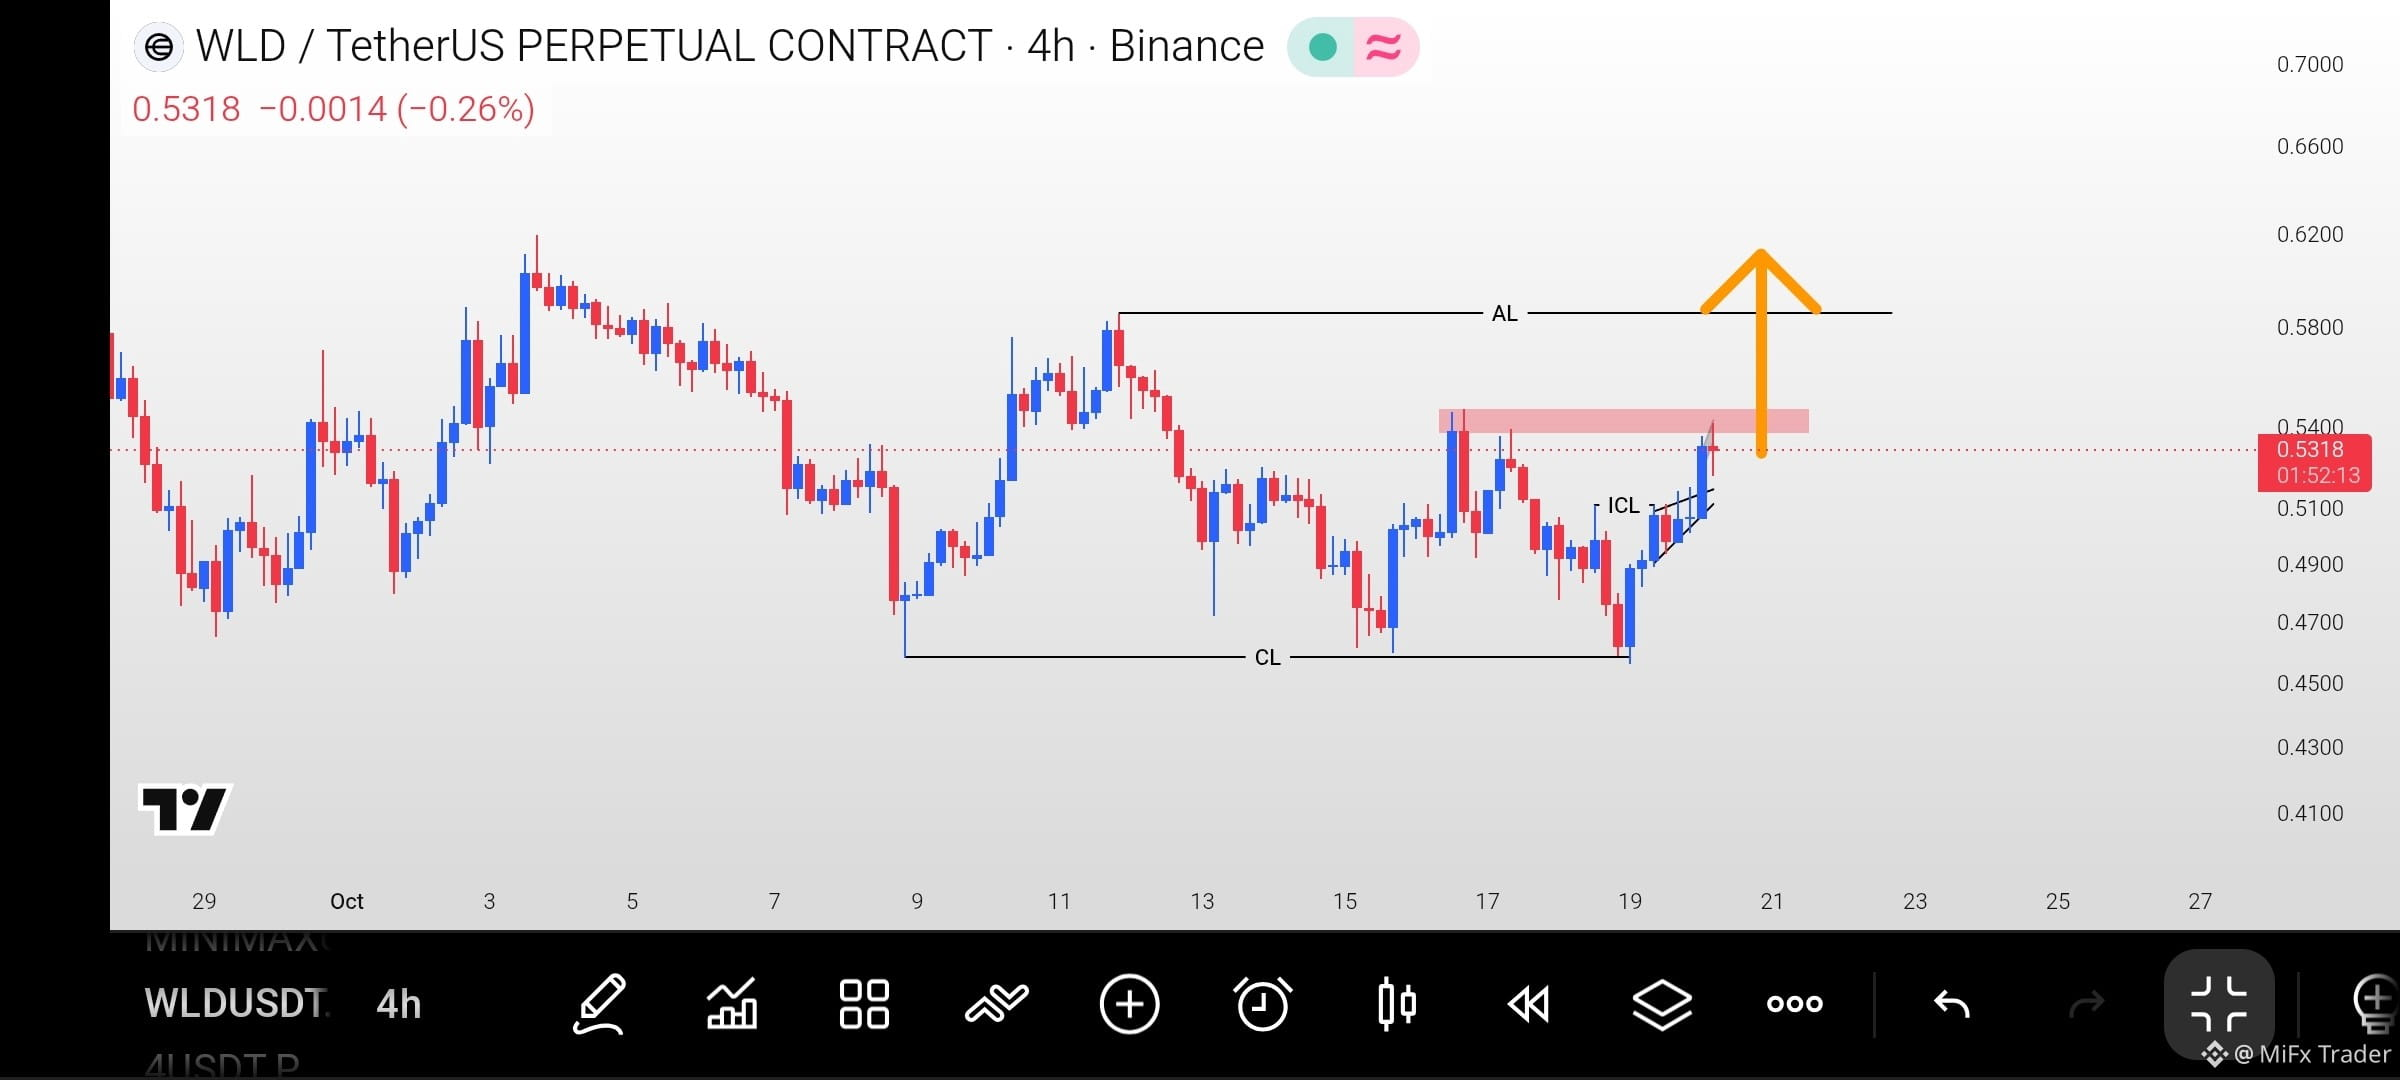
$WLD Long Signal 🚀🚀🚀
$WLD started rising by taking out 4h long liquidity and also taking internal short liquidity and moving higher with strong bullish trend.
But currently trading at the 4h resistance which is most important resistance to break , once this break , $WLD will hit ( 0.5800 ) for sure.
I'm looking long on market price with a sto loss of ( 0.5200 )
#MiFxTrader
606
·
--
Падение
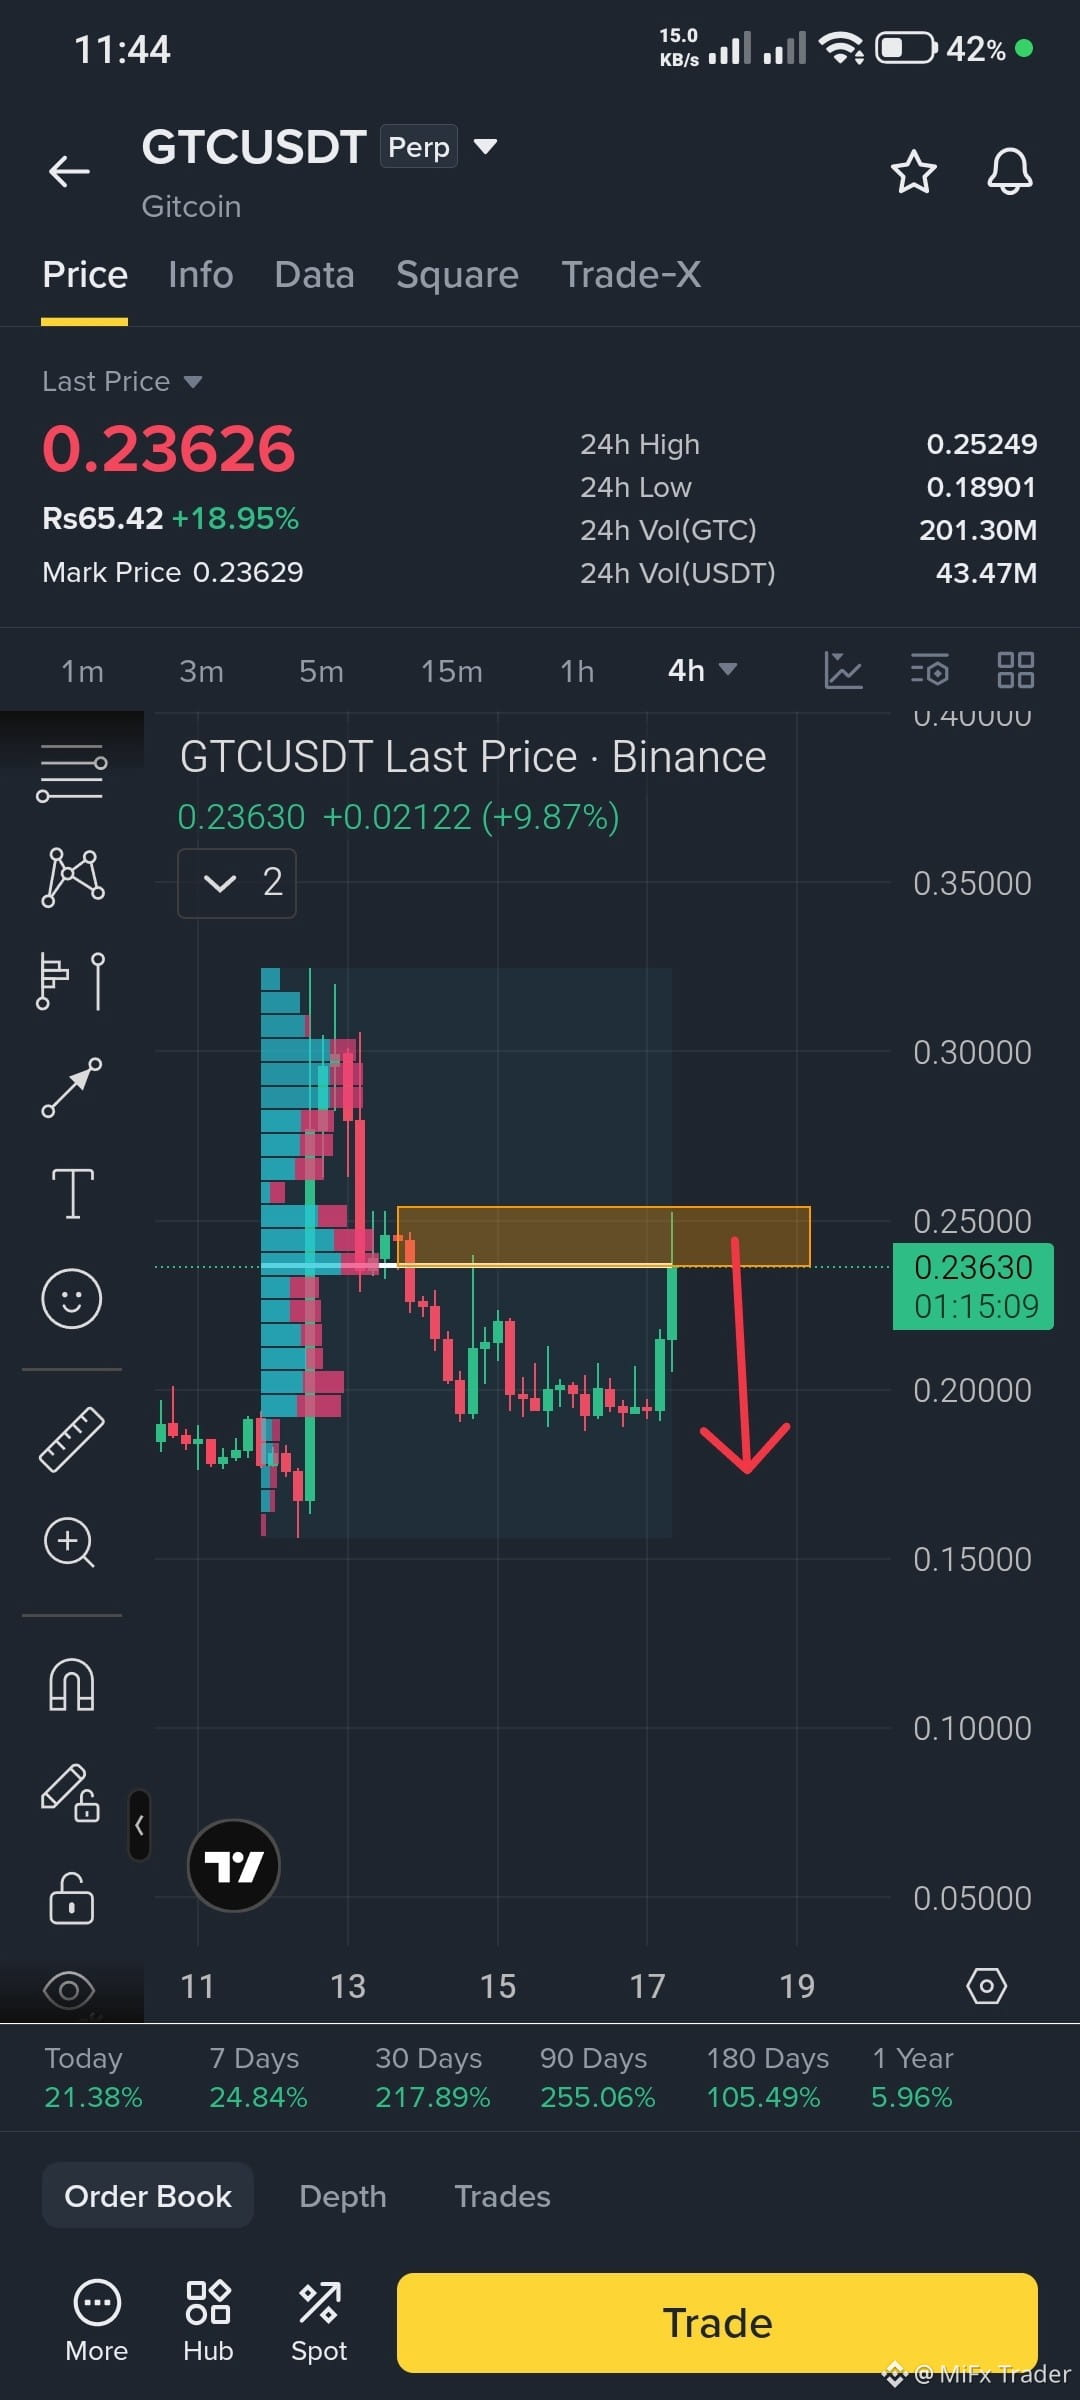
$GTC better to look for SHORT opportunities in this coin , it's exactly trading at POC level of Volume Profile which tells the maximum orders orders was filled on this price level so again GTC is here , Expectations are down...
$GTC
#MiFxTrader
$GTC better to look for SHORT opportunities in this coin , it's exactly trading at POC level of Volume Profile which tells the maximum orders orders was filled on this price level so again GTC is here , Expectations are down...
$GTC
#MiFxTrader
$GTC
#MiFxTrader
510
·
--
Рост
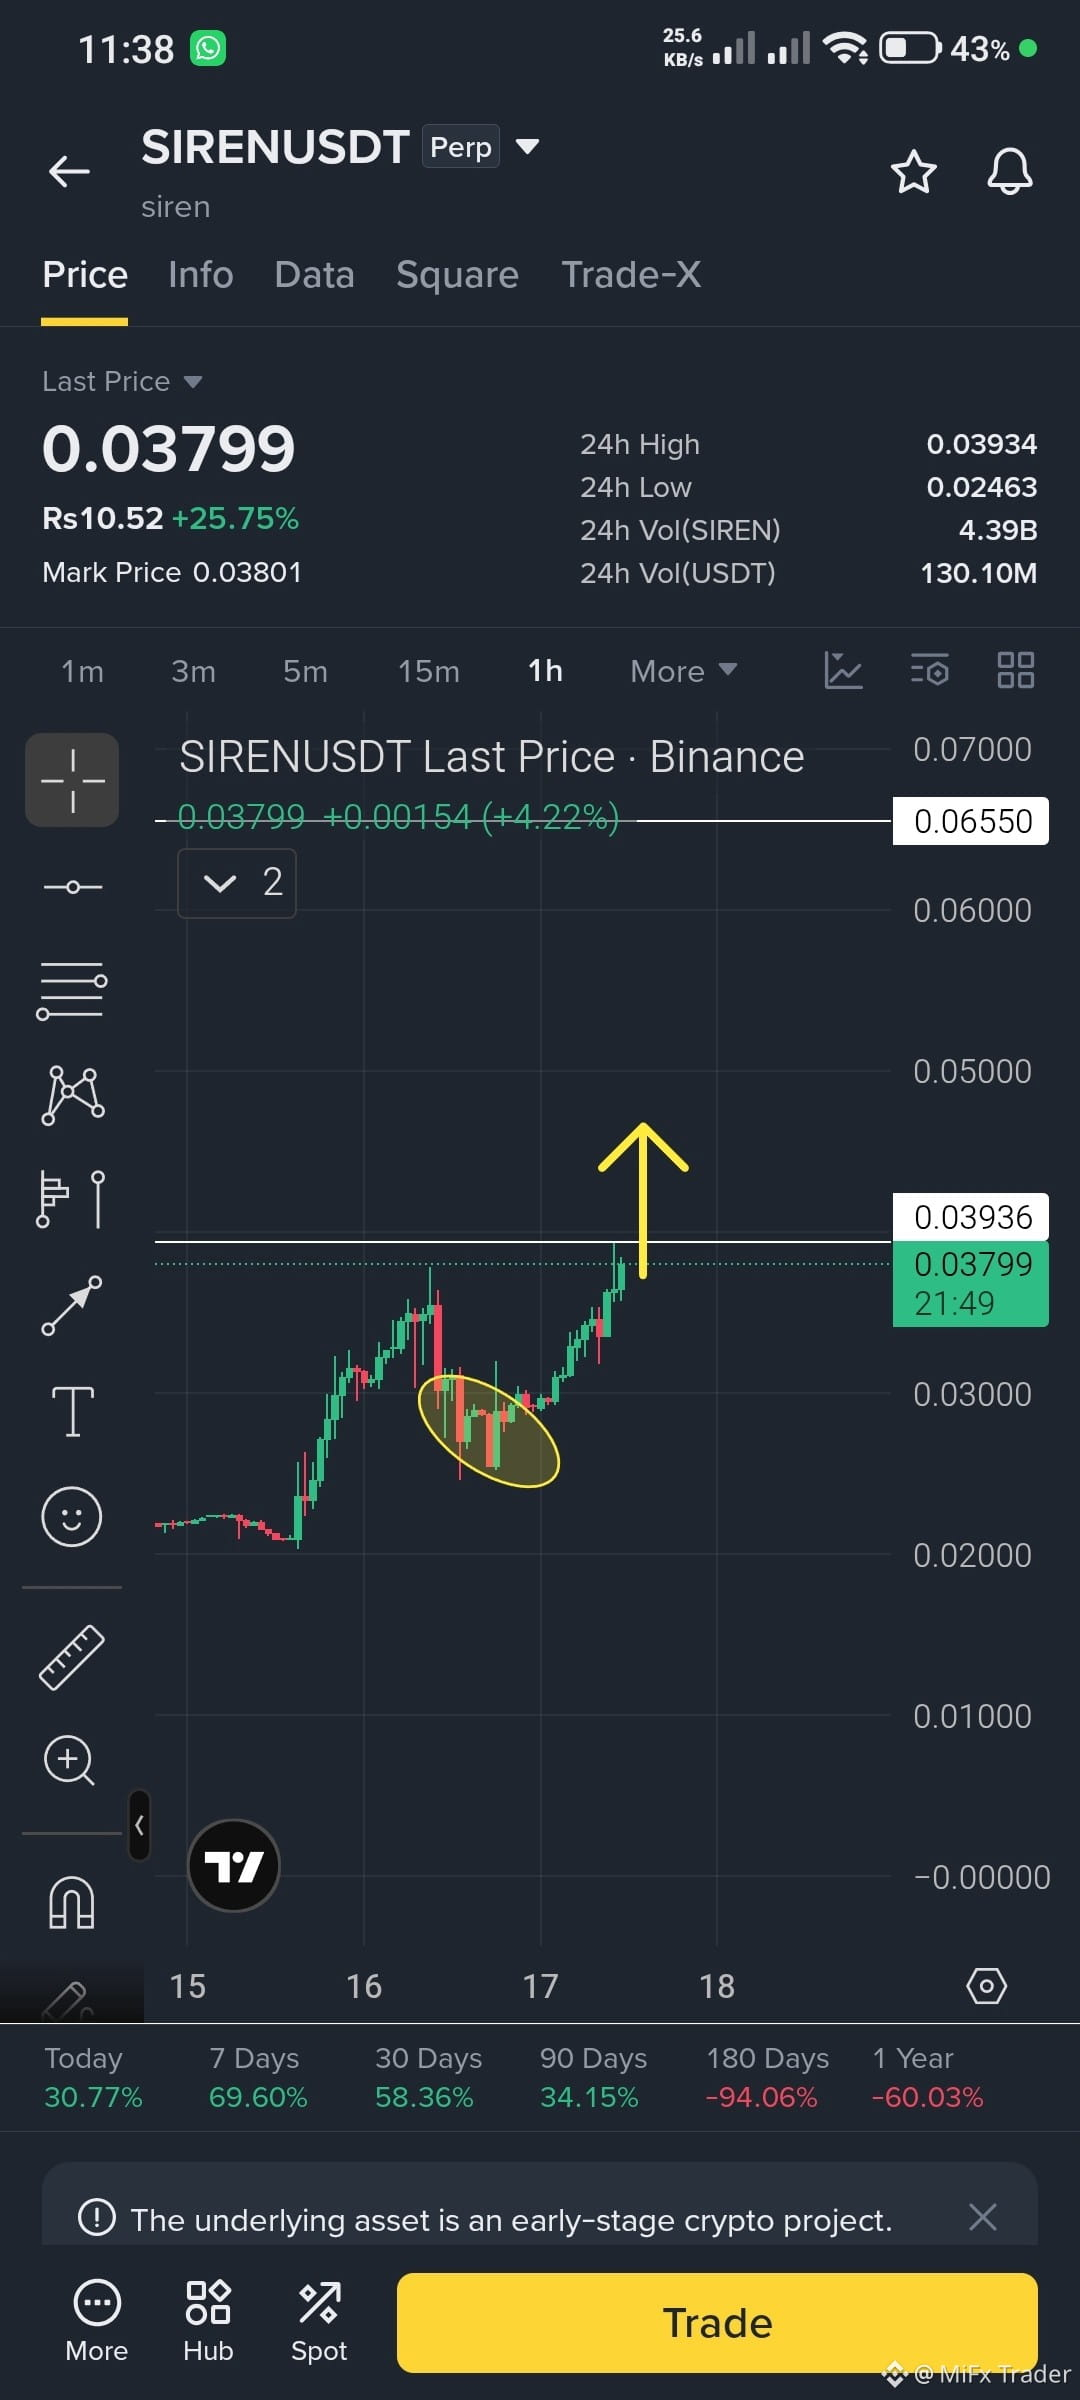
$SIREN Rising from the bottom and the current structure is reached to the most recent high where it is now consolidating but the strength in the candles and volume is high...
Following the trend , $SIREN will breakout this resistance soon and will reach 0.45, 0.50 and 0.60.
#MiFxTrader
$SIREN Rising from the bottom and the current structure is reached to the most recent high where it is now consolidating but the strength in the candles and volume is high...
Following the trend , $SIREN will breakout this resistance soon and will reach 0.45, 0.50 and 0.60.
#MiFxTrader
Following the trend , $SIREN will breakout this resistance soon and will reach 0.45, 0.50 and 0.60.
#MiFxTrader
1
2
937
Войдите, чтобы посмотреть больше материала
Присоединяйтесь к пользователям криптовалют по всему миру на Binance Square
⚡️ Получайте новейшую и полезную информацию о криптоактивах.
💬 Нам доверяет крупнейшая в мире криптобиржа.
👍 Получите достоверные аналитические данные от верифицированных создателей контента.
Эл. почта/номер телефона
В тренде
FedWatch
Просмотров: 16.4M
39,778 обсуждают
🚨 🇺🇸 PETER SCHIFF JUST THREW A BIG WARNING AT THE FED!
Peter Schiff is calling Kevin Warsh’s tough talk on inflation a “bluff,” and his prediction could have major implications for the markets.
Schiff believes the Fed could eventually return to money printing through quantitative easing (QE) and even cut interest rates next year, despite inflation continuing to rise.
Think about that for a moment.
🔥 Inflation could remain a problem. 🔥 The Fed could still move toward easier monetary policy. 🔥 More liquidity could flow into financial markets.
If this scenario plays out, it could create a very different market environment for stocks, gold, Bitcoin, and the wider crypto market.
But there’s a catch: if inflation stays high, the Fed could face a difficult choice between fighting rising prices and supporting the economy.
Will Warsh stick to a tough inflation policy, or will the Fed eventually change direction?
The next move could matter a lot for investors.
#FedWatch #EarningsSeason #USMidtermElections #BrazilCryptoExchangesMustApplyForLicensesByFriday #StanDruckenmillerBecomesInvestorInTradeXYZ
Jackson Liam
·Лайков: 4
·Просмотров: 8.9k
EarningsSeason
Просмотров: 6.5M
32,475 обсуждают
USMidtermElections
Просмотров: 64,496
807 обсуждают