

CryptoTradeMask
10k Публикации
CryptoTradeMask
Отправить жалобу
Заблокировать пользователя
Cryptocurrency market news, financial reviews, courses and training, all about cryptocurrencies and blockchain | 📊Technical analyses, Trading Strategy | 🦈
Открытая сделка
Трейдер с регулярными сделками
8.4 г
234 подписок(и/а)
1.8K+ подписчиков(а)
12.3K+ понравилось
Посты
Портфель
Все
Цитирования
Видео
PINNED
Статья
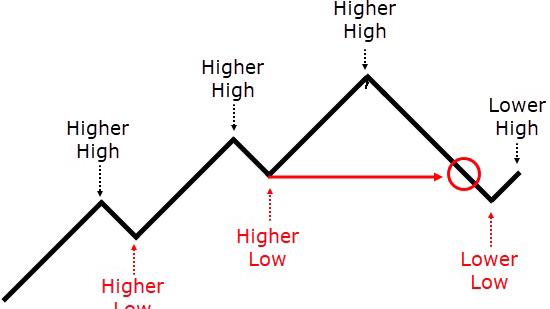
📊MSB: Точка неповернення або як розпізнати розворот тренду📉Злам структури ринку (MSB — Market Structure Break) — це один із найважливіших сигналів у Smart Money Concepts (SMC). Він вказує на те, що домінуюча сила на ринку (покупці або продавці) втратила контроль, і ціна готується до розвороту.
Ось детальний розбір того, як працює MSB, як його ідентифікувати та як налаштувати логіку для індикатора.
{future}(BNBUSDT)
1. Що таке структура ринку?
Перед тим як шукати злам, потрібно розуміти саму структуру. Ринок рухається циклами:
• Бичачий тренд (Bullish): Ціна формує послідовність вищих максимумів (HH — Higher High) та вищих мінімумів (HL — Higher Low).
• Ведмежий тренд (Bearish): Ціна формує нижчі максимуми (LH — Lower High) та нижчі мінімуми (LL — Lower Low).
{future}(DOGEUSDT)
2. Механіка зламу структури (MSB)
MSB відбувається тоді, коли ціна порушує "правило" поточного тренду.
Ведмежий MSB (Зміна на продаж)
Коли ринок перебуває в бичачому тренді, ключовою точкою є останній Higher Low (HL). Це рівень, який підтримував ріст.
• Сигнал: Ціна агресивно пробиває останній HL і закріплюється нижче нього.
• Результат: Структура зламана. Тепер ми очікуємо формування Lower High (LH) і продовження падіння.
Бичачий MSB (Зміна на купівлю)
У ведмежому тренді важливою точкою є останній Lower High (LH).
• Сигнал: Ціна пробиває останній LH і закріплюється вище.
• Результат: Тренд змінився на висхідний. Очікуємо формування Higher Low (HL) для входу в лонг.
{future}(WLFIUSDT)
3. MSB vs. BOS: В чому різниця?
Часто трейдери плутають MSB з BOS (Break of Structure). Хоча вони схожі, їхнє значення різне:
📊 BOS vs MSB:
BOS (Break of Structure)
• Суть: Підтвердження поточного руху.
• Напрямок: Рух за трендом.
• Логіка: Ціна оновлює свій максимум (у рості) або мінімум (у падінні).
• Сигнал: Поточна тенденція сильна, можна шукати точки входу на продовження.
• Точка пробою:
• У бичачому тренді: пробій Higher High (HH).
• У ведмежому тренді: пробій Lower Low (LL).
• Психологія: Домінування однієї сторони (покупців або продавців) триває.
MSB / CHoCH (Market Structure Break)
• Суть: Сигнал про розворот ринку.
• Напрямок: Рух проти попереднього тренду.
• Логіка: Ціна ламає останню "опору" тренду (рівень, який його тримав).
• Сигнал: Тренд зламано, очікується зміна напрямку або глибока корекція.
• Точка пробою:
• Злам на ведмежий: пробій останнього Higher Low (HL).
• Злам на бичачий: пробій останнього Lower High (LH).
• Психологія: Капітуляція сторони, що домінувала, та перехоплення ініціативи опонентами.
💡 Головна відмінність одним реченням:
BOS каже нам: "Ми йдемо далі", а MSB попереджає: "Ми розвертаємось".
🛠 Як це налаштувати в індикаторі?
Для автоматизації в коді (наприклад, Pine Script) використовується така перевірка:
1. Якщо Close > Last_High (у висхідному тренді) — це BOS.
2. Якщо Close < Last_Low (у висхідному тренді) — це MSB.
4. Як налаштувати індикатор (Логіка Pine Script або TradingView)
Якщо ви використовуєте готові індикатори (наприклад, "Smart Money Concepts" від LuxAlgo) або пишете свій, логіка має бути наступною:
Алгоритм ідентифікації:
1. Визначення свінг-точок: Індикатор має знайти останній локальний мінімум (для лонга) або максимум (для шорта).
2. Умова пробою:
• Для Bearish MSB: Close < Last_Higher_Low.
• Важливо: Бажано, щоб пробій відбувся саме тілом свічки, а не просто тінню (фітилем). Пробій тінню часто є просто зняттям ліквідності (Liquidity Sweep).
3. Візуалізація:
• Лінія на рівні пробою.
• Текстова мітка "MSB" або "CHoCH" (Change of Character).
❗️ Порада: Використовуйте старші таймфрейми (H1, H4, D1) для визначення основного MSB. Злам на 1-хвилинному графіку може бути лише шумом у межах більшого руху.❗️
5. Як торгувати після MSB?
Не варто входити в угоду відразу після пробою. Ринок часто робить ретест.
1. Чекаємо MSB: Ціна оновила попередній мінімум.
2. Повернення (Retracement): Ціна повертається вгору до зони супротиву (Order Block або FVG — Fair Value Gap).
3. Вхід: Відкриваємо позицію (наприклад, шорт) від Order Block, який сформувався перед зламом.
4. [Стоп-лосс](https://app.binance.com/uni-qr/cart/34489046348682?r=ho8lubrb&l=uk-ua&uco=5vkgl9tq36cfnvkodfwkkw&uc=app_square_share_link&us=copylink): За новий сформований максимум.
[📊Order Block & Breaker Block: Робота з зонами, де великий гравець залишив свої гроші.](https://app.binance.com/uni-qr/cart/35065149580346?r=ho8lubrb&l=uk-ua&uco=5vkgl9tq36cfnvkodfwkkw&uc=app_square_share_link&us=copylink)
📊MSB: Точка неповернення або як розпізнати розворот тренду📉
Злам структури ринку (MSB — Market Structure Break) — це один із найважливіших сигналів у Smart Money Concepts (SMC). Він вказує на те, що домінуюча сила на ринку (покупці або продавці) втратила контроль, і ціна готується до розвороту.
Ось детальний розбір того, як працює MSB, як його ідентифікувати та як налаштувати логіку для індикатора.
1. Що таке структура ринку?
Перед тим як шукати злам, потрібно розуміти саму структуру. Ринок рухається циклами:
• Бичачий тренд (Bullish): Ціна формує послідовність вищих максимумів (HH — Higher High) та вищих мінімумів (HL — Higher Low).
• Ведмежий тренд (Bearish): Ціна формує нижчі максимуми (LH — Lower High) та нижчі мінімуми (LL — Lower Low).
2. Механіка зламу структури (MSB)
MSB відбувається тоді, коли ціна порушує "правило" поточного тренду.
Ведмежий MSB (Зміна на продаж)
Коли ринок перебуває в бичачому тренді, ключовою точкою є останній Higher Low (HL). Це рівень, який підтримував ріст.
• Сигнал: Ціна агресивно пробиває останній HL і закріплюється нижче нього.
• Результат: Структура зламана. Тепер ми очікуємо формування Lower High (LH) і продовження падіння.
Бичачий MSB (Зміна на купівлю)
У ведмежому тренді важливою точкою є останній Lower High (LH).
• Сигнал: Ціна пробиває останній LH і закріплюється вище.
• Результат: Тренд змінився на висхідний. Очікуємо формування Higher Low (HL) для входу в лонг.
3. MSB vs. BOS: В чому різниця?
Часто трейдери плутають MSB з BOS (Break of Structure). Хоча вони схожі, їхнє значення різне:
📊 BOS vs MSB:
BOS (Break of Structure)
• Суть: Підтвердження поточного руху.
• Напрямок: Рух за трендом.
• Логіка: Ціна оновлює свій максимум (у рості) або мінімум (у падінні).
• Сигнал: Поточна тенденція сильна, можна шукати точки входу на продовження.
• Точка пробою:
• У бичачому тренді: пробій Higher High (HH).
• У ведмежому тренді: пробій Lower Low (LL).
• Психологія: Домінування однієї сторони (покупців або продавців) триває.
MSB / CHoCH (Market Structure Break)
• Суть: Сигнал про розворот ринку.
• Напрямок: Рух проти попереднього тренду.
• Логіка: Ціна ламає останню "опору" тренду (рівень, який його тримав).
• Сигнал: Тренд зламано, очікується зміна напрямку або глибока корекція.
• Точка пробою:
• Злам на ведмежий: пробій останнього Higher Low (HL).
• Злам на бичачий: пробій останнього Lower High (LH).
• Психологія: Капітуляція сторони, що домінувала, та перехоплення ініціативи опонентами.
💡 Головна відмінність одним реченням:
BOS каже нам: "Ми йдемо далі", а MSB попереджає: "Ми розвертаємось".
🛠 Як це налаштувати в індикаторі?
Для автоматизації в коді (наприклад, Pine Script) використовується така перевірка:
1. Якщо Close > Last_High (у висхідному тренді) — це BOS.
2. Якщо Close < Last_Low (у висхідному тренді) — це MSB.
4. Як налаштувати індикатор (Логіка Pine Script або TradingView)
Якщо ви використовуєте готові індикатори (наприклад, "Smart Money Concepts" від LuxAlgo) або пишете свій, логіка має бути наступною:
Алгоритм ідентифікації:
1. Визначення свінг-точок: Індикатор має знайти останній локальний мінімум (для лонга) або максимум (для шорта).
2. Умова пробою:
• Для Bearish MSB: Close < Last_Higher_Low.
• Важливо: Бажано, щоб пробій відбувся саме тілом свічки, а не просто тінню (фітилем). Пробій тінню часто є просто зняттям ліквідності (Liquidity Sweep).
3. Візуалізація:
• Лінія на рівні пробою.
• Текстова мітка "MSB" або "CHoCH" (Change of Character).
❗️ Порада: Використовуйте старші таймфрейми (H1, H4, D1) для визначення основного MSB. Злам на 1-хвилинному графіку може бути лише шумом у межах більшого руху.❗️
5. Як торгувати після MSB?
Не варто входити в угоду відразу після пробою. Ринок часто робить ретест.
1. Чекаємо MSB: Ціна оновила попередній мінімум.
2. Повернення (Retracement): Ціна повертається вгору до зони супротиву (Order Block або FVG — Fair Value Gap).
3. Вхід: Відкриваємо позицію (наприклад, шорт) від Order Block, який сформувався перед зламом.
4. Стоп-лосс: За новий сформований максимум.
📊Order Block & Breaker Block: Робота з зонами, де великий гравець залишив свої гроші.
2
8
180
PINNED
Статья
📖Енциклопедія сучасного трейдингу: Від концепцій Smart Money до квантових алгоритмів📊Трейдинг — це не просто купівля та продаж. Це інтелектуальна війна, де кожен учасник використовує свою зброю: від класичної геометрії до штучного інтелекту. У цій статті ми розберемо повну карту методів, які формують фінансові ринки.
{future}(BNBUSDT)
🧠 I. КОНЦЕПТУАЛЬНІ МЕТОДИ: Як мислять професіонали
Ці методи шукають відповідь на питання «Чому ціна рухається?», фокусуючись на діях великих гравців.
1.[Метод Річарда Вайкоффа (Wyckoff)](https://app.binance.com/uni-qr/cart/33052504968874?r=ho8lubrb&l=uk-ua&uco=5vkgl9tq36cfnvkodfwkkw&uc=app_square_share_link&us=copylink)
Фундамент, створений на початку XX століття. Головна ідея — ринком керує "Composite Man"(комбінований гравець).
•[Цикли](https://app.binance.com/uni-qr/cart/34776042391217?r=ho8lubrb&l=uk-ua&uco=5vkgl9tq36cfnvkodfwkkw&uc=app_square_share_link&us=copylink): Накопичення ([Accumulation](https://app.binance.com/uni-qr/cart/34776042391217?r=ho8lubrb&l=uk-ua&uco=5vkgl9tq36cfnvkodfwkkw&uc=app_square_share_link&us=copylink)) та Розподіл ([Distribution](https://app.binance.com/uni-qr/cart/34776042391217?r=ho8lubrb&l=uk-ua&uco=5vkgl9tq36cfnvkodfwkkw&uc=app_square_share_link&us=copylink)).
•[Маніпуляції](https://app.binance.com/uni-qr/cart/35211576377570?r=ho8lubrb&l=uk-ua&uco=5vkgl9tq36cfnvkodfwkkw&uc=app_square_share_link&us=copylink): [Spring](https://app.binance.com/uni-qr/cart/35211576377570?r=ho8lubrb&l=uk-ua&uco=5vkgl9tq36cfnvkodfwkkw&uc=app_square_share_link&us=copylink) (пастка для продавців) та [Upthrust](https://app.binance.com/uni-qr/cart/35211576377570?r=ho8lubrb&l=uk-ua&uco=5vkgl9tq36cfnvkodfwkkw&uc=app_square_share_link&us=copylink) (пастка для покупців).
• Закони: Зусилля проти результату ([об'єм проти руху ціни](https://app.binance.com/uni-qr/cart/35260490659098?r=ho8lubrb&l=uk-ua&uco=5vkgl9tq36cfnvkodfwkkw&uc=app_square_share_link&us=copylink)).
2.[Smart Money Concepts (SMC)](https://app.binance.com/uni-qr/cart/34906072854242?r=ho8lubrb&l=uk-ua&uco=5vkgl9tq36cfnvkodfwkkw&uc=app_square_share_link&us=copylink)
Еволюція Вайкоффа. Базується на тому, що маркетмейкери маніпулюють ціною для збору ліквідності.
•[BOS (Break of Structure)](https://app.binance.com/uni-qr/cart/34759737443497?r=ho8lubrb&l=uk-ua&uco=5vkgl9tq36cfnvkodfwkkw&uc=app_square_share_link&us=copylink): Підтвердження тренду.
•[CHoCH (Change of Character)](https://app.binance.com/uni-qr/cart/34946529719578?r=ho8lubrb&l=uk-ua&uco=5vkgl9tq36cfnvkodfwkkw&uc=app_square_share_link&us=copylink): Перший сигнал зміни тренду.
•[Order Blocks](https://app.binance.com/uni-qr/cart/35065149580346?r=ho8lubrb&l=uk-ua&uco=5vkgl9tq36cfnvkodfwkkw&uc=app_square_share_link&us=copylink): Зони, де великий гравець відкривав позицію.
3.[ICT (Inner Circle Trader)](https://app.binance.com/uni-qr/cart/34330913863281?r=ho8lubrb&l=uk-ua&uco=5vkgl9tq36cfnvkodfwkkw&uc=app_square_share_link&us=copylink)
Авторська методика Майкла Хаддлстона.
•[Fair Value Gaps (FVG)](https://app.binance.com/uni-qr/cart/35073398985841?r=ho8lubrb&l=uk-ua&uco=5vkgl9tq36cfnvkodfwkkw&uc=app_square_share_link&us=copylink): Цінові дисбаланси.
•[Power of 3](https://app.binance.com/uni-qr/cart/35261234104946?r=ho8lubrb&l=uk-ua&uco=5vkgl9tq36cfnvkodfwkkw&uc=app_square_share_link&us=copylink): Маніпулятивний цикл (Accumulation, Manipulation, Distribution).
•[Kill Zones](https://app.binance.com/uni-qr/cart/35285926861481?r=ho8lubrb&l=uk-ua&uco=5vkgl9tq36cfnvkodfwkkw&uc=app_square_share_link&us=copylink): Конкретні часові проміжки для торгівлі.
4.[Об'ємний аналіз (Market/Volume Profile)](https://app.binance.com/uni-qr/cart/34731017821521?r=ho8lubrb&l=uk-ua&uco=5vkgl9tq36cfnvkodfwkkw&uc=app_square_share_link&us=copylink)
Використання POC (Point of Control — ціна з найбільшим об'ємом), HVN та LVN (вузли високого та низького об'єму) для пошуку справжньої вартості активу.
{future}(ETHUSDT)
📊[II. PRICE ACTION: Мистецтво чистого графіка](https://app.binance.com/uni-qr/cart/33625026050329?r=ho8lubrb&l=uk-ua&uco=5vkgl9tq36cfnvkodfwkkw&uc=app_square_share_link&us=copylink)
Торгівля без запізнілих індикаторів, заснована на русі самої ціни.
• Класика: [Підтримка/Опір](https://app.binance.com/uni-qr/cart/33052024321874?r=ho8lubrb&l=uk-ua&uco=5vkgl9tq36cfnvkodfwkkw&uc=app_square_share_link&us=copylink), максимуми та мінімуми ([HH, HL](https://app.binance.com/uni-qr/cart/34805372163354?r=ho8lubrb&l=uk-ua&uco=5vkgl9tq36cfnvkodfwkkw&uc=app_square_share_link&us=copylink)).
•[Свічкові патерни](https://app.binance.com/uni-qr/cart/34851200685737?r=ho8lubrb&l=uk-ua&uco=5vkgl9tq36cfnvkodfwkkw&uc=app_square_share_link&us=copylink): [Pin Bar](https://app.binance.com/uni-qr/cart/34244608216122?r=ho8lubrb&l=uk-ua&uco=5vkgl9tq36cfnvkodfwkkw&uc=app_square_share_link&us=copylink) (відмова), [Engulfing](https://app.binance.com/uni-qr/cart/34820951330362?r=ho8lubrb&l=uk-ua&uco=5vkgl9tq36cfnvkodfwkkw&uc=app_square_share_link&us=copylink) (поглинання), [Doji](https://app.binance.com/uni-qr/cart/34311888883081?r=ho8lubrb&l=uk-ua&uco=5vkgl9tq36cfnvkodfwkkw&uc=app_square_share_link&us=copylink) (невизначеність), Inside Bar.
•[Supply & Demand](https://app.binance.com/uni-qr/cart/35286947795569?r=ho8lubrb&l=uk-ua&uco=5vkgl9tq36cfnvkodfwkkw&uc=app_square_share_link&us=copylink): Пошук зон, де пропозиція перевищує попит, і навпаки.
{future}(XRPUSDT)
‼️[💎 CryptoTradeMask: Торгуй не картинки, а логіку ринку](https://app.binance.com/uni-qr/cart/35195268158689?r=ho8lubrb&l=uk-ua&uco=5vkgl9tq36cfnvkodfwkkw&uc=app_square_share_link&us=copylink)‼️
📈 III. ТРЕНДОВІ ТА ПРОБІЙНІ СТРАТЕГІЇ
Спроба «осідлати» інерцію ринку.
•[Trend Following](https://app.binance.com/uni-qr/cart/34675135210777?r=ho8lubrb&l=uk-ua&uco=5vkgl9tq36cfnvkodfwkkw&uc=app_square_share_link&us=copylink): Купівля на зростанні, продаж на падінні.
•[Moving Averages](https://app.binance.com/uni-qr/cart/34688240803777?r=ho8lubrb&l=uk-ua&uco=5vkgl9tq36cfnvkodfwkkw&uc=app_square_share_link&us=copylink): Використання EMA 20/50/200 та перетинів («Золотий хрест»).
•[Breakout Trading](https://app.binance.com/uni-qr/cart/35153945859697?r=ho8lubrb&l=uk-ua&uco=5vkgl9tq36cfnvkodfwkkw&uc=app_square_share_link&us=copylink): Торгівля на пробій рівнів або «стиснення» (трикутники).
•[False Breakout (Fakeout)](https://app.binance.com/uni-qr/cart/34906863271994?r=ho8lubrb&l=uk-ua&uco=5vkgl9tq36cfnvkodfwkkw&uc=app_square_share_link&us=copylink): Торгівля проти тих, хто зайшов на хибному пробої (Stop Hunt).
•[Gap Trading](https://app.binance.com/uni-qr/cart/35418149857674?r=ho8lubrb&l=uk-ua&uco=5vkgl9tq36cfnvkodfwkkw&uc=app_square_share_link&us=copylink): Робота з розривами цін (Gap & Go або закриття гепу).
🔄 IV. MEAN REVERSION: Повернення до середнього
Стратегії, що базуються на ідеї, що ціна завжди занадто сильно відхиляється від норми, але потім повертається.
•[Range Trading](https://app.binance.com/uni-qr/cart/35330261488978?r=ho8lubrb&l=uk-ua&uco=5vkgl9tq36cfnvkodfwkkw&uc=app_square_share_link&us=copylink): Торгівля в боковику від межі до межі.
•[VWAP Reversion](https://app.binance.com/uni-qr/cart/35375648792857?r=ho8lubrb&l=uk-ua&uco=5vkgl9tq36cfnvkodfwkkw&uc=app_square_share_link&us=copylink): Використання середньозваженої за об'ємом ціни як магніту.
‼️[📈 15 порад для прибуткового криптотрейдингу](https://app.binance.com/uni-qr/cart/33051084135249?r=ho8lubrb&l=uk-ua&uco=5vkgl9tq36cfnvkodfwkkw&uc=app_square_share_link&us=copylink)‼️
📐 V. ТЕХНІЧНІ ІНДИКАТОРИ ТА ФІБО-МАТЕМАТИКА
Математична обробка ціни для візуалізації сигналів.
• Осцилятори: [RSI (дивергенції)](https://app.binance.com/uni-qr/cpos/34003602691465?r=ho8lubrb&l=uk-ua&uco=5vkgl9tq36cfnvkodfwkkw&uc=app_square_share_link&us=copylink), [MACD](https://app.binance.com/uni-qr/cart/34003282689417?r=ho8lubrb&l=uk-ua&uco=5vkgl9tq36cfnvkodfwkkw&uc=app_square_share_link&us=copylink), [Stochastic](https://app.binance.com/uni-qr/cart/34626669917754?r=ho8lubrb&l=uk-ua&uco=5vkgl9tq36cfnvkodfwkkw&uc=app_square_share_link&us=copylink).
• Волатильність: [Bollinger Bands](https://app.binance.com/uni-qr/cpos/34002994577177?r=ho8lubrb&l=uk-ua&uco=5vkgl9tq36cfnvkodfwkkw&uc=app_square_share_link&us=copylink) (стиснення) та ATR (для виставлення стопів).
•[Числа Фібоначчі](https://app.binance.com/uni-qr/cart/34494463146433?r=ho8lubrb&l=uk-ua&uco=5vkgl9tq36cfnvkodfwkkw&uc=app_square_share_link&us=copylink): Рівні корекції (0.618) та розширення для визначення цілей.
🌊 VI. ХВИЛЬОВА ТЕОРІЯ ТА ГАРМОНІКА
Пошук циклічності та повторюваних геометричних структур.
•[Elliott Wave Theory](https://app.binance.com/uni-qr/cart/35338247451529?r=ho8lubrb&l=uk-ua&uco=5vkgl9tq36cfnvkodfwkkw&uc=app_square_share_link&us=copylink): Ринок рухається хвилями 1-2-3-4-5 та A-B-C.
•[Harmonic Patterns](https://app.binance.com/uni-qr/cart/35463089958001?r=ho8lubrb&l=uk-ua&uco=5vkgl9tq36cfnvkodfwkkw&uc=app_square_share_link&us=copylink): Складні фігури на основі Фібоначчі (Gartley, Bat, Butterfly).
•[Wolfe Waves](https://app.binance.com/uni-qr/cart/35425231015081?r=ho8lubrb&l=uk-ua&uco=5vkgl9tq36cfnvkodfwkkw&uc=app_square_share_link&us=copylink): П’ятихвильовий патерн для пошуку точок розвороту.
⏱️ [VII. ЧАС ТА КОНТЕКСТ (SESSIONS & MACRO)](https://app.binance.com/uni-qr/cpos/34333008184202?r=ho8lubrb&l=uk-ua&uco=5vkgl9tq36cfnvkodfwkkw&uc=app_square_share_link&us=copylink)
Ринок працює по годинах, і його настрій залежить від глобальних новин.
•[Session Trading](https://app.binance.com/uni-qr/cpos/34333008184202?r=ho8lubrb&l=uk-ua&uco=5vkgl9tq36cfnvkodfwkkw&uc=app_square_share_link&us=copylink): Розуміння особливостей Азії (флет), Лондона (тренд) та Нью-Йорка (реверс).
•[News Trading](https://app.binance.com/uni-qr/cart/35397880999081?r=ho8lubrb&l=uk-ua&uco=5vkgl9tq36cfnvkodfwkkw&uc=app_square_share_link&us=copylink): Реакція на інфляцію (CPI), безробіття (NFP) та ставки ФРС (FOMC).
•[Fundamental Analysis](https://app.binance.com/uni-qr/cart/35488091547249?r=ho8lubrb&l=uk-ua&uco=5vkgl9tq36cfnvkodfwkkw&uc=app_square_share_link&us=copylink): Оцінка макроекономіки, токеноміки (для крипто) або фінансових звітів компаній (Earnings).
‼️[🚀 Криптотрейдинг з нуля за 30 днів — покроковий план, щоб навчитися і впевнено торгувати](https://app.binance.com/uni-qr/cart/34930601182490?r=ho8lubrb&l=uk-ua&uco=5vkgl9tq36cfnvkodfwkkw&uc=app_square_share_link&us=copylink)‼️
🤖 VIII. АЛГОРИТМІЧНИЙ ТА КВАНТОВИЙ ТРЕЙДИНГ
Світ роботів та високої математики.
•[HFT (High Frequency)](https://app.binance.com/uni-qr/cart/35525682794889?r=ho8lubrb&l=uk-ua&uco=5vkgl9tq36cfnvkodfwkkw&uc=app_square_share_link&us=copylink): Торгівля з мікросекундною швидкістю.
•[Statistical Arbitrage](https://app.binance.com/uni-qr/cart/35532088894745?r=ho8lubrb&l=uk-ua&uco=5vkgl9tq36cfnvkodfwkkw&uc=app_square_share_link&us=copylink): Пошук математичних розбіжностей між активами.
•[Market Making](https://app.binance.com/uni-qr/cart/35551386418802?r=ho8lubrb&l=uk-ua&uco=5vkgl9tq36cfnvkodfwkkw&uc=app_square_share_link&us=copylink): Надання ліквідності ринку за рахунок спреду.
•[Machine Learning](https://app.binance.com/uni-qr/cart/35660617901114?r=ho8lubrb&l=uk-ua&uco=5vkgl9tq36cfnvkodfwkkw&uc=app_square_share_link&us=copylink): Навчання нейромереж розпізнавати сетапи.
🔀 IX. АРБІТРАЖ ТА НІШЕВІ МЕТОДИ
•[Arbitrage](https://app.binance.com/uni-qr/cart/35507078103098?r=ho8lubrb&l=uk-ua&uco=5vkgl9tq36cfnvkodfwkkw&uc=app_square_share_link&us=copylink): Просторовий (різниця цін на біржах) або трикутний (всередині однієї біржі).
•[Order Flow](https://app.binance.com/uni-qr/cart/35601499169906?r=ho8lubrb&l=uk-ua&uco=5vkgl9tq36cfnvkodfwkkw&uc=app_square_share_link&us=copylink): Читання «стрічки» (Time & Sales) та «стакана» (DOM).
•[On-chain](https://app.binance.com/uni-qr/cart/35565266873793?r=ho8lubrb&l=uk-ua&uco=5vkgl9tq36cfnvkodfwkkw&uc=app_square_share_link&us=copylink): Аналіз переказів китів та потоків на гаманцях блокчейну.
🧠 X. ПСИХОЛОГІЯ ТА РИЗИК: Фундамент виживання
Без цього розділу всі попередні методи не мають сенсу.
•[Risk Management](https://app.binance.com/uni-qr/cpos/33081979215753?r=ho8lubrb&l=uk-ua&uco=5vkgl9tq36cfnvkodfwkkw&uc=app_square_share_link&us=copylink): Розрахунок розміру позиції та R:R ([Risk/Reward](https://app.binance.com/uni-qr/cart/34936701777065?r=ho8lubrb&l=uk-ua&uco=5vkgl9tq36cfnvkodfwkkw&uc=app_square_share_link&us=copylink)).
•[Expectancy](https://app.binance.com/uni-qr/cart/35660057079234?r=ho8lubrb&l=uk-ua&uco=5vkgl9tq36cfnvkodfwkkw&uc=app_square_share_link&us=copylink): Розуміння математичного очікування вашої системи.
•[Anti-Martingale](https://app.binance.com/uni-qr/cart/35603347206258?r=ho8lubrb&l=uk-ua&uco=5vkgl9tq36cfnvkodfwkkw&uc=app_square_share_link&us=copylink): Збільшення позиції під час прибутку, а не збитку.
🏁 ВИСНОВОК: Яку форму обрати?
Ваш стиль торгівлі залежить від вашого психотипу:
1.[Scalping](https://app.binance.com/uni-qr/cart/35085596593602?r=ho8lubrb&l=uk-ua&uco=5vkgl9tq36cfnvkodfwkkw&uc=app_square_share_link&us=copylink): Угоди на хвилини.
2.[Day Trading](https://app.binance.com/uni-qr/cart/35555277962922?r=ho8lubrb&l=uk-ua&uco=5vkgl9tq36cfnvkodfwkkw&uc=app_square_share_link&us=copylink): Закриття всіх позицій до кінця дня.
3.[Swing Trading](https://app.binance.com/uni-qr/cart/35112991496305?r=ho8lubrb&l=uk-ua&uco=5vkgl9tq36cfnvkodfwkkw&uc=app_square_share_link&us=copylink): Утримання позицій кілька днів/тижнів.
4.[Position/Investment](https://app.binance.com/uni-qr/cart/35643706816113?r=ho8lubrb&l=uk-ua&uco=5vkgl9tq36cfnvkodfwkkw&uc=app_square_share_link&us=copylink): Робота на місяці та роки.
⚠️Порада професіонала: Найкращий результат дає комбінація. Використовуйте Wyckoff для розуміння контексту, SMC/Price Action для точки входу та суворий Risk Management для збереження капіталу.
"Крипторинок — це океан можливостей, але без навігатора тут легко піти на дно. Ви коли-небудь відчували, що купуєте на самому піку, а продаєте саме тоді, коли ціна ось-ось розвернеться вгору? Припиніть гадати на кавовій гущі! Справжній успіх у трейдингу — це не інтуїція, а математика та дисципліна. Ми зібрали для вас 'золоту тринадцятку' інструментів, які перетворять хаотичні графіки на чітку карту прибутку. Час дізнатися, як читати ринок між рядків!"
‼️[📊13 Найкращих Індикаторів для Криптотрейдингу: Повний Посібник з Денної та Свінг-Торгівлі📈📉](https://app.binance.com/uni-qr/cart/35857916400978?r=ho8lubrb&l=uk-ua&uco=5vkgl9tq36cfnvkodfwkkw&uc=app_square_share_link&us=copylink)‼️
📖Енциклопедія сучасного трейдингу: Від концепцій Smart Money до квантових алгоритмів📊
Трейдинг — це не просто купівля та продаж. Це інтелектуальна війна, де кожен учасник використовує свою зброю: від класичної геометрії до штучного інтелекту. У цій статті ми розберемо повну карту методів, які формують фінансові ринки.
🧠 I. КОНЦЕПТУАЛЬНІ МЕТОДИ: Як мислять професіонали
Ці методи шукають відповідь на питання «Чому ціна рухається?», фокусуючись на діях великих гравців.
1.Метод Річарда Вайкоффа (Wyckoff)
Фундамент, створений на початку XX століття. Головна ідея — ринком керує "Composite Man"(комбінований гравець).
•Цикли: Накопичення (Accumulation) та Розподіл (Distribution).
•Маніпуляції: Spring (пастка для продавців) та Upthrust (пастка для покупців).
• Закони: Зусилля проти результату (об'єм проти руху ціни).
2.Smart Money Concepts (SMC)
Еволюція Вайкоффа. Базується на тому, що маркетмейкери маніпулюють ціною для збору ліквідності.
•BOS (Break of Structure): Підтвердження тренду.
•CHoCH (Change of Character): Перший сигнал зміни тренду.
•Order Blocks: Зони, де великий гравець відкривав позицію.
3.ICT (Inner Circle Trader)
Авторська методика Майкла Хаддлстона.
•Fair Value Gaps (FVG): Цінові дисбаланси.
•Power of 3: Маніпулятивний цикл (Accumulation, Manipulation, Distribution).
•Kill Zones: Конкретні часові проміжки для торгівлі.
4.Об'ємний аналіз (Market/Volume Profile)
Використання POC (Point of Control — ціна з найбільшим об'ємом), HVN та LVN (вузли високого та низького об'єму) для пошуку справжньої вартості активу.
📊II. PRICE ACTION: Мистецтво чистого графіка
Торгівля без запізнілих індикаторів, заснована на русі самої ціни.
• Класика: Підтримка/Опір, максимуми та мінімуми (HH, HL).
•Свічкові патерни: Pin Bar (відмова), Engulfing (поглинання), Doji (невизначеність), Inside Bar.
•Supply & Demand: Пошук зон, де пропозиція перевищує попит, і навпаки.
‼️💎 CryptoTradeMask: Торгуй не картинки, а логіку ринку‼️
📈 III. ТРЕНДОВІ ТА ПРОБІЙНІ СТРАТЕГІЇ
Спроба «осідлати» інерцію ринку.
•Trend Following: Купівля на зростанні, продаж на падінні.
•Moving Averages: Використання EMA 20/50/200 та перетинів («Золотий хрест»).
•Breakout Trading: Торгівля на пробій рівнів або «стиснення» (трикутники).
•False Breakout (Fakeout): Торгівля проти тих, хто зайшов на хибному пробої (Stop Hunt).
•Gap Trading: Робота з розривами цін (Gap & Go або закриття гепу).
🔄 IV. MEAN REVERSION: Повернення до середнього
Стратегії, що базуються на ідеї, що ціна завжди занадто сильно відхиляється від норми, але потім повертається.
•Range Trading: Торгівля в боковику від межі до межі.
•VWAP Reversion: Використання середньозваженої за об'ємом ціни як магніту.
‼️📈 15 порад для прибуткового криптотрейдингу‼️
📐 V. ТЕХНІЧНІ ІНДИКАТОРИ ТА ФІБО-МАТЕМАТИКА
Математична обробка ціни для візуалізації сигналів.
• Осцилятори: RSI (дивергенції), MACD, Stochastic.
• Волатильність: Bollinger Bands (стиснення) та ATR (для виставлення стопів).
•Числа Фібоначчі: Рівні корекції (0.618) та розширення для визначення цілей.
🌊 VI. ХВИЛЬОВА ТЕОРІЯ ТА ГАРМОНІКА
Пошук циклічності та повторюваних геометричних структур.
•Elliott Wave Theory: Ринок рухається хвилями 1-2-3-4-5 та A-B-C.
•Harmonic Patterns: Складні фігури на основі Фібоначчі (Gartley, Bat, Butterfly).
•Wolfe Waves: П’ятихвильовий патерн для пошуку точок розвороту.
⏱️ VII. ЧАС ТА КОНТЕКСТ (SESSIONS & MACRO)
Ринок працює по годинах, і його настрій залежить від глобальних новин.
•Session Trading: Розуміння особливостей Азії (флет), Лондона (тренд) та Нью-Йорка (реверс).
•News Trading: Реакція на інфляцію (CPI), безробіття (NFP) та ставки ФРС (FOMC).
•Fundamental Analysis: Оцінка макроекономіки, токеноміки (для крипто) або фінансових звітів компаній (Earnings).
‼️🚀 Криптотрейдинг з нуля за 30 днів — покроковий план, щоб навчитися і впевнено торгувати‼️
🤖 VIII. АЛГОРИТМІЧНИЙ ТА КВАНТОВИЙ ТРЕЙДИНГ
Світ роботів та високої математики.
•HFT (High Frequency): Торгівля з мікросекундною швидкістю.
•Statistical Arbitrage: Пошук математичних розбіжностей між активами.
•Market Making: Надання ліквідності ринку за рахунок спреду.
•Machine Learning: Навчання нейромереж розпізнавати сетапи.
🔀 IX. АРБІТРАЖ ТА НІШЕВІ МЕТОДИ
•Arbitrage: Просторовий (різниця цін на біржах) або трикутний (всередині однієї біржі).
•Order Flow: Читання «стрічки» (Time & Sales) та «стакана» (DOM).
•On-chain: Аналіз переказів китів та потоків на гаманцях блокчейну.
🧠 X. ПСИХОЛОГІЯ ТА РИЗИК: Фундамент виживання
Без цього розділу всі попередні методи не мають сенсу.
•Risk Management: Розрахунок розміру позиції та R:R (Risk/Reward).
•Expectancy: Розуміння математичного очікування вашої системи.
•Anti-Martingale: Збільшення позиції під час прибутку, а не збитку.
🏁 ВИСНОВОК: Яку форму обрати?
Ваш стиль торгівлі залежить від вашого психотипу:
1.Scalping: Угоди на хвилини.
2.Day Trading: Закриття всіх позицій до кінця дня.
3.Swing Trading: Утримання позицій кілька днів/тижнів.
4.Position/Investment: Робота на місяці та роки.
⚠️Порада професіонала: Найкращий результат дає комбінація. Використовуйте Wyckoff для розуміння контексту, SMC/Price Action для точки входу та суворий Risk Management для збереження капіталу.
"Крипторинок — це океан можливостей, але без навігатора тут легко піти на дно. Ви коли-небудь відчували, що купуєте на самому піку, а продаєте саме тоді, коли ціна ось-ось розвернеться вгору? Припиніть гадати на кавовій гущі! Справжній успіх у трейдингу — це не інтуїція, а математика та дисципліна. Ми зібрали для вас 'золоту тринадцятку' інструментів, які перетворять хаотичні графіки на чітку карту прибутку. Час дізнатися, як читати ринок між рядків!"
‼️📊13 Найкращих Індикаторів для Криптотрейдингу: Повний Посібник з Денної та Свінг-Торгівлі📈📉‼️
10
3
42
420
#lisk
🚀 Market Overview: The Surge of $LSK and Key Trends
The cryptocurrency $LSK has shown impressive growth of 24.03%, reaching the $0.203 mark. Meanwhile, the broader market is showing moderate movement: total market capitalization has risen by 1.45%, and Bitcoin has gained 1.65%.
1️⃣ General Market Situation
Market capitalization has increased by 1.45%, while the leading cryptocurrency (Bitcoin) has gained 1.65%.
Lisk’s surge of over 24% stands out as a notable exception, as most other assets have remained within typical fluctuation ranges.
Tip: Diversify your portfolio thoroughly and avoid making emotional decisions during sharp price spikes in individual coins.
2️⃣ Anomalous Activity
One asset has recorded a staggering gain of 521.86% (reaching a price of $42.96); however, technical indicators suggest it is currently overbought.
The 7-day RSI stands at 93.5, and the MACD lines point to potential buyer exhaustion.
Tip: Exercise extreme caution with overbought assets—an excessively high RSI (above 80) often precedes a deep correction.
3️⃣ Technical Analysis of Lisk (LSK)
The asset has stabilized above key levels: immediate resistance lies at $0.205 (the 23.6% retracement level), while support is at $0.1905 (the 50% level).
A breakdown below $0.1905 could pave the way for a deeper decline toward $0.1749.
Strategy: It is advisable to wait for a test of the support level or confirmation of a breakout above resistance before opening new positions.
⚠️ Conclusion: The market offers excellent opportunities, but requires a cool-headed approach. Keep an eye on the $0.205 and $0.1905 levels for Lisk, and be mindful of the risks!
{future}(LSKUSDT)
#lisk
🚀 Market Overview: The Surge of $LSK and Key Trends
The cryptocurrency $LSK has shown impressive growth of 24.03%, reaching the $0.203 mark. Meanwhile, the broader market is showing moderate movement: total market capitalization has risen by 1.45%, and Bitcoin has gained 1.65%.
1️⃣ General Market Situation
Market capitalization has increased by 1.45%, while the leading cryptocurrency (Bitcoin) has gained 1.65%.
Lisk’s surge of over 24% stands out as a notable exception, as most other assets have remained within typical fluctuation ranges.
Tip: Diversify your portfolio thoroughly and avoid making emotional decisions during sharp price spikes in individual coins.
2️⃣ Anomalous Activity
One asset has recorded a staggering gain of 521.86% (reaching a price of $42.96); however, technical indicators suggest it is currently overbought.
The 7-day RSI stands at 93.5, and the MACD lines point to potential buyer exhaustion.
Tip: Exercise extreme caution with overbought assets—an excessively high RSI (above 80) often precedes a deep correction.
3️⃣ Technical Analysis of Lisk (LSK)
The asset has stabilized above key levels: immediate resistance lies at $0.205 (the 23.6% retracement level), while support is at $0.1905 (the 50% level).
A breakdown below $0.1905 could pave the way for a deeper decline toward $0.1749.
Strategy: It is advisable to wait for a test of the support level or confirmation of a breakout above resistance before opening new positions.
⚠️ Conclusion: The market offers excellent opportunities, but requires a cool-headed approach. Keep an eye on the $0.205 and $0.1905 levels for Lisk, and be mindful of the risks!

1
230
#Hyperliquid
🚀 Top Crypto News: The market holds its breath, while Hyperliquid ($HYPE ) takes center stage!
The Hyperliquid (HYPE) token is showing strong growth, up 14.16% to reach $91.28. What is happening in the market right now, and what are the key drivers behind this movement?
📊 Top 3 stories of the day:
1️⃣ Interest from Traditional Finance (ICE)
What happened: Intercontinental Exchange (ICE)—the parent company of the NYSE—is exploring the acquisition of the platform Trade.xyz, which is linked to the Hyperliquid ecosystem (subject to CFTC approval).
Why it matters: This paves the way for an influx of institutional capital and establishes a solid foundation for the long-term growth of HYPE.
2️⃣ Growth of the Hyperliquid Ecosystem
What happened: The Hyperliquid ecosystem has grown by 10.11%, significantly outperforming the broader market, which rose by just 0.26%. The $HYPE token itself is backed by $1.51 billion in liquidity.
Context: High market capitalization and robust liquidity point to the project's resilience and strong investor interest.
3️⃣ Technical Analysis and Price Levels
What happened: Following the news regarding ICE, the price of $HYPE has consolidated above $90, with its sights set on the resistance level at $98. The $85 mark currently serves as a key support level. Macro Backdrop: Meanwhile, Bitcoin is trading near $80,240, exhibiting moderate volatility.
⚠️ Conclusion:
Potential interest from ICE and regulatory developments from the CFTC could serve as a powerful catalyst for a further surge in HYPE. However, it is worth keeping an eye on key support levels and the risks of a correction.
{future}(HYPEUSDT)
#Hyperliquid
🚀 Top Crypto News: The market holds its breath, while Hyperliquid ($HYPE ) takes center stage!
The Hyperliquid (HYPE) token is showing strong growth, up 14.16% to reach $91.28. What is happening in the market right now, and what are the key drivers behind this movement?
📊 Top 3 stories of the day:
1️⃣ Interest from Traditional Finance (ICE)
What happened: Intercontinental Exchange (ICE)—the parent company of the NYSE—is exploring the acquisition of the platform Trade.xyz, which is linked to the Hyperliquid ecosystem (subject to CFTC approval).
Why it matters: This paves the way for an influx of institutional capital and establishes a solid foundation for the long-term growth of HYPE.
2️⃣ Growth of the Hyperliquid Ecosystem
What happened: The Hyperliquid ecosystem has grown by 10.11%, significantly outperforming the broader market, which rose by just 0.26%. The $HYPE token itself is backed by $1.51 billion in liquidity.
Context: High market capitalization and robust liquidity point to the project's resilience and strong investor interest.
3️⃣ Technical Analysis and Price Levels
What happened: Following the news regarding ICE, the price of $HYPE has consolidated above $90, with its sights set on the resistance level at $98. The $85 mark currently serves as a key support level. Macro Backdrop: Meanwhile, Bitcoin is trading near $80,240, exhibiting moderate volatility.
⚠️ Conclusion:
Potential interest from ICE and regulatory developments from the CFTC could serve as a powerful catalyst for a further surge in HYPE. However, it is worth keeping an eye on key support levels and the risks of a correction.

HYPE+13,70%
ICEUS+1,39%
189
#HumaFianance
📊 Crypto Digest and Market Overview: Focus on Huma Finance ($HUMA )
Over the past 24 hours, the overall market situation has stabilized somewhat, with Bitcoin showing a modest gain of 1.1%. Meanwhile, the Huma Finance (HUMA) project is demonstrating notable momentum, with its price currently at $0.0294 (an 8.31% change).
📊 Let’s break down three key events and news items shaping the current trend:
1️⃣ Growth in Capitalization and Activity
Key development: Trading volume has surged by 58%, reaching $20.5 million.
Reason: Heightened trader interest in the project, which has attracted significant liquidity in a short period.
Effect: This activity creates strong momentum for further movement and draws the community's attention.
2️⃣ Macroeconomic and Sector Context
Key development: The decentralized finance (DeFi) sector and related tools continue to adapt to market conditions. Within this landscape, Huma Finance has carved out a niche, offering a pool yield of 6.78%.
Effect: Sustained user interest in such instruments supports underlying demand for the token.
3️⃣ Technical Analysis and Key Levels
Support and Resistance Levels: The price of $HUMA has consolidated above $0.028. The immediate target for the bulls is $0.032. In the event of a correction, key support levels are found at $0.028 and the lower boundary at $0.026.
Sentiment: The market outlook is moderately positive; however, it is worth monitoring Bitcoin’s reaction, as it traditionally influences the entire altcoin segment.
{future}(HUMAUSDT)
#HumaFianance
📊 Crypto Digest and Market Overview: Focus on Huma Finance ($HUMA )
Over the past 24 hours, the overall market situation has stabilized somewhat, with Bitcoin showing a modest gain of 1.1%. Meanwhile, the Huma Finance (HUMA) project is demonstrating notable momentum, with its price currently at $0.0294 (an 8.31% change).
📊 Let’s break down three key events and news items shaping the current trend:
1️⃣ Growth in Capitalization and Activity
Key development: Trading volume has surged by 58%, reaching $20.5 million.
Reason: Heightened trader interest in the project, which has attracted significant liquidity in a short period.
Effect: This activity creates strong momentum for further movement and draws the community's attention.
2️⃣ Macroeconomic and Sector Context
Key development: The decentralized finance (DeFi) sector and related tools continue to adapt to market conditions. Within this landscape, Huma Finance has carved out a niche, offering a pool yield of 6.78%.
Effect: Sustained user interest in such instruments supports underlying demand for the token.
3️⃣ Technical Analysis and Key Levels
Support and Resistance Levels: The price of $HUMA has consolidated above $0.028. The immediate target for the bulls is $0.032. In the event of a correction, key support levels are found at $0.028 and the lower boundary at $0.026.
Sentiment: The market outlook is moderately positive; however, it is worth monitoring Bitcoin’s reaction, as it traditionally influences the entire altcoin segment.
1
89
#Moonbeam
🚀 Market Overview: Moonbeam ($GLMR ) Shows Potential for a Rebound!
The cryptocurrency Moonbeam ($GLMR ) is trading at $0.00871 (+5.61%). Let’s examine the key drivers, technical indicators, and trading scenarios for this asset.
📊 Key News and Events
1. Increased Network Activity: A rise in transaction volume indicates a resurgence in user interest. Despite a market capitalization of $10.6 million, the project holds potential for further development.
2. Technical Rebound: The Relative Strength Index (RSI) stands at 30.7, signaling that the asset is oversold—suggesting room for a potential 107% gain (up to $9.01).
📉 Technical Analysis and Levels
Current Price: $0.00871
Key Support: $0.00859 (a breakdown below this level could intensify bearish pressure)
Immediate Resistance: $0.00983 (reaching a 30-day high)
Additional Support: $0.00738
⚠️ What Should Investors Do?
For Buyers: Current price levels appear attractive for entering a position with a view toward medium-term growth; however, it is important to manage risks near the $0.00859 support level.
For Risk-Oriented Strategies: Watch for a breakout above the $0.00983 resistance level to confirm an upward trend.
{spot}(GLMRUSDT)
#Moonbeam
🚀 Market Overview: Moonbeam ($GLMR ) Shows Potential for a Rebound!
The cryptocurrency Moonbeam ($GLMR ) is trading at $0.00871 (+5.61%). Let’s examine the key drivers, technical indicators, and trading scenarios for this asset.
📊 Key News and Events
1. Increased Network Activity: A rise in transaction volume indicates a resurgence in user interest. Despite a market capitalization of $10.6 million, the project holds potential for further development.
2. Technical Rebound: The Relative Strength Index (RSI) stands at 30.7, signaling that the asset is oversold—suggesting room for a potential 107% gain (up to $9.01).
📉 Technical Analysis and Levels
Current Price: $0.00871
Key Support: $0.00859 (a breakdown below this level could intensify bearish pressure)
Immediate Resistance: $0.00983 (reaching a 30-day high)
Additional Support: $0.00738
⚠️ What Should Investors Do?
For Buyers: Current price levels appear attractive for entering a position with a view toward medium-term growth; however, it is important to manage risks near the $0.00859 support level.
For Risk-Oriented Strategies: Watch for a breakout above the $0.00983 resistance level to confirm an upward trend.
2
195
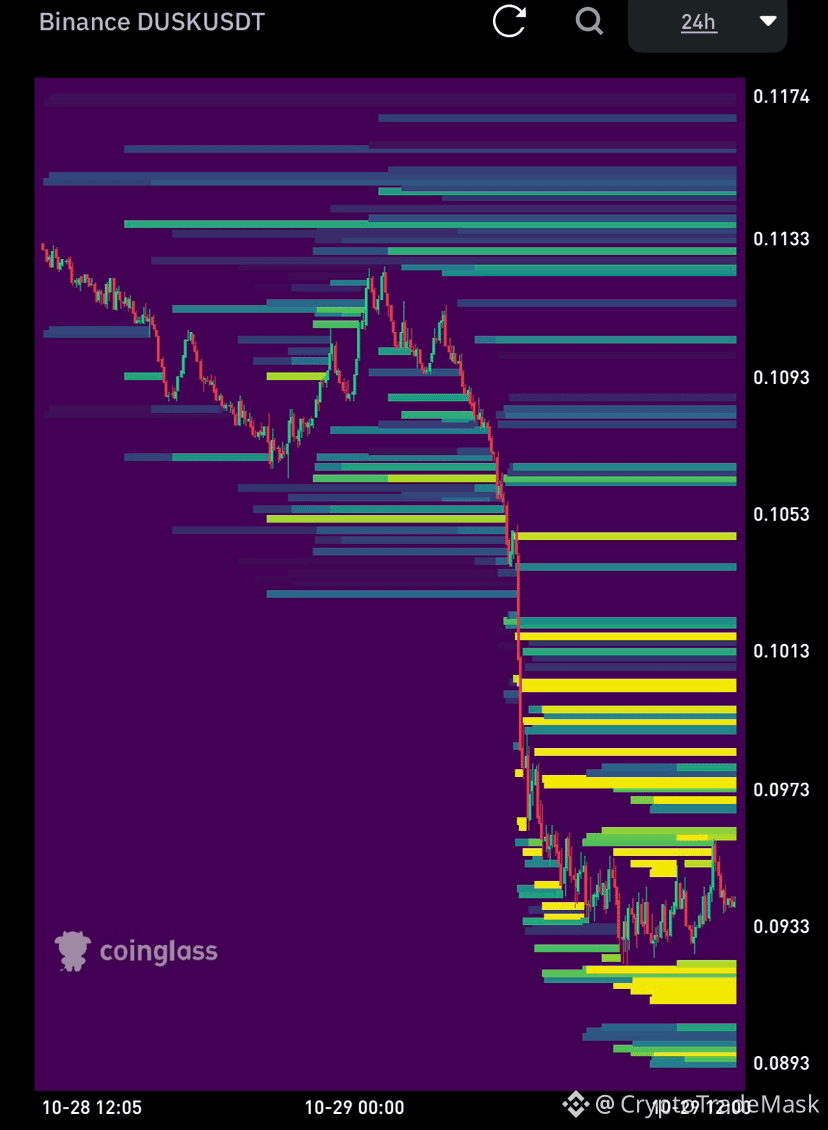
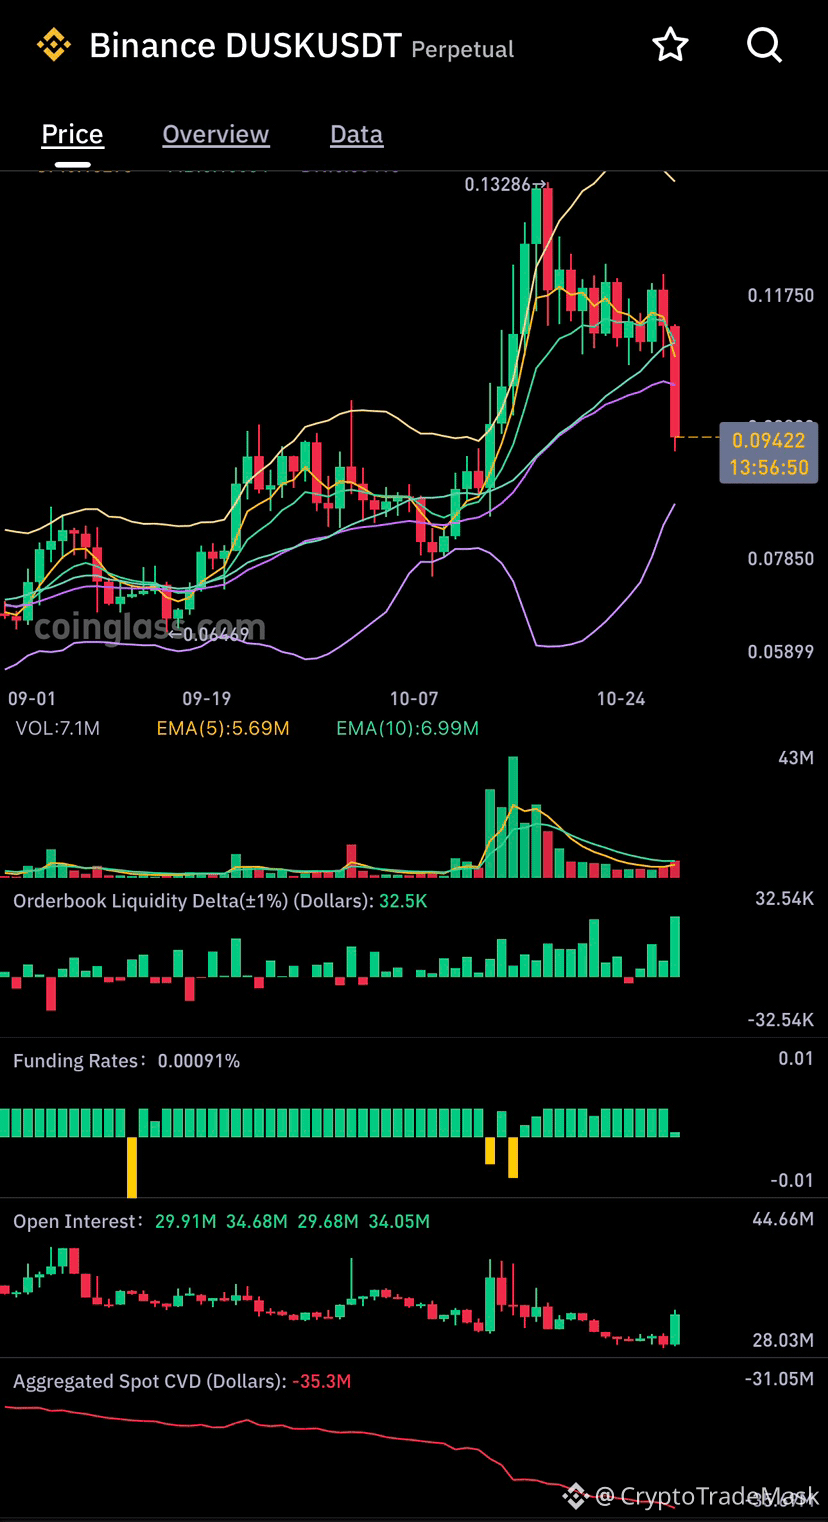
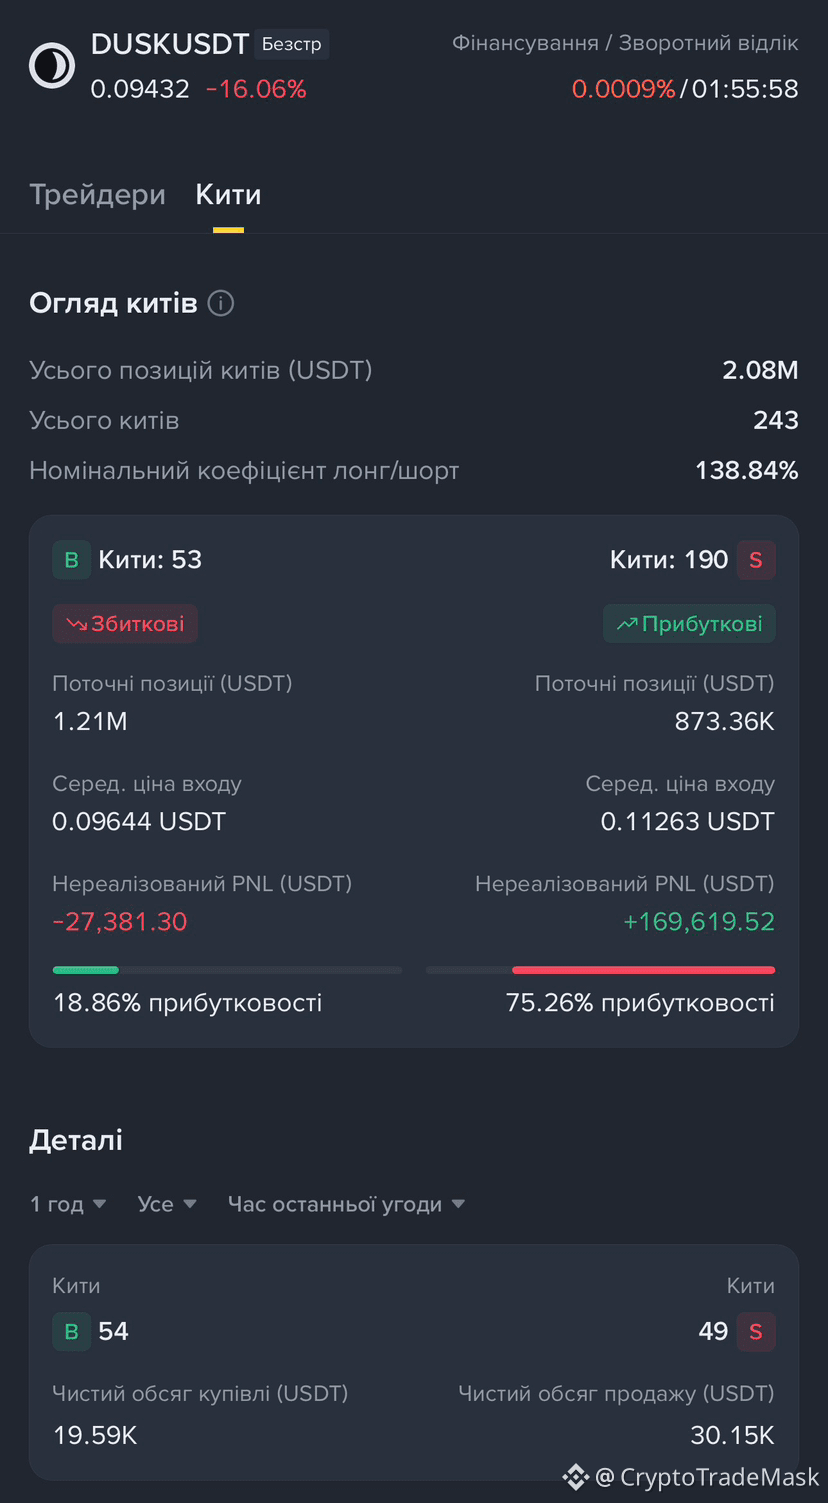
📉 $DUSK /USDT: Impulsive Dump and Market Situation
The price has dropped by over 16%, breaking through key moving averages.
Spot CVD is falling sharply, indicating strong selling pressure.
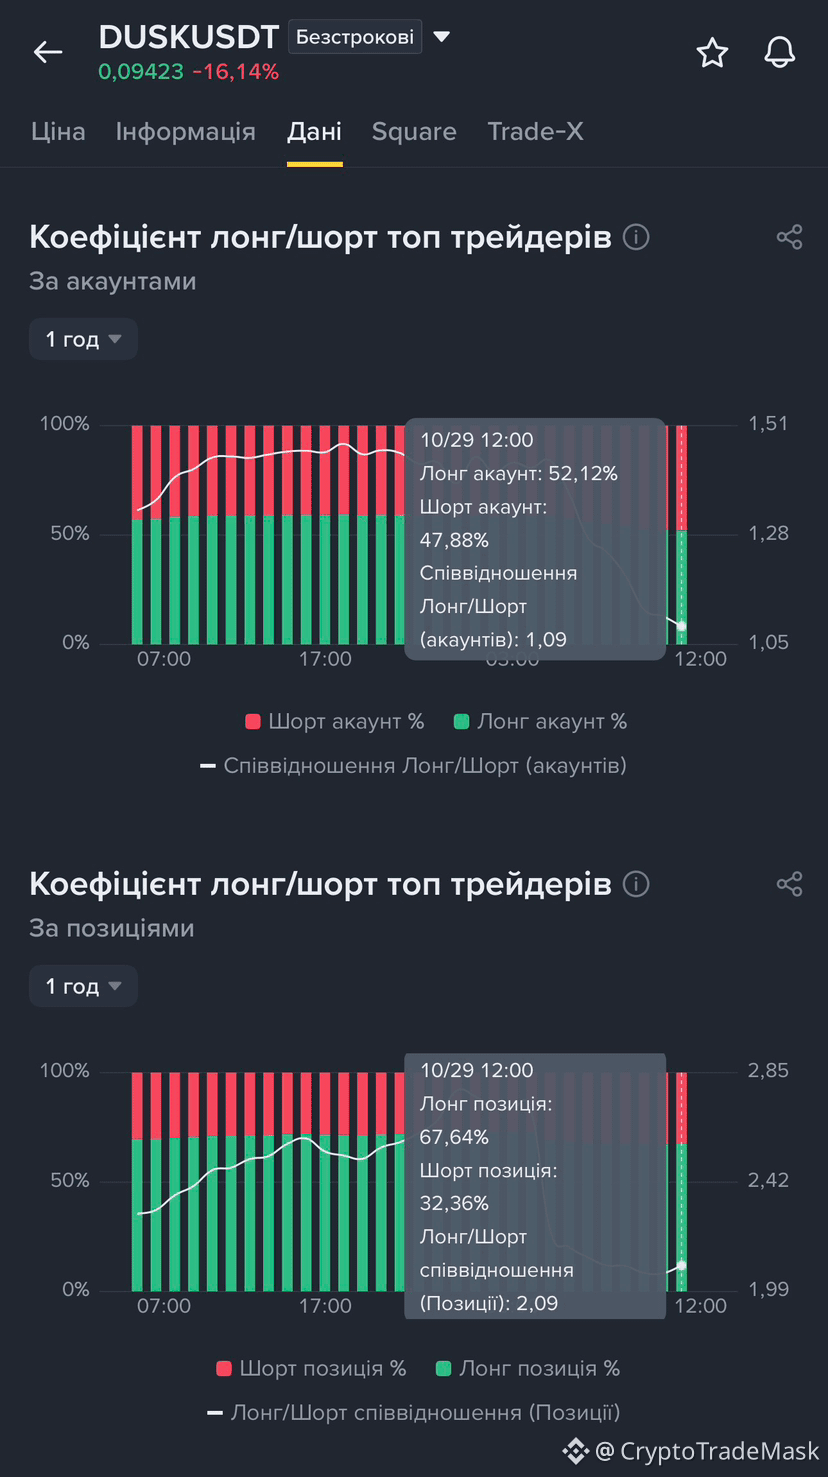
The funding rate remains positive, and top traders are predominantly holding long positions (ratio: 2.09).
Whales with profitable short positions are dominating, while long positions are accumulating losses.
🚦 Trading Ideas:
🟢 Long (for a rebound): Entry at $0.090–$0.092, stop-loss at $0.087, targets: $0.098 / $0.105.
🔴 Short (with the trend): Entry on a retest of $0.097–$0.099, stop-loss at $0.103, targets: $0.088 / $0.082.
⚠️ Manage your risks!
{future}(DUSKUSDT)
📉 $DUSK /USDT: Impulsive Dump and Market Situation
The price has dropped by over 16%, breaking through key moving averages.
Spot CVD is falling sharply, indicating strong selling pressure.
The funding rate remains positive, and top traders are predominantly holding long positions (ratio: 2.09).
Whales with profitable short positions are dominating, while long positions are accumulating losses.
🚦 Trading Ideas:
🟢 Long (for a rebound): Entry at $0.090–$0.092, stop-loss at $0.087, targets: $0.098 / $0.105.
🔴 Short (with the trend): Entry on a retest of $0.097–$0.099, stop-loss at $0.103, targets: $0.088 / $0.082.
⚠️ Manage your risks!
130
#USQ3GDP
🇺🇸 "D-Day" for the markets: US Q3 GDP data to be released!
$BTC $ETH $XRP
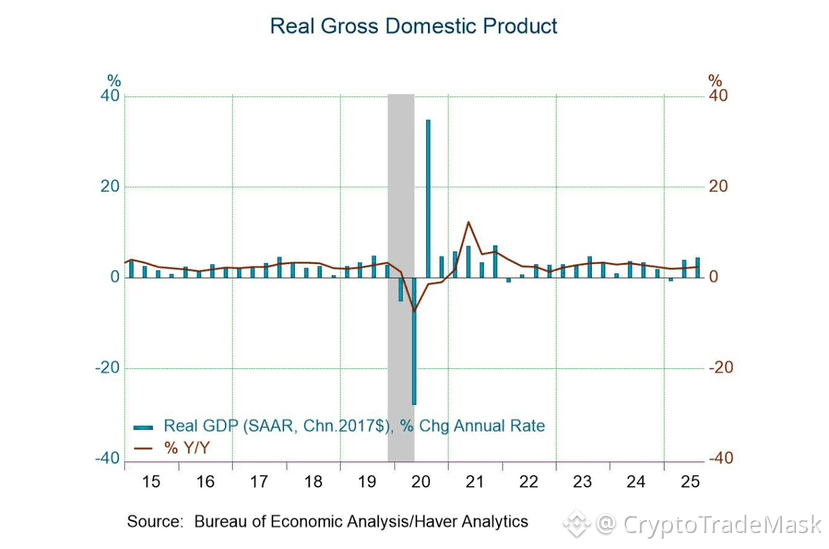
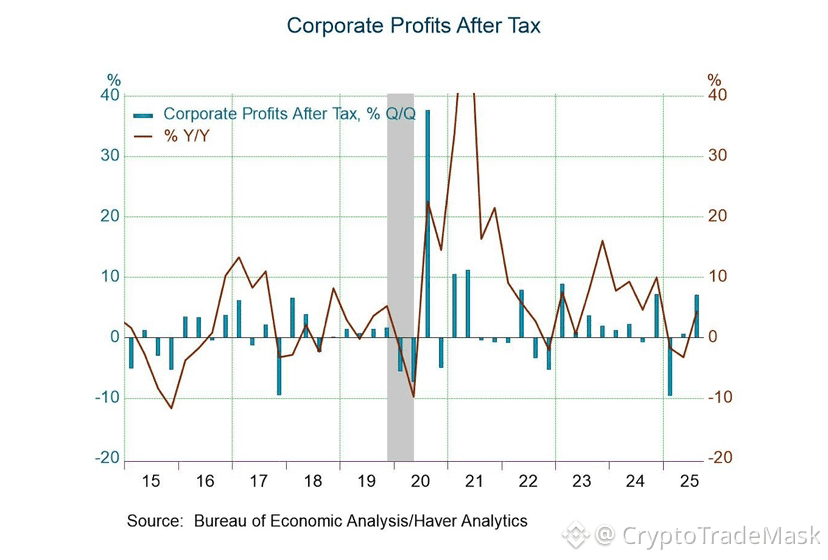
Today at 14:30 Kyiv time, the US Bureau of Economic Analysis will release its preliminary estimate of GDP for the third quarter.
The key figure everyone is watching for is a consensus forecast of around 3.2% (up from 2.2% in Q2). However, it’s not just the number itself that matters, but how the market interprets it:
🔥 "Overheating" Scenario (significantly above forecast):
The economy proves too resilient. Inflation risks rise, and the Federal Reserve might delay interest rate cuts. For risk assets—crypto included—this typically creates short-term downward pressure.
📉 "Cooling / Recession" Scenario (significantly below forecast):
A sign of economic weakness. While the immediate release could trigger a wave of volatility and localized panic, markets often view this as a signal for the Fed to ramp up the "money printer" and ease monetary policy.
⚠️ What does this mean for us?
Crypto has long been closely correlated with macro statistics. Keep a close watch leading up to 14:30 and manage your risks carefully—volatility in the derivatives market is guaranteed.
{future}(XRPUSDT)
{future}(ETHUSDT)
{future}(BTCUSDT)
#USQ3GDP
🇺🇸 "D-Day" for the markets: US Q3 GDP data to be released!
$BTC $ETH $XRP
Today at 14:30 Kyiv time, the US Bureau of Economic Analysis will release its preliminary estimate of GDP for the third quarter.
The key figure everyone is watching for is a consensus forecast of around 3.2% (up from 2.2% in Q2). However, it’s not just the number itself that matters, but how the market interprets it:
🔥 "Overheating" Scenario (significantly above forecast):
The economy proves too resilient. Inflation risks rise, and the Federal Reserve might delay interest rate cuts. For risk assets—crypto included—this typically creates short-term downward pressure.
📉 "Cooling / Recession" Scenario (significantly below forecast):
A sign of economic weakness. While the immediate release could trigger a wave of volatility and localized panic, markets often view this as a signal for the Fed to ramp up the "money printer" and ease monetary policy.
⚠️ What does this mean for us?
Crypto has long been closely correlated with macro statistics. Keep a close watch leading up to 14:30 and manage your risks carefully—volatility in the derivatives market is guaranteed.
79
#cryptotradingpro #BTC
🔥 $BTC /USDT: Testing the key $80,000 level. What’s next?
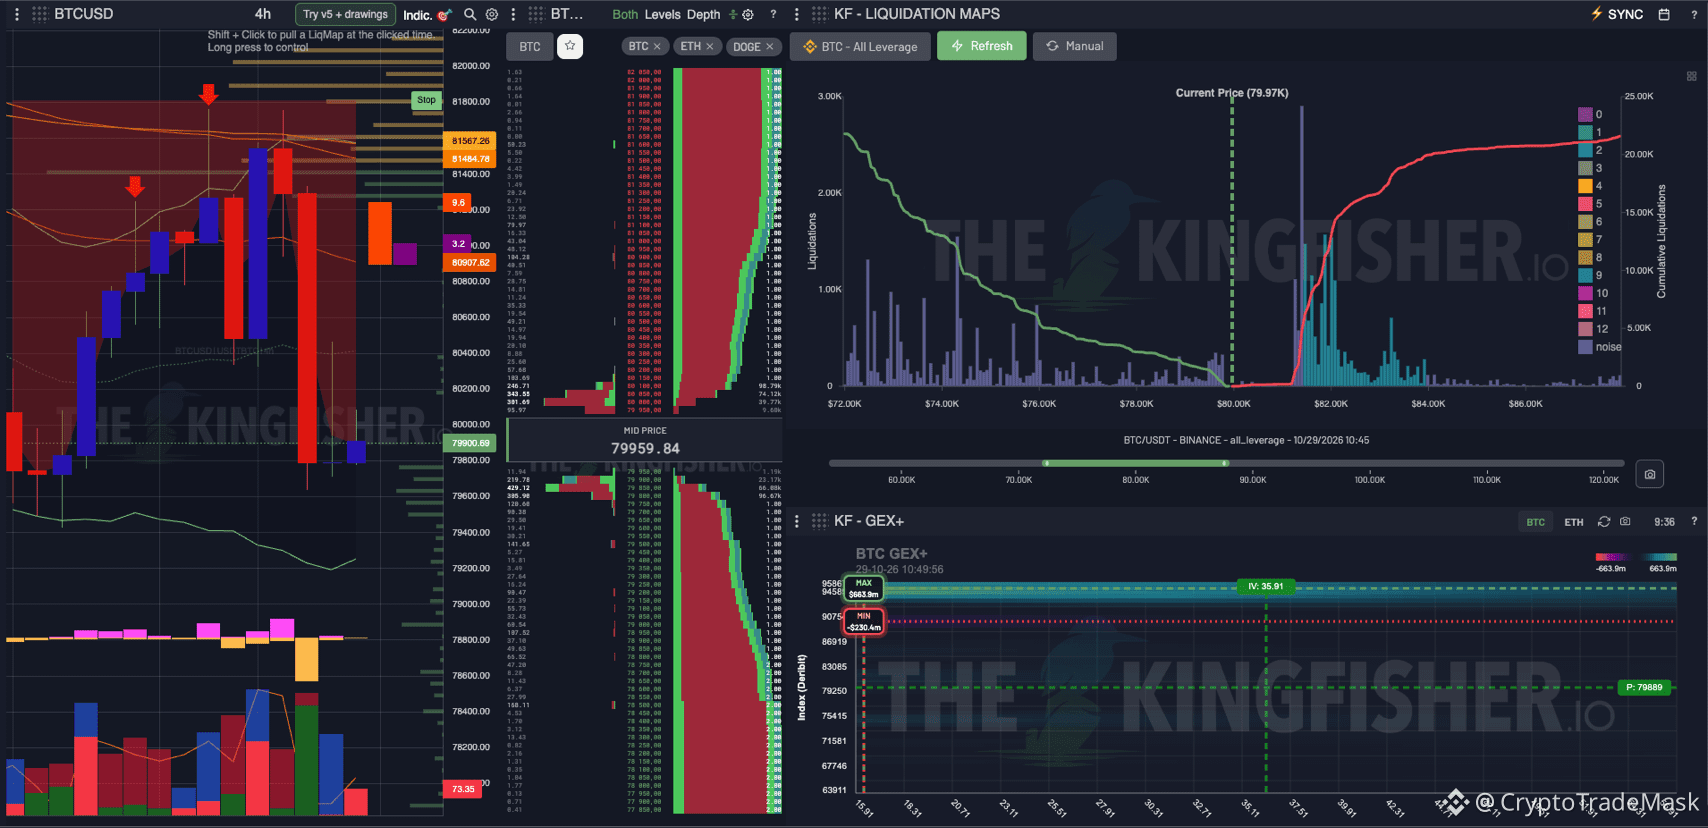
Following a strong upward momentum and the setting of new local highs, Bitcoin has encountered significant resistance in the $81,000 – $81,500 zone. Impulsive corrective candles have appeared on the chart, and the price is currently testing a crucial psychological and technical support level near $79,950.
📊 Insights from the Liquidation Map (The Kingfisher):
Short Zone (above the current price): A major concentration of seller liquidity lies within the narrow $81,000 – $82,500 range. A breakout and consolidation above $81k could trigger a chain reaction of margin calls (a "short squeeze"), potentially pushing the price above $84,000.
Long Zone (below the current price): Buyer stop-loss orders are positioned below the current price, with the nearest local liquidity clusters located in the $78,000 – $79,000 range.
🚦 Trading Scenarios:
🟢 Bullish: Holding the current range ($79,500 – $80,000), accumulating volume, and making another attempt to break the $81,000 resistance—followed by a sweep of liquidity above that level.
🔴 Bearish: A breakdown below the $79,500 level would open the door for a deeper correction, likely triggering a cascade of long-position liquidations down toward the $78,000 – $77,000 range.
⚠️ We are monitoring the buyers' reaction at the current level. The market is in a volatile phase—stick to your risk management! 📈📉
{future}(BTCUSDT)
#cryptotradingpro #BTC
🔥 $BTC /USDT: Testing the key $80,000 level. What’s next?
Following a strong upward momentum and the setting of new local highs, Bitcoin has encountered significant resistance in the $81,000 – $81,500 zone. Impulsive corrective candles have appeared on the chart, and the price is currently testing a crucial psychological and technical support level near $79,950.
📊 Insights from the Liquidation Map (The Kingfisher):
Short Zone (above the current price): A major concentration of seller liquidity lies within the narrow $81,000 – $82,500 range. A breakout and consolidation above $81k could trigger a chain reaction of margin calls (a "short squeeze"), potentially pushing the price above $84,000.
Long Zone (below the current price): Buyer stop-loss orders are positioned below the current price, with the nearest local liquidity clusters located in the $78,000 – $79,000 range.
🚦 Trading Scenarios:
🟢 Bullish: Holding the current range ($79,500 – $80,000), accumulating volume, and making another attempt to break the $81,000 resistance—followed by a sweep of liquidity above that level.
🔴 Bearish: A breakdown below the $79,500 level would open the door for a deeper correction, likely triggering a cascade of long-position liquidations down toward the $78,000 – $77,000 range.
⚠️ We are monitoring the buyers' reaction at the current level. The market is in a volatile phase—stick to your risk management! 📈📉
72
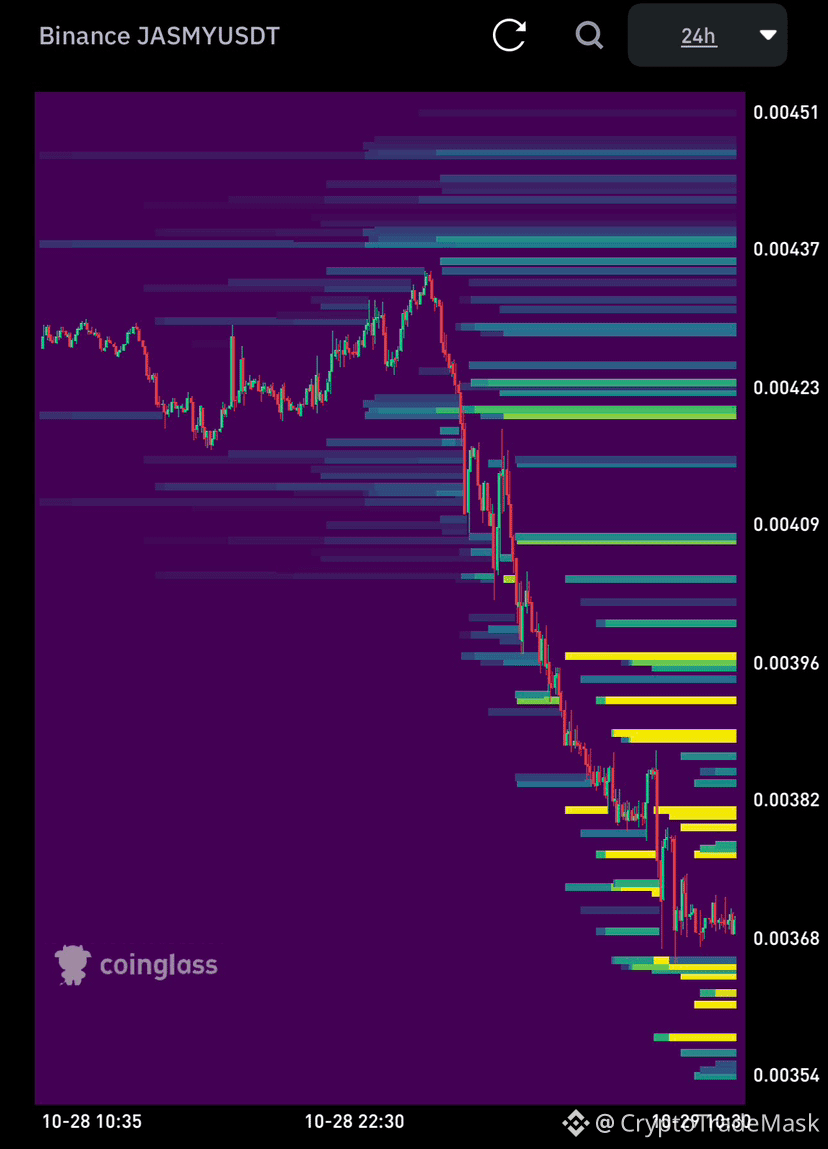
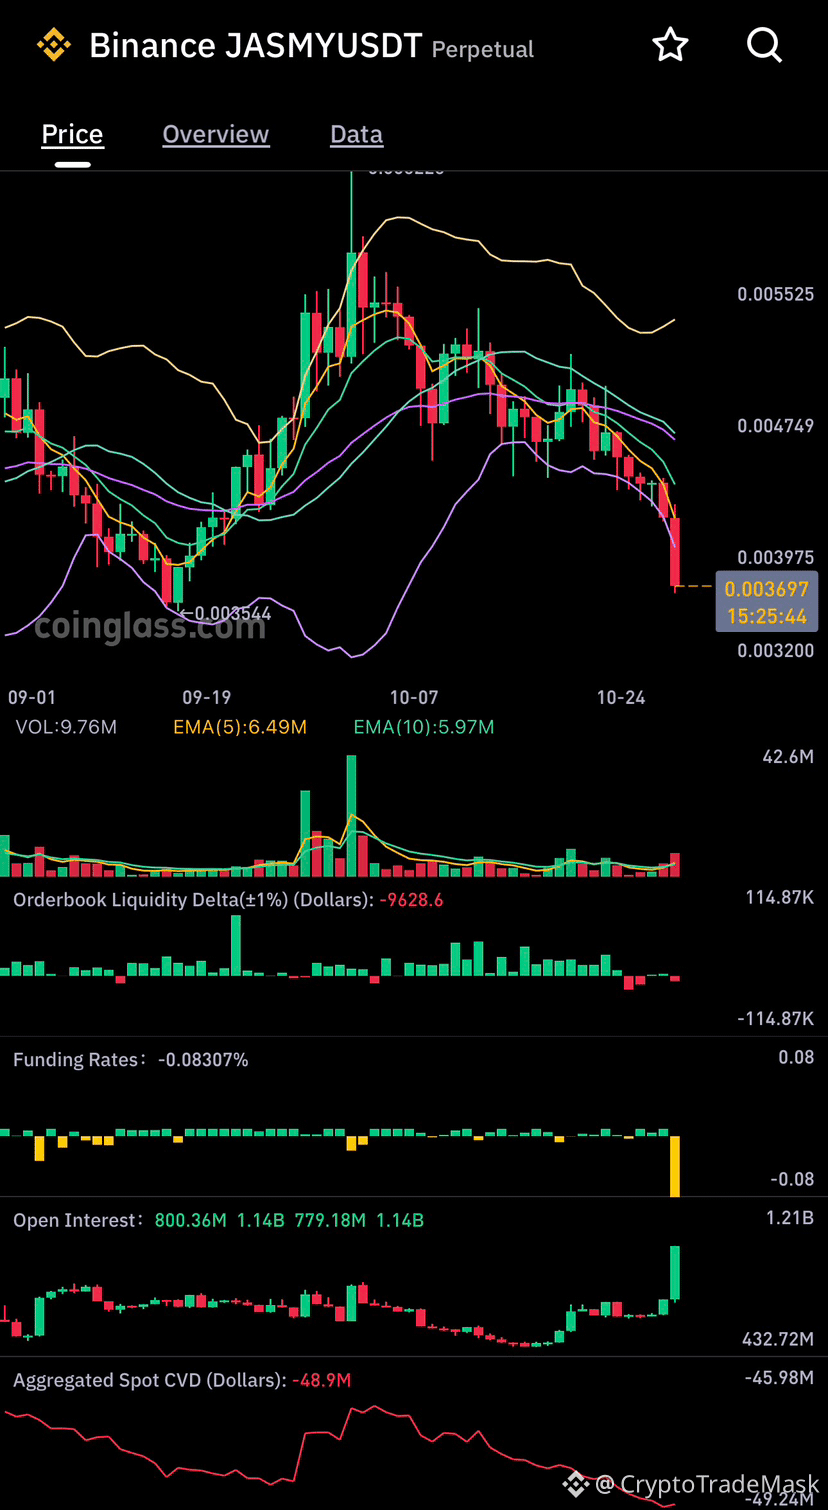
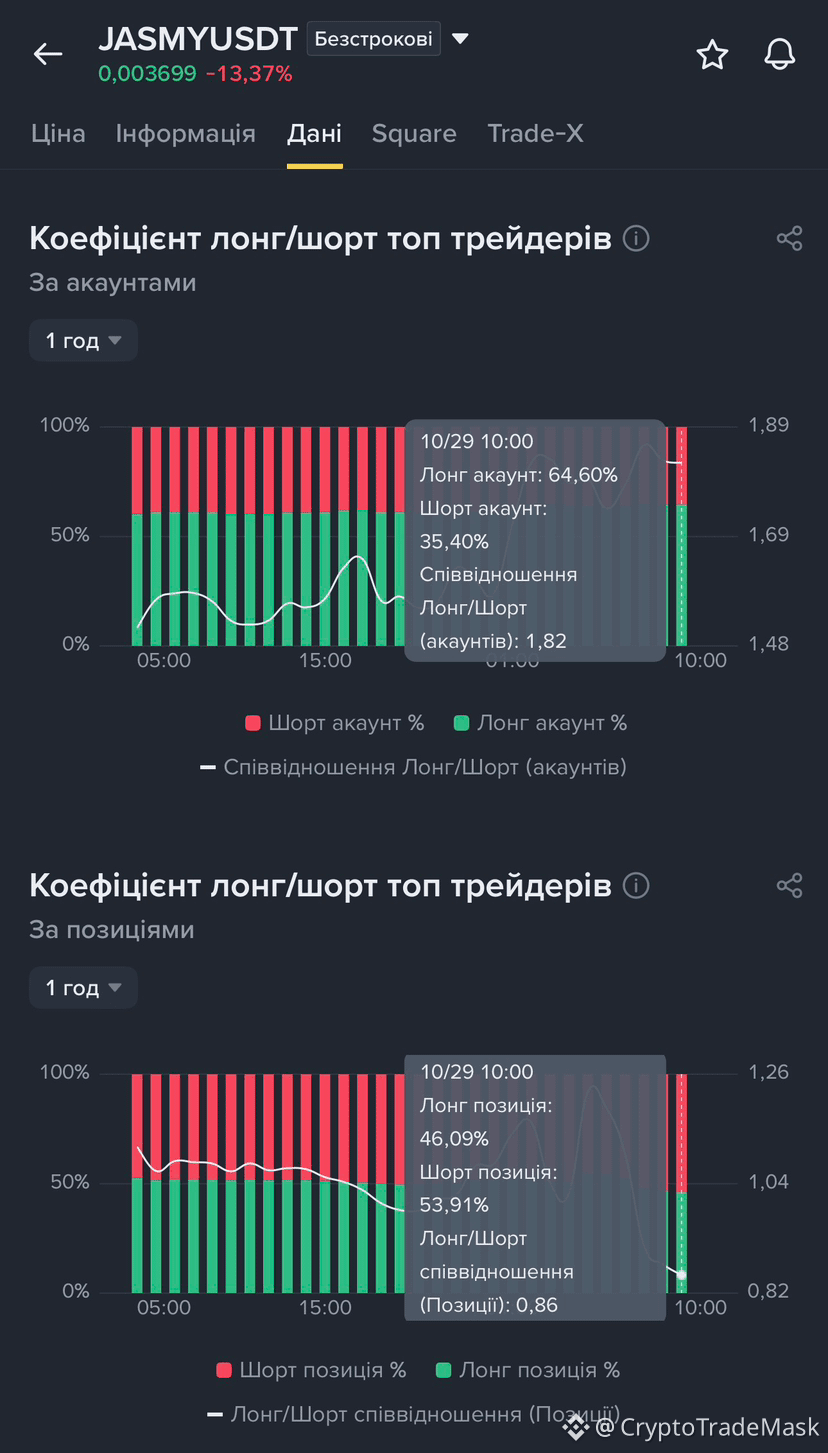
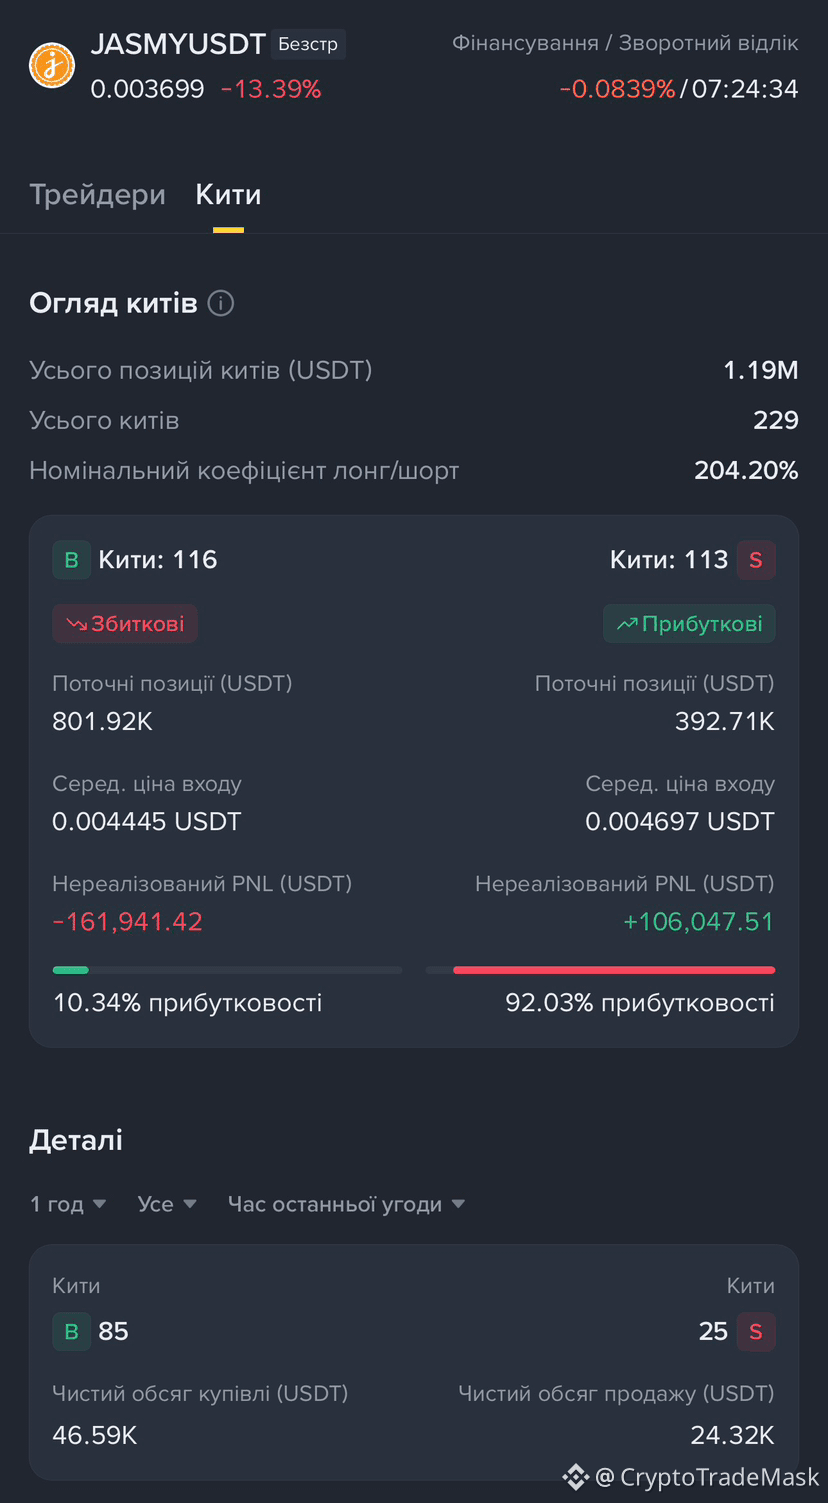
📉 $JASMY /USDT: What’s happening in the market?
The asset has experienced a sharp dump, losing over 13% in the last 24 hours, and is currently testing a support zone near 0.003699 USDT. Here is what you need to know right now:
Funding rates are deeply negative (-0.08%) — the market is heavily overloaded with short positions, creating the potential for a sharp short-term rebound (a "short squeeze").
Liquidations and Whales: Many large long positions are currently underwater; however, the spot CVD (Cumulative Volume Delta) shows signs of a selling climax.
🚦 Trading Ideas:
🟢 Counter-trend/Rebound (Long): Enter from current levels (0.00350 – 0.00365) with targets at 0.00395 – 0.00420. Stop-loss: below 0.00340.
🔴 With the trend (Short): Wait for a weak rebound toward the 0.00405 – 0.00420 zone to look for selling opportunities.
⚠️ Volatility is extremely high—don't forget to use stop-losses and practice proper risk management!
{future}(JASMYUSDT)
📉 $JASMY /USDT: What’s happening in the market?
The asset has experienced a sharp dump, losing over 13% in the last 24 hours, and is currently testing a support zone near 0.003699 USDT. Here is what you need to know right now:
Funding rates are deeply negative (-0.08%) — the market is heavily overloaded with short positions, creating the potential for a sharp short-term rebound (a "short squeeze").
Liquidations and Whales: Many large long positions are currently underwater; however, the spot CVD (Cumulative Volume Delta) shows signs of a selling climax.
🚦 Trading Ideas:
🟢 Counter-trend/Rebound (Long): Enter from current levels (0.00350 – 0.00365) with targets at 0.00395 – 0.00420. Stop-loss: below 0.00340.
🔴 With the trend (Short): Wait for a weak rebound toward the 0.00405 – 0.00420 zone to look for selling opportunities.
⚠️ Volatility is extremely high—don't forget to use stop-losses and practice proper risk management!
283
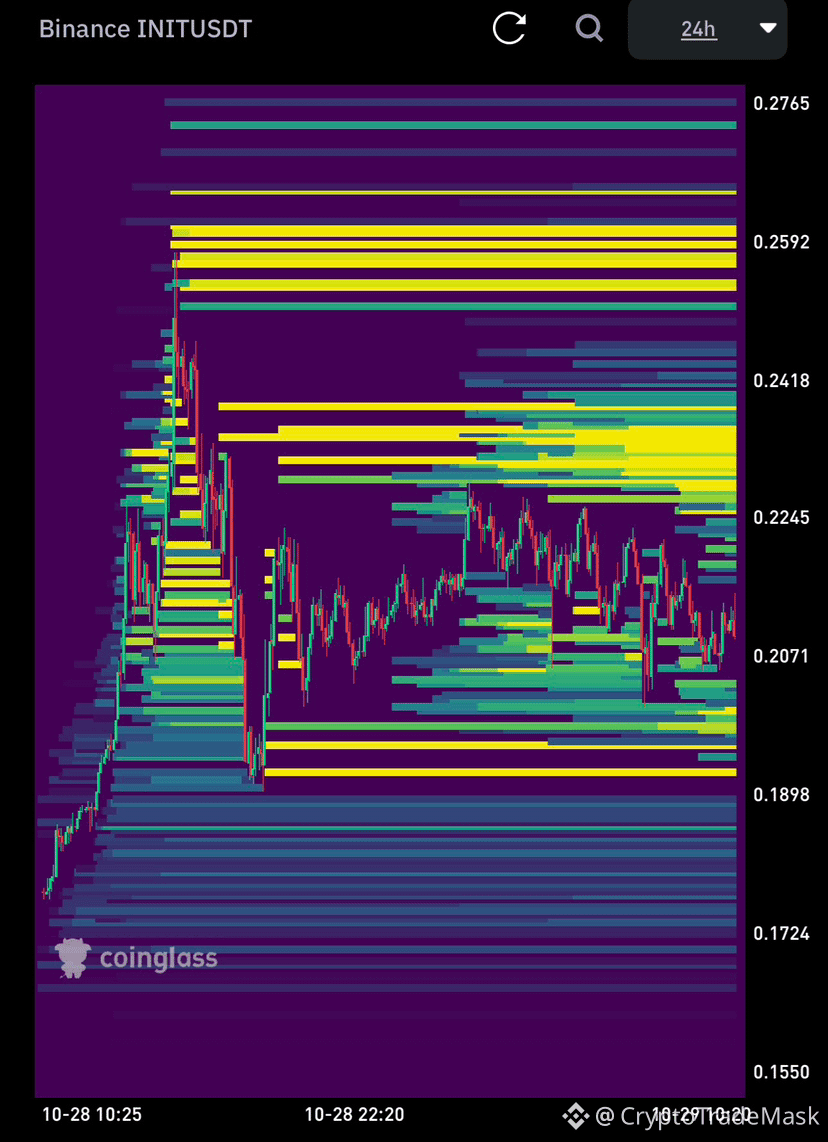
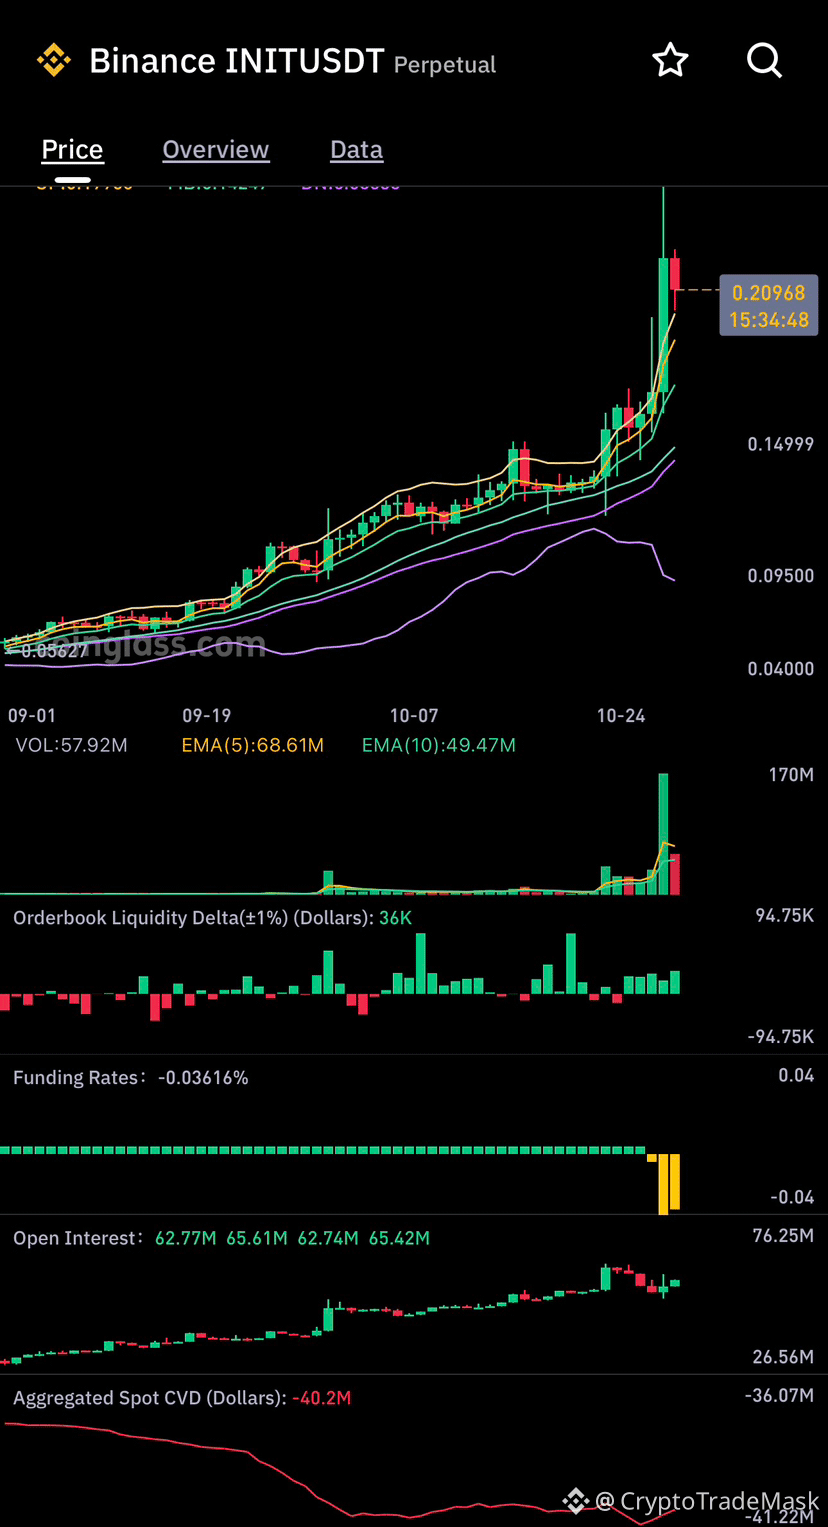
📈 $INIT /USDT: A Parabolic Surge and a Trap for Shorts!
The coin is showing a powerful upward move, breaking through local highs and holding near the 0.209 USDT mark.
📊 What the data says:
Open Interest has surged to 76.25M, confirming the intense market interest.
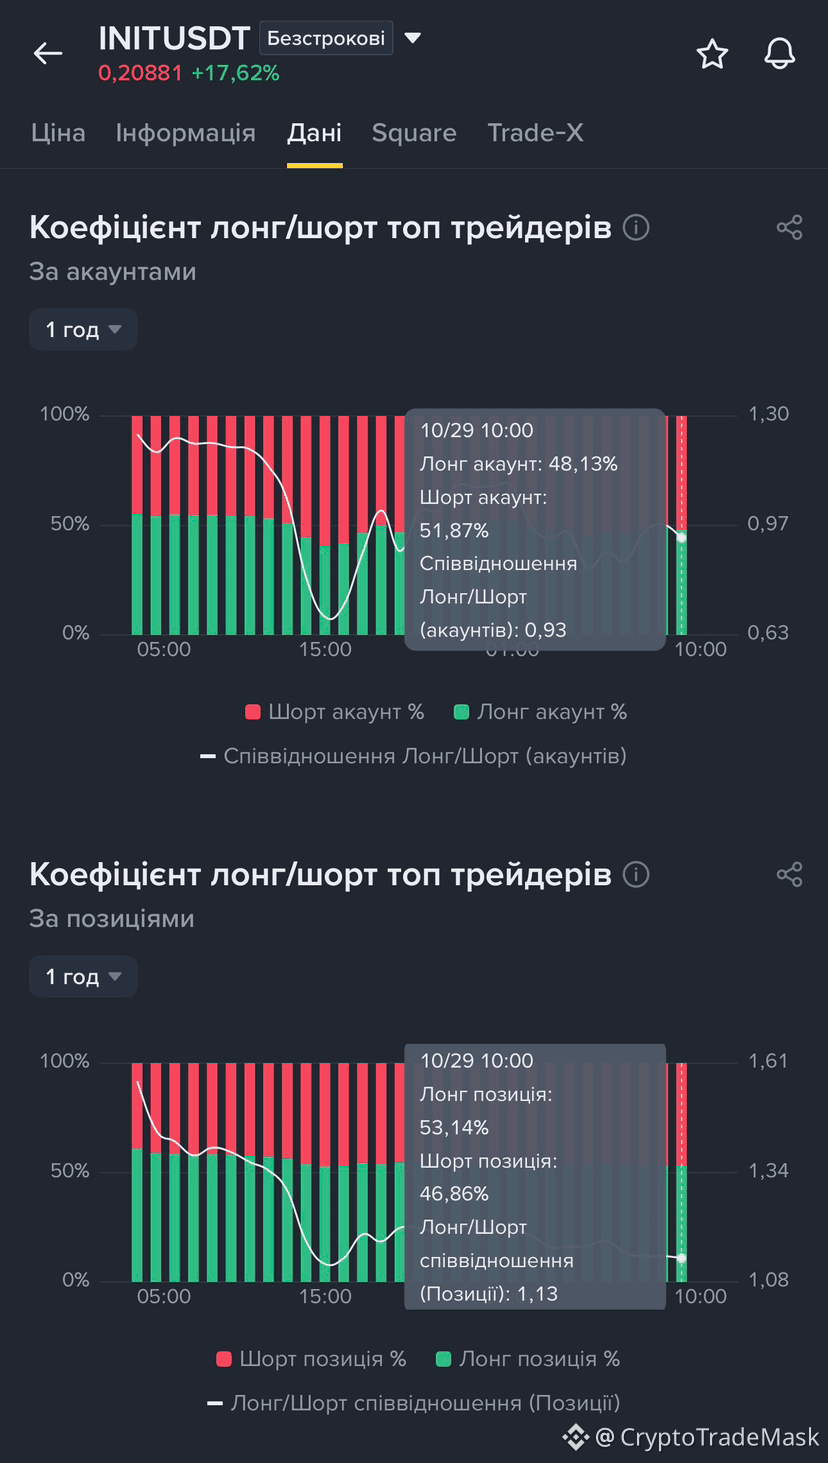
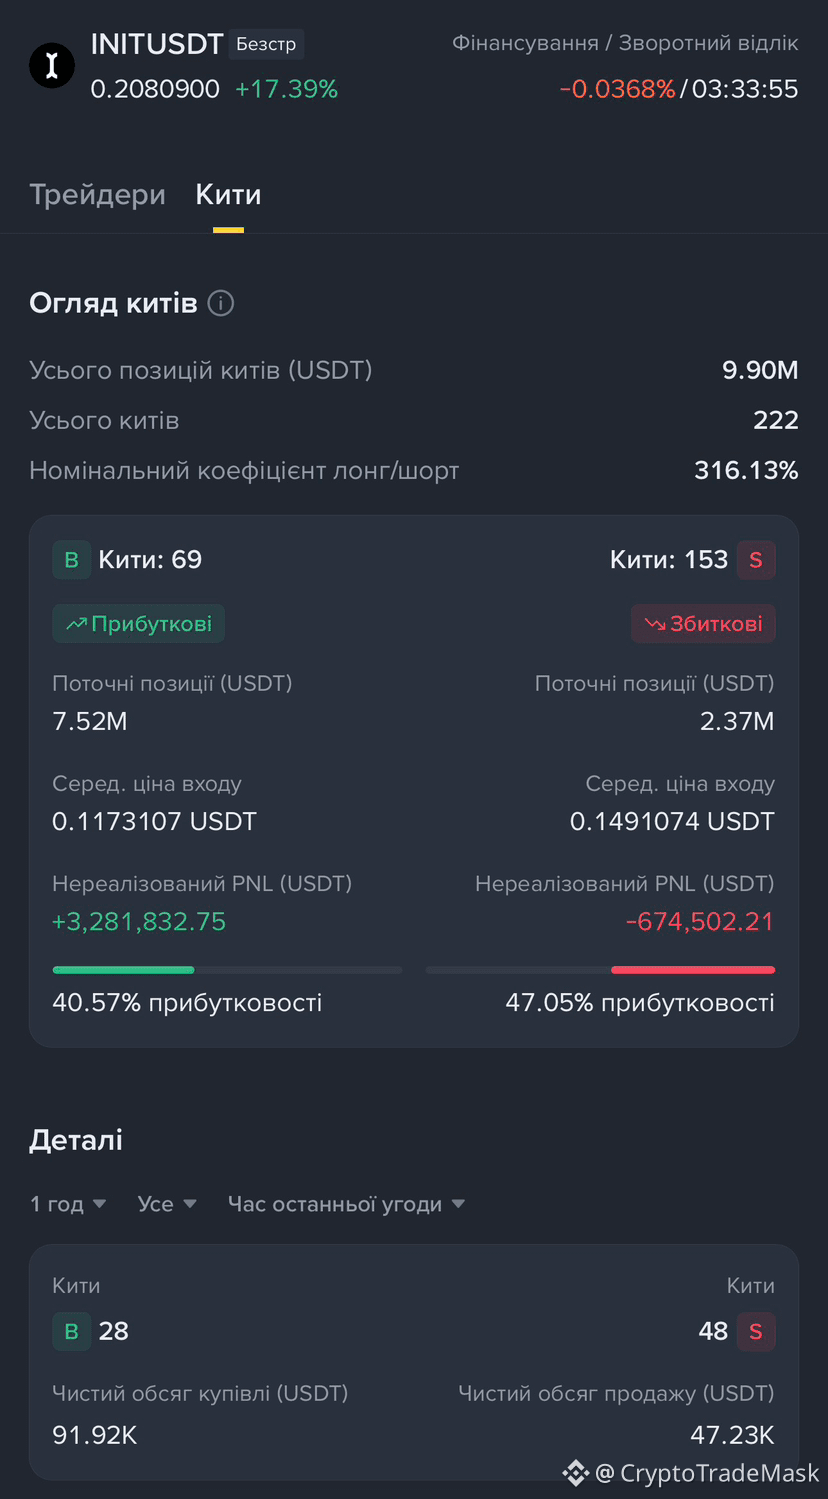
Funding is negative (-0.036%); the crowd is heavily shorting the market, while large players ("whales") hold profitable long positions. These are classic conditions for a sharp short squeeze.
Volume charts show massive spikes (170M), signaling the climax of the current momentum.
🚦 Trading Ideas:
🟢 Long: On a pullback to the 0.190 – 0.195 USDT zone, or upon a breakout above 0.215 USDT. Potential targets: 0.240 – 0.275 USDT.
🔴 Short (Risky): Only on a rejection from the 0.240 – 0.260 USDT resistance zone, with a stop-loss above 0.278 USDT—trading against the trend.
⚠️ Exercise caution; volatility is extreme—make sure to use stop-losses!
{future}(INITUSDT)
📈 $INIT /USDT: A Parabolic Surge and a Trap for Shorts!
The coin is showing a powerful upward move, breaking through local highs and holding near the 0.209 USDT mark.
📊 What the data says:
Open Interest has surged to 76.25M, confirming the intense market interest.
Funding is negative (-0.036%); the crowd is heavily shorting the market, while large players ("whales") hold profitable long positions. These are classic conditions for a sharp short squeeze.
Volume charts show massive spikes (170M), signaling the climax of the current momentum.
🚦 Trading Ideas:
🟢 Long: On a pullback to the 0.190 – 0.195 USDT zone, or upon a breakout above 0.215 USDT. Potential targets: 0.240 – 0.275 USDT.
🔴 Short (Risky): Only on a rejection from the 0.240 – 0.260 USDT resistance zone, with a stop-loss above 0.278 USDT—trading against the trend.
⚠️ Exercise caution; volatility is extreme—make sure to use stop-losses!
148
#etf
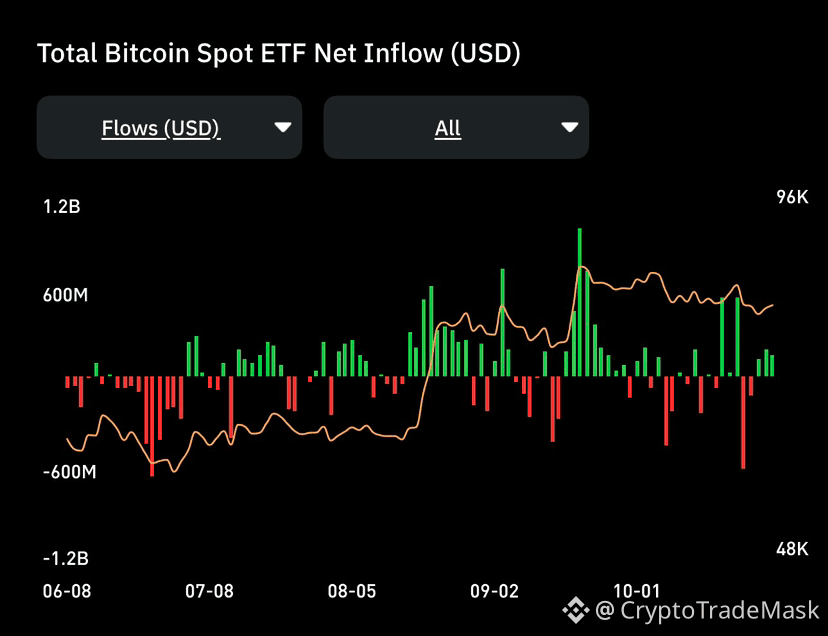
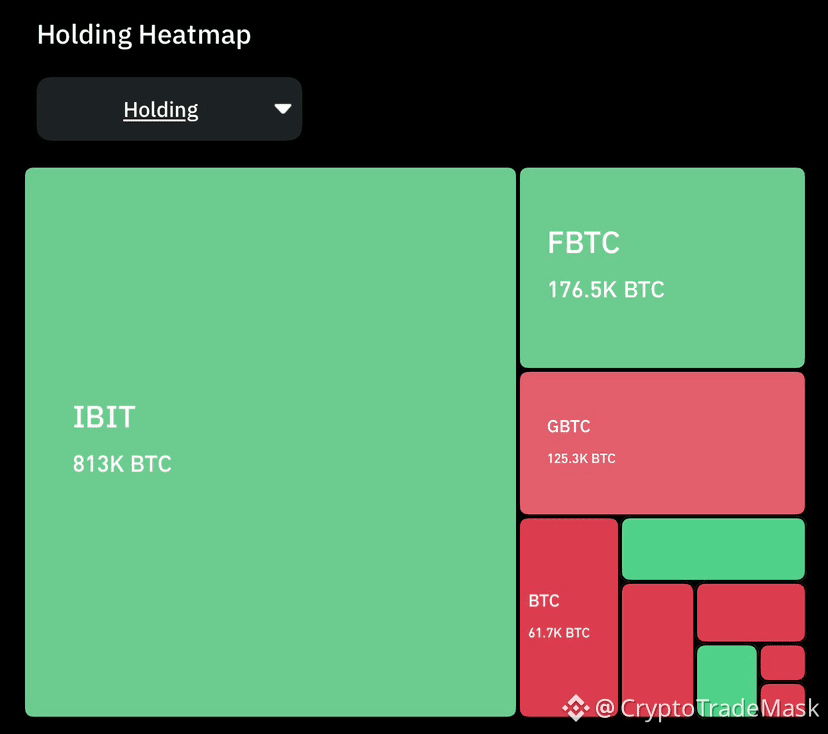
🚀 Bitcoin ETFs Rebound, Pulling October Back into the Green!
US spot Bitcoin ETFs have extended their inflow streak to three days, pulling October back into positive net territory with just two trading sessions left in the month!
📊 Key Highlights:
➡️ Bitcoin Inflows: BTC ETFs attracted $137 million on Wednesday, pushing 3-day total inflows to roughly $424 million and October's net inflows to $111 million (recovering from a deep late-month slump).
➡️ Fed Decision: The rebound coincided with the US Federal Reserve keeping interest rates unchanged at 3.75% – 4%, while Fed Chair Kevin Warsh noted inflation remains above the 2% target.
➡️ Market Outlook: Bitget analyst Lewis Huang notes that with limited new direction from the Fed, BTC's near-term moves will likely depend on Treasury yields, dollar fluctuations, and broader risk sentiment.
Current Prices & Sentiment:
#bitcoin ($BTC ): Trading around $79,848 (down ~1% in 24h).
Crypto Fear & Greed Index: Holding steady at 51 ("Neutral").
#ether ($ETH ): ETFs faced another $21 million in outflows, bringing October's net outflows for ETH to $1.35 billion, with Ether trading at $2,310 (down 1.7%).
{future}(ETHUSDT)
{future}(BTCUSDT)
#etf
🚀 Bitcoin ETFs Rebound, Pulling October Back into the Green!
US spot Bitcoin ETFs have extended their inflow streak to three days, pulling October back into positive net territory with just two trading sessions left in the month!
📊 Key Highlights:
➡️ Bitcoin Inflows: BTC ETFs attracted $137 million on Wednesday, pushing 3-day total inflows to roughly $424 million and October's net inflows to $111 million (recovering from a deep late-month slump).
➡️ Fed Decision: The rebound coincided with the US Federal Reserve keeping interest rates unchanged at 3.75% – 4%, while Fed Chair Kevin Warsh noted inflation remains above the 2% target.
➡️ Market Outlook: Bitget analyst Lewis Huang notes that with limited new direction from the Fed, BTC's near-term moves will likely depend on Treasury yields, dollar fluctuations, and broader risk sentiment.
Current Prices & Sentiment:
#bitcoin ($BTC ): Trading around $79,848 (down ~1% in 24h).
Crypto Fear & Greed Index: Holding steady at 51 ("Neutral").
#ether ($ETH ): ETFs faced another $21 million in outflows, bringing October's net outflows for ETH to $1.35 billion, with Ether trading at $2,310 (down 1.7%).
1
80
#GrowthFall
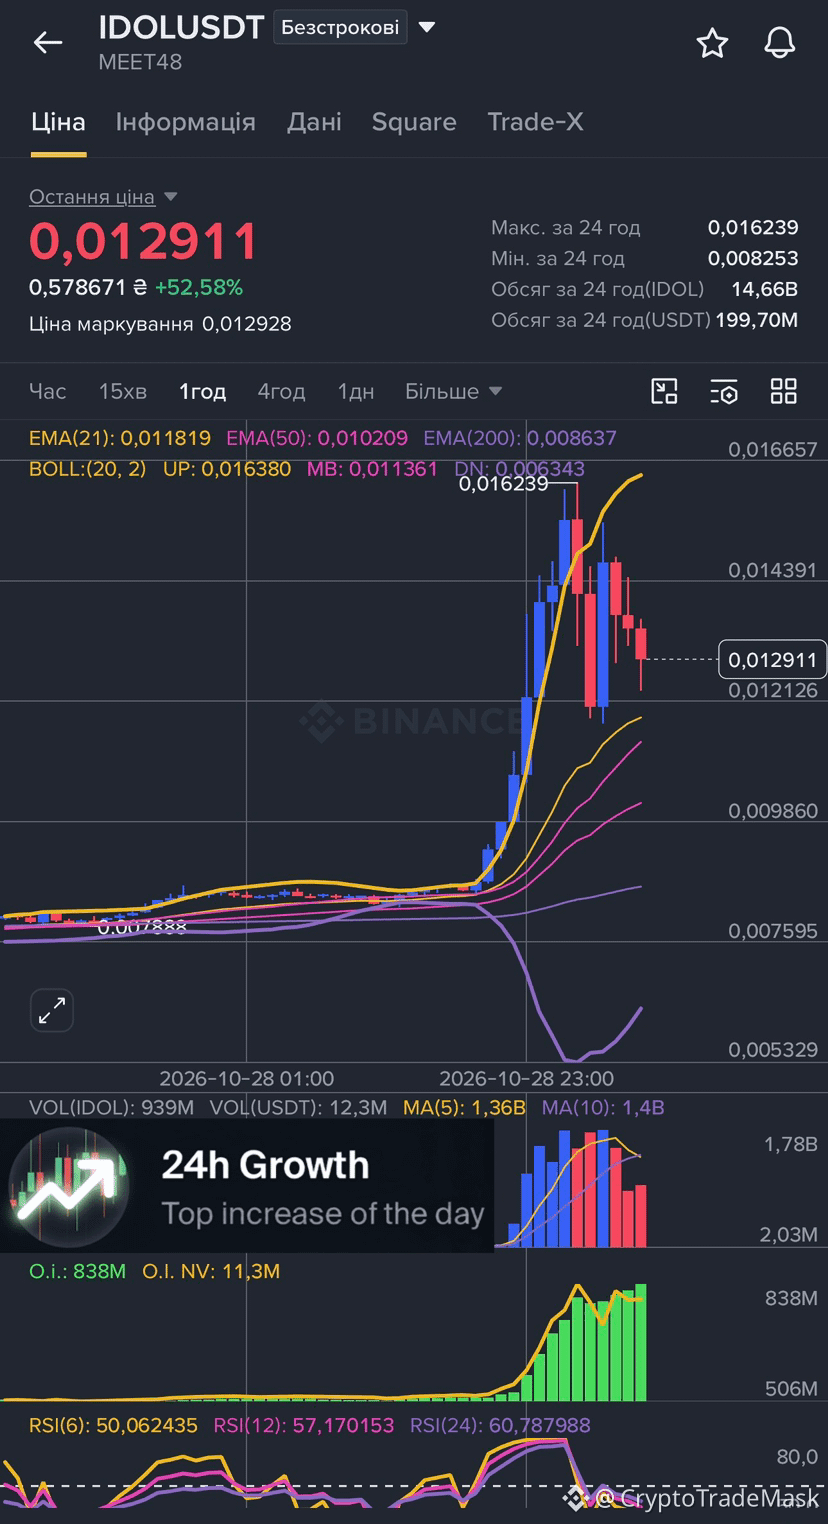
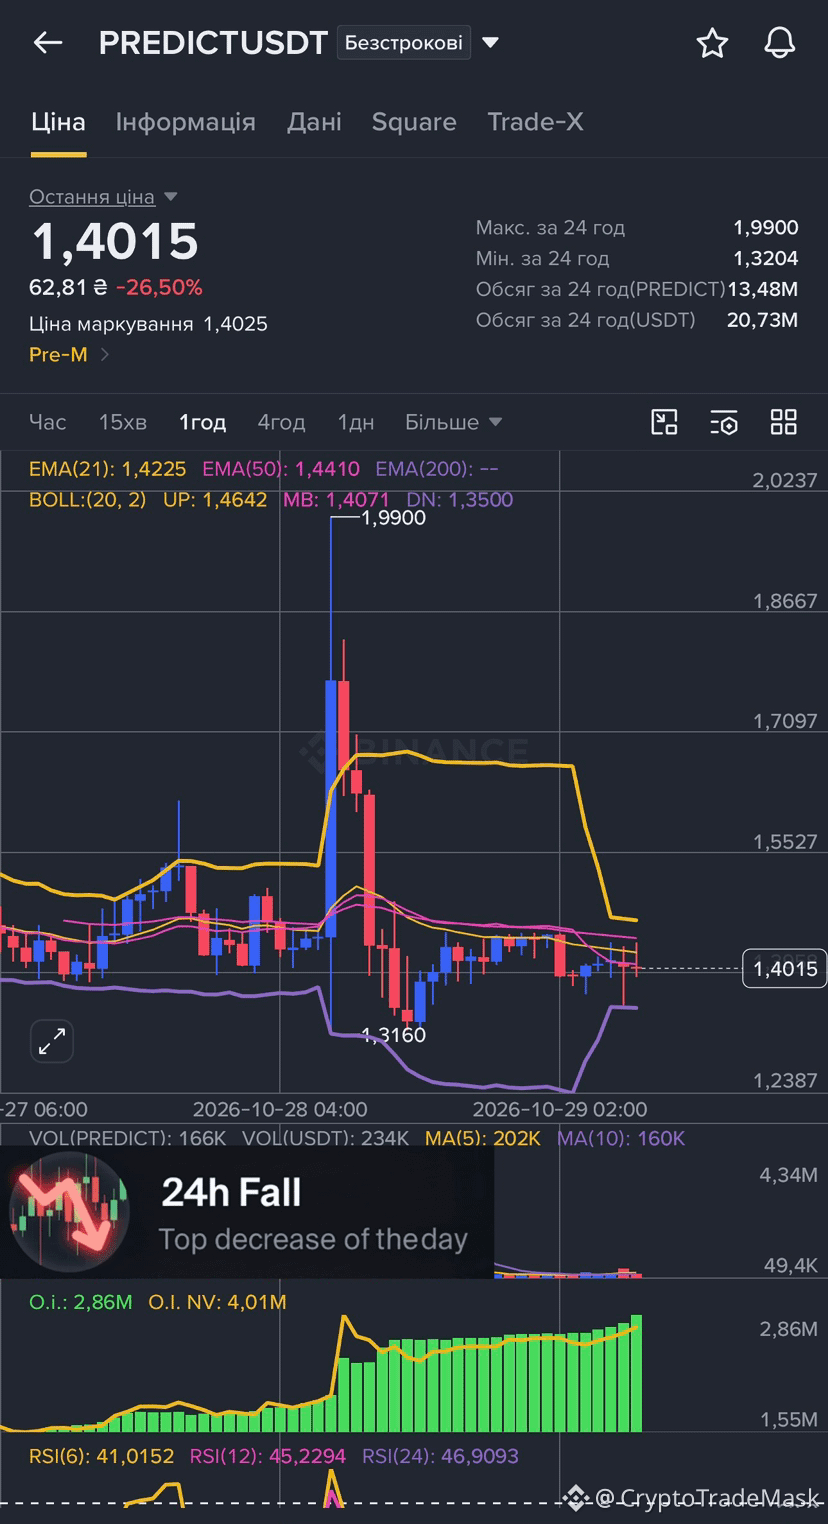
📈⏱️ Growth/Fall 24h 📉
📊 Futures Market Update 📊
$IDOL $PREDICT
🚀 Over the past 24 hours, the market has shown strong fluctuations.
🔻 Some coins fell, others gave rapid growth - volatility at its maximum.
⚠️ Reminder:
• High volatility = high risk = potentially large profits.
• Always set a stop-loss.
• Risk management is the key to stable trading.
💹 Keep your finger on the pulse of the market! DYOR
{future}(PREDICTUSDT)
{future}(IDOLUSDT)
#GrowthFall
📈⏱️ Growth/Fall 24h 📉
📊 Futures Market Update 📊
$IDOL $PREDICT
🚀 Over the past 24 hours, the market has shown strong fluctuations.
🔻 Some coins fell, others gave rapid growth - volatility at its maximum.
⚠️ Reminder:
• High volatility = high risk = potentially large profits.
• Always set a stop-loss.
• Risk management is the key to stable trading.
💹 Keep your finger on the pulse of the market! DYOR
1
78
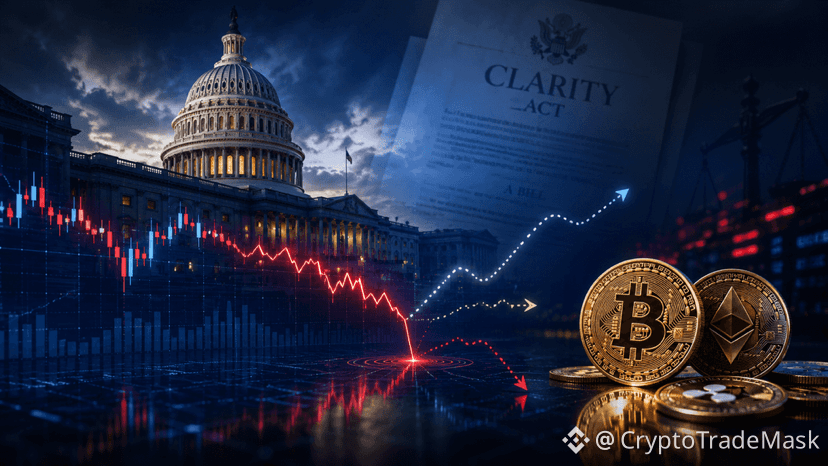
#CLARITYAct ❓
🏛 What’s the Status of the Clarity Act? The Fate of the U.S.’s Key Crypto Bill
$BTC $ETH $SOL
The long-awaited legislation for regulating the crypto market-the Digital Asset Market Clarity Act-is currently on hold. Why has the bill stalled, and what comes next?
❓ What happened? In September, the bill failed to pass a procedural vote in the Senate (49 votes in favor to 50 against; it fell short of the 60 votes required).
1️⃣ Key Stumbling Blocks: The controversy did not center on blockchain technology itself. Instead, the sticking points involved ethical standards (regarding the crypto holdings of government officials) and the issue of interest payments (yield) on stablecoins-a practice strongly opposed by traditional banks.
2️⃣ Is the Bill Dead? Formally, the bill has not been definitively rejected. However, due to the approaching elections and ongoing political debates, substantive discussion has been pushed back to early 2027, following the convening of the new Congress.
3️⃣ What Does This Mean for the Market Right Now? Until a comprehensive law is enacted, the "rules of the game" in the U.S. continue to be shaped by court rulings and ongoing guidance from regulators (the SEC and CFTC), leaving a degree of uncertainty for investors.
⚠️ We are keeping a close eye on the political landscape in the U.S., as this will determine when the crypto market finally gains a clear, transparent legislative framework. 📊
{future}(SOLUSDT)
{future}(ETHUSDT)
{future}(BTCUSDT)
#CLARITYAct ❓
🏛 What’s the Status of the Clarity Act? The Fate of the U.S.’s Key Crypto Bill
$BTC $ETH $SOL
The long-awaited legislation for regulating the crypto market-the Digital Asset Market Clarity Act-is currently on hold. Why has the bill stalled, and what comes next?
❓ What happened? In September, the bill failed to pass a procedural vote in the Senate (49 votes in favor to 50 against; it fell short of the 60 votes required).
1️⃣ Key Stumbling Blocks: The controversy did not center on blockchain technology itself. Instead, the sticking points involved ethical standards (regarding the crypto holdings of government officials) and the issue of interest payments (yield) on stablecoins-a practice strongly opposed by traditional banks.
2️⃣ Is the Bill Dead? Formally, the bill has not been definitively rejected. However, due to the approaching elections and ongoing political debates, substantive discussion has been pushed back to early 2027, following the convening of the new Congress.
3️⃣ What Does This Mean for the Market Right Now? Until a comprehensive law is enacted, the "rules of the game" in the U.S. continue to be shaped by court rulings and ongoing guidance from regulators (the SEC and CFTC), leaving a degree of uncertainty for investors.
⚠️ We are keeping a close eye on the political landscape in the U.S., as this will determine when the crypto market finally gains a clear, transparent legislative framework. 📊
1
140
#fomc
🇺🇸 ФРС США взяла паузу щодо процентної ставки
$BTC $ENA $SUI
За підсумками засідання FOMC (28 жовтня 2026 року) регулятор залишив базову ставку незмінною в діапазоні 3,75–4,00%.
📊 Головні деталі:
➡️ Розкол у Комітеті: Рішення ухвалене голосуванням 10 проти 2. Двоє членів виступали за підвищення на 25 б.п. через інфляційні ризики.
➡️ Причина: Інфляція все ще перевищує цільові 2% (у вересні — близько 3,7%), тому ФРС бере час на оцінку подальших даних.
➡️ Ракція ринку: Ринки зустріли паузу стримано, оскільки вона повністю збігалася з прогнозами.
{future}(SUIUSDT)
{future}(ENAUSDT)
{future}(BTCUSDT)
#fomc
🇺🇸 ФРС США взяла паузу щодо процентної ставки
$BTC $ENA $SUI
За підсумками засідання FOMC (28 жовтня 2026 року) регулятор залишив базову ставку незмінною в діапазоні 3,75–4,00%.
📊 Головні деталі:
➡️ Розкол у Комітеті: Рішення ухвалене голосуванням 10 проти 2. Двоє членів виступали за підвищення на 25 б.п. через інфляційні ризики.
➡️ Причина: Інфляція все ще перевищує цільові 2% (у вересні — близько 3,7%), тому ФРС бере час на оцінку подальших даних.
➡️ Ракція ринку: Ринки зустріли паузу стримано, оскільки вона повністю збігалася з прогнозами.
2
268
#SHELL
🚀 Market Overview: MyShell Token ($SHELL )
Over the past 24 hours, the MyShell token ($SHELL ) has shown a notable increase of 12.59%, reaching a price of $0.0263. Let’s break down the key factors and metrics shaping the current situation.
1️⃣ Trading Activity
Volume Dynamics: Market activity shows sharp fluctuations-a 40% surge in trading volume was recorded over the last 24 hours, indicating strong interest from traders.
Whale Behavior: Large holders ("whales") remain active, adapting to current market conditions and price fluctuations.
Overall Trend: Despite intraday volatility, the asset has gained 9.26% over the past 24 hours.
2️⃣ Liquidity and Capitalization
Liquidity Volume: This figure has reached $22.7 million, representing a substantial 339% increase.
Turnover Ratio: A volume-to-capitalization ratio of 1.89 points to strong market activity.
Investor Outlook: Market metrics remain attractive-both for short-term speculation and for monitoring medium-term prospects.
3️⃣ Technical Analysis and Forecasts
Current Levels: The price has stabilized near $0.025, with the potential to test resistance at the $0.028 mark. Support Zones: In the event of a correction, the key levels for buyers are $0.024 and $0.022.
Strategy: Experts advise managing risks and keeping an eye on the $0.024 level as a potential point for protecting positions.
⚠️ Conclusion:
SHELL shows high potential and is attracting market attention. However, remember to manage your risks and conduct your own research (DYOR) before making any investment decisions.
{future}(SHELLUSDT)
#SHELL
🚀 Market Overview: MyShell Token ($SHELL )
Over the past 24 hours, the MyShell token ($SHELL ) has shown a notable increase of 12.59%, reaching a price of $0.0263. Let’s break down the key factors and metrics shaping the current situation.
1️⃣ Trading Activity
Volume Dynamics: Market activity shows sharp fluctuations-a 40% surge in trading volume was recorded over the last 24 hours, indicating strong interest from traders.
Whale Behavior: Large holders ("whales") remain active, adapting to current market conditions and price fluctuations.
Overall Trend: Despite intraday volatility, the asset has gained 9.26% over the past 24 hours.
2️⃣ Liquidity and Capitalization
Liquidity Volume: This figure has reached $22.7 million, representing a substantial 339% increase.
Turnover Ratio: A volume-to-capitalization ratio of 1.89 points to strong market activity.
Investor Outlook: Market metrics remain attractive-both for short-term speculation and for monitoring medium-term prospects.
3️⃣ Technical Analysis and Forecasts
Current Levels: The price has stabilized near $0.025, with the potential to test resistance at the $0.028 mark. Support Zones: In the event of a correction, the key levels for buyers are $0.024 and $0.022.
Strategy: Experts advise managing risks and keeping an eye on the $0.024 level as a potential point for protecting positions.
⚠️ Conclusion:
SHELL shows high potential and is attracting market attention. However, remember to manage your risks and conduct your own research (DYOR) before making any investment decisions.
1
258
#BLUR
Market Overview: What’s Happening with Blur ($BLUR )?
Over the past 24 hours, the Blur ($BLUR ) token has fallen by 17.45% and is currently trading at $0.00857. Despite this, market activity remains high.
📊 Key Metrics and News:
➡️ Trading Volume: Over the last 24 hours, volume has surged by 133.91%, reaching $121.9 million. Meanwhile, the volume-to-market-cap ratio stands at 4.87, indicating high liquidity and active trader participation.
➡️ Market Context: The token's movement is largely influenced by overall market sentiment and the performance of Bitcoin, which has seen a 0.96% correction while holding near the $81,400 level.
➡️ Technical Analysis: BLUR is currently trading near the support level of $0.0080, with immediate resistance located at $0.0095. Additionally, the 30-day Simple Moving Average (SMA) sits at $0.0078.
⚠️ Mind the Risks: The cryptocurrency market is highly volatile; therefore, conduct thorough analysis of assets before making any investment decisions.
{future}(BLURUSDT)
#BLUR
Market Overview: What’s Happening with Blur ($BLUR )?
Over the past 24 hours, the Blur ($BLUR ) token has fallen by 17.45% and is currently trading at $0.00857. Despite this, market activity remains high.
📊 Key Metrics and News:
➡️ Trading Volume: Over the last 24 hours, volume has surged by 133.91%, reaching $121.9 million. Meanwhile, the volume-to-market-cap ratio stands at 4.87, indicating high liquidity and active trader participation.
➡️ Market Context: The token's movement is largely influenced by overall market sentiment and the performance of Bitcoin, which has seen a 0.96% correction while holding near the $81,400 level.
➡️ Technical Analysis: BLUR is currently trading near the support level of $0.0080, with immediate resistance located at $0.0095. Additionally, the 30-day Simple Moving Average (SMA) sits at $0.0078.
⚠️ Mind the Risks: The cryptocurrency market is highly volatile; therefore, conduct thorough analysis of assets before making any investment decisions.
1
239
#bitcoin
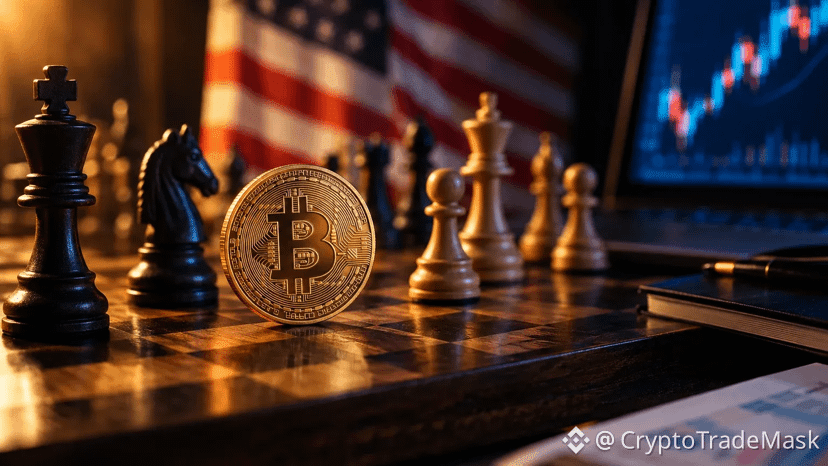
🚀 Is Bitcoin gearing up for a major surge? Key updates ahead of the FOMC meeting!
Bitcoin has once again captured the market's attention: the leading cryptocurrency has gained 2% over the past 24 hours, briefly reclaiming the $81,000 mark. With the FOMC meeting on the horizon, market sentiment has diverged sharply.
What are the bulls saying, and what do the bears fear? Let’s break down the key signals:
📈 The Bullish Case: Why are some expecting a rally?
➡️ Reclaiming the 50-day EMA: $BTC is back above this key moving average, driven by strong spot demand. Analysts view this as an "initial sign of strength" from buyers.
➡️ Massive exchange outflows: Over $1 billion has been moved from trading platforms into self-custody wallets in the last 24 hours. Experts suggest this could lead to a potential "supply shock."
➡️ Whale bets: A mysterious investor opened a massive $72.1 million long position with 30x leverage, fueling speculation about potential insider confidence regarding the Federal Reserve's upcoming decision.
📉 The Bearish Risks: Why should you exercise caution?
➡️ Profit-taking: According to analyst Ali Martinez, "whales" have recently locked in approximately $156 million in profits, with their total holdings decreasing by 8,162 $BTC .
➡️ Negative Coinbase Premium: The index has fallen to -0.17, indicating weaker demand from U.S. investors.
➡️ Technical Levels: Key support lies near $81,000. If this level fails to hold, the price could dip lower; meanwhile, for a genuine breakout, the bulls need to overcome resistance at $84,500.
⚠️ Summary: Everything hinges on today’s volatility surrounding the Fed meeting. Will we see a push toward $92,000+, or are we in for a deep retest of support?
{future}(BTCUSDT)
#bitcoin
🚀 Is Bitcoin gearing up for a major surge? Key updates ahead of the FOMC meeting!
Bitcoin has once again captured the market's attention: the leading cryptocurrency has gained 2% over the past 24 hours, briefly reclaiming the $81,000 mark. With the FOMC meeting on the horizon, market sentiment has diverged sharply.
What are the bulls saying, and what do the bears fear? Let’s break down the key signals:
📈 The Bullish Case: Why are some expecting a rally?
➡️ Reclaiming the 50-day EMA: $BTC is back above this key moving average, driven by strong spot demand. Analysts view this as an "initial sign of strength" from buyers.
➡️ Massive exchange outflows: Over $1 billion has been moved from trading platforms into self-custody wallets in the last 24 hours. Experts suggest this could lead to a potential "supply shock."
➡️ Whale bets: A mysterious investor opened a massive $72.1 million long position with 30x leverage, fueling speculation about potential insider confidence regarding the Federal Reserve's upcoming decision.
📉 The Bearish Risks: Why should you exercise caution?
➡️ Profit-taking: According to analyst Ali Martinez, "whales" have recently locked in approximately $156 million in profits, with their total holdings decreasing by 8,162 $BTC .
➡️ Negative Coinbase Premium: The index has fallen to -0.17, indicating weaker demand from U.S. investors.
➡️ Technical Levels: Key support lies near $81,000. If this level fails to hold, the price could dip lower; meanwhile, for a genuine breakout, the bulls need to overcome resistance at $84,500.
⚠️ Summary: Everything hinges on today’s volatility surrounding the Fed meeting. Will we see a push toward $92,000+, or are we in for a deep retest of support?
1
283
#CriticalVulnerability
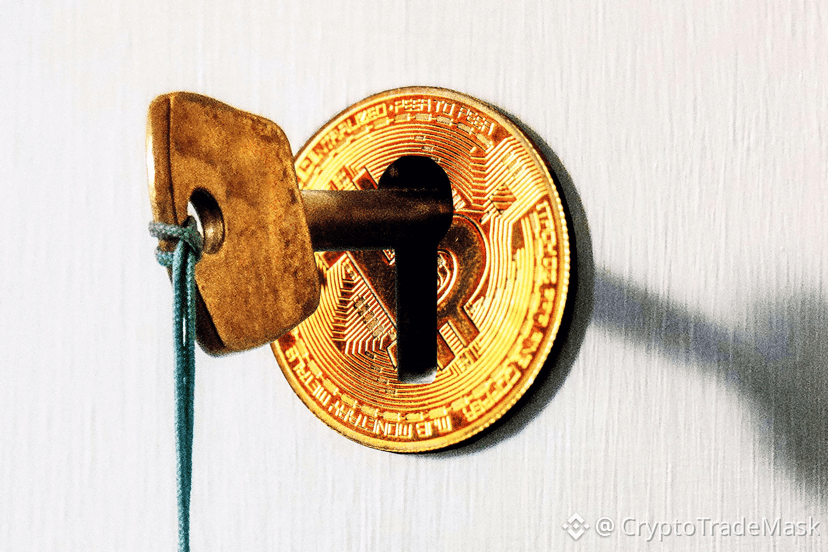
🚨 Attention $BTC application developers: critical vulnerability in “bitcoinjs-lib”
Two serious bugs have been fixed in the popular `bitcoinjs-lib` library. These flaws could cause applications to catastrophically underreport miner fees for fully valid, signed PSBT (Partially Signed Bitcoin Transaction) transactions.
What is the issue?
In Bitcoin, the fee is the difference between the sum of the inputs and the sum of the outputs. Two distinct logic errors caused the library to report a minimal fee (e.g., 200 or 1,000 satoshis), while the actual amount deducted from the wallet and paid to miners could be as high as nearly 1 BTC (900 million satoshis).
1. Conflicting Input Values: The signing process utilized the full data from the previous transaction, whereas the fee calculation module relied on a conflicting record with a lower value. While the signature remained valid, the fee calculation was incorrect.
2. Missing Input-Value Records: For finalized inputs where the amount was not specified, the library treated the value as "0." This allowed a massive actual fee to be hidden within imported transactions.
Which versions are affected? v5 series: fixed in
➡️ 5.2.2 (vulnerable: 5.1.0 – 5.2.1)
➡️ v6 series: fixed in 6.1.9 (vulnerable: 6.0.0 – 6.1.8)
➡️ v7 series: fixed in 7.0.4 (vulnerable: 7.0.0-rc.0 – 7.0.3)
What should you do?
➡️ Update to the patched versions (5.2.2, 6.1.9, 7.0.4).
➡️ If updating is not currently possible, implement independent verification of input values and reject any inconsistent entries before signing or calculating fees.
The security of your application depends on whether you blindly trust libraries or verify every single satoshi. 🛡️
{future}(BTCUSDT)
#CriticalVulnerability
🚨 Attention $BTC application developers: critical vulnerability in “bitcoinjs-lib”
Two serious bugs have been fixed in the popular `bitcoinjs-lib` library. These flaws could cause applications to catastrophically underreport miner fees for fully valid, signed PSBT (Partially Signed Bitcoin Transaction) transactions.
What is the issue?
In Bitcoin, the fee is the difference between the sum of the inputs and the sum of the outputs. Two distinct logic errors caused the library to report a minimal fee (e.g., 200 or 1,000 satoshis), while the actual amount deducted from the wallet and paid to miners could be as high as nearly 1 BTC (900 million satoshis).
1. Conflicting Input Values: The signing process utilized the full data from the previous transaction, whereas the fee calculation module relied on a conflicting record with a lower value. While the signature remained valid, the fee calculation was incorrect.
2. Missing Input-Value Records: For finalized inputs where the amount was not specified, the library treated the value as "0." This allowed a massive actual fee to be hidden within imported transactions.
Which versions are affected? v5 series: fixed in
➡️ 5.2.2 (vulnerable: 5.1.0 – 5.2.1)
➡️ v6 series: fixed in 6.1.9 (vulnerable: 6.0.0 – 6.1.8)
➡️ v7 series: fixed in 7.0.4 (vulnerable: 7.0.0-rc.0 – 7.0.3)
What should you do?
➡️ Update to the patched versions (5.2.2, 6.1.9, 7.0.4).
➡️ If updating is not currently possible, implement independent verification of input values and reject any inconsistent entries before signing or calculating fees.
The security of your application depends on whether you blindly trust libraries or verify every single satoshi. 🛡️
1
98
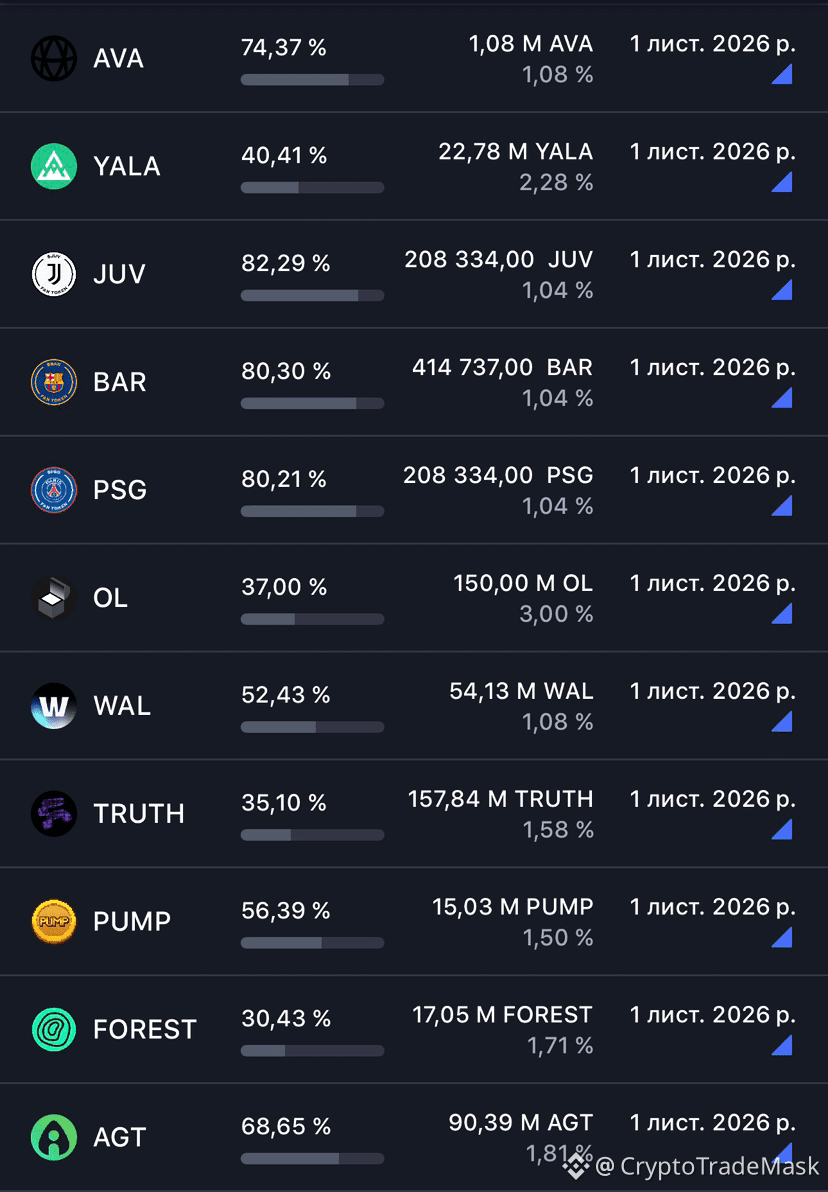
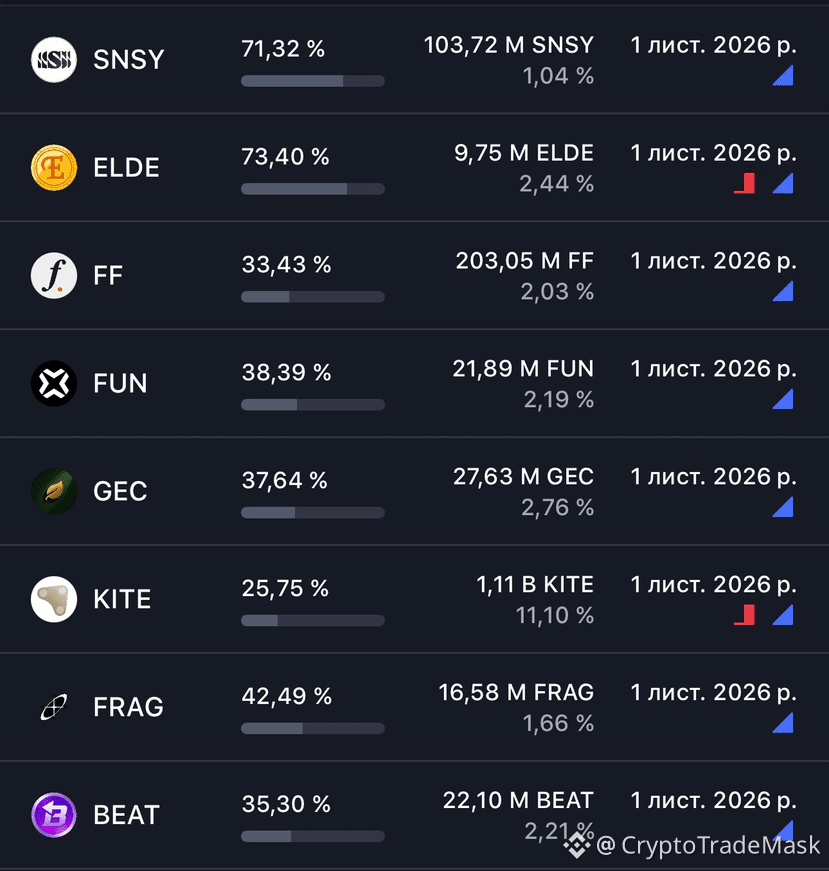
#TokenUnlock
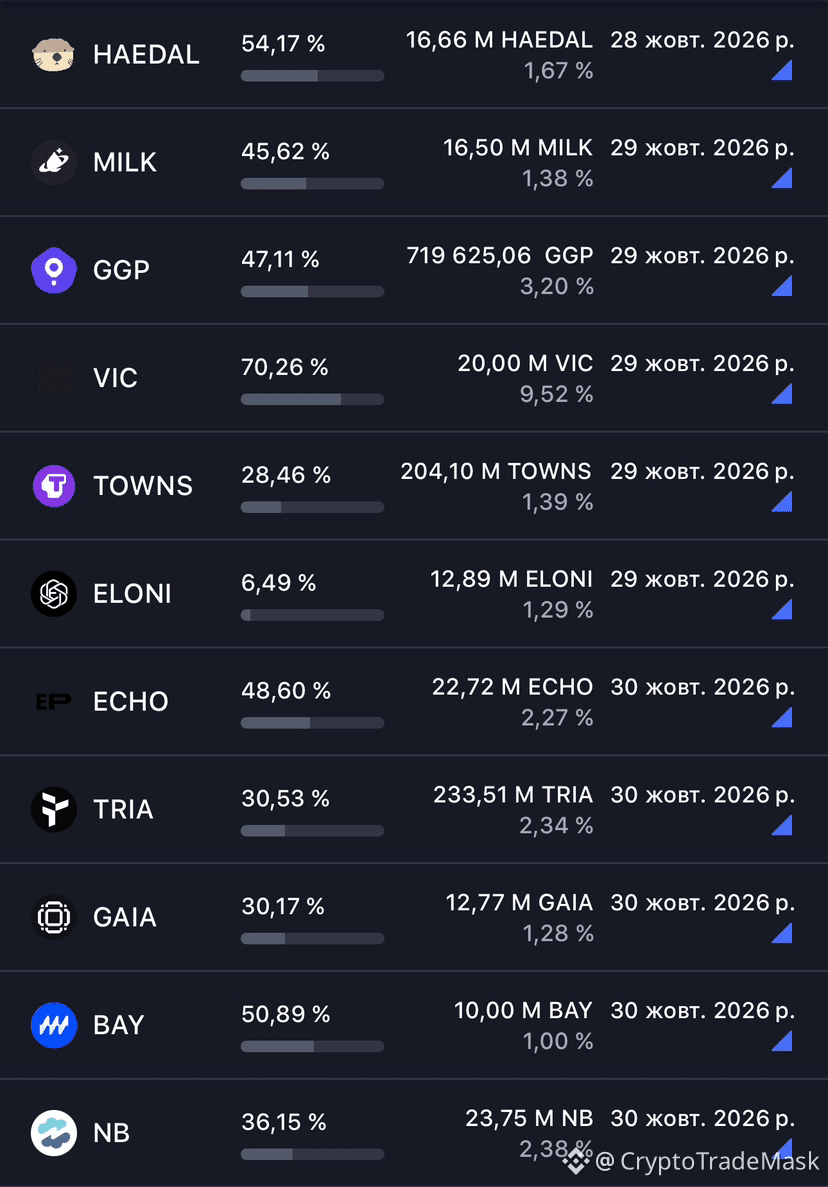
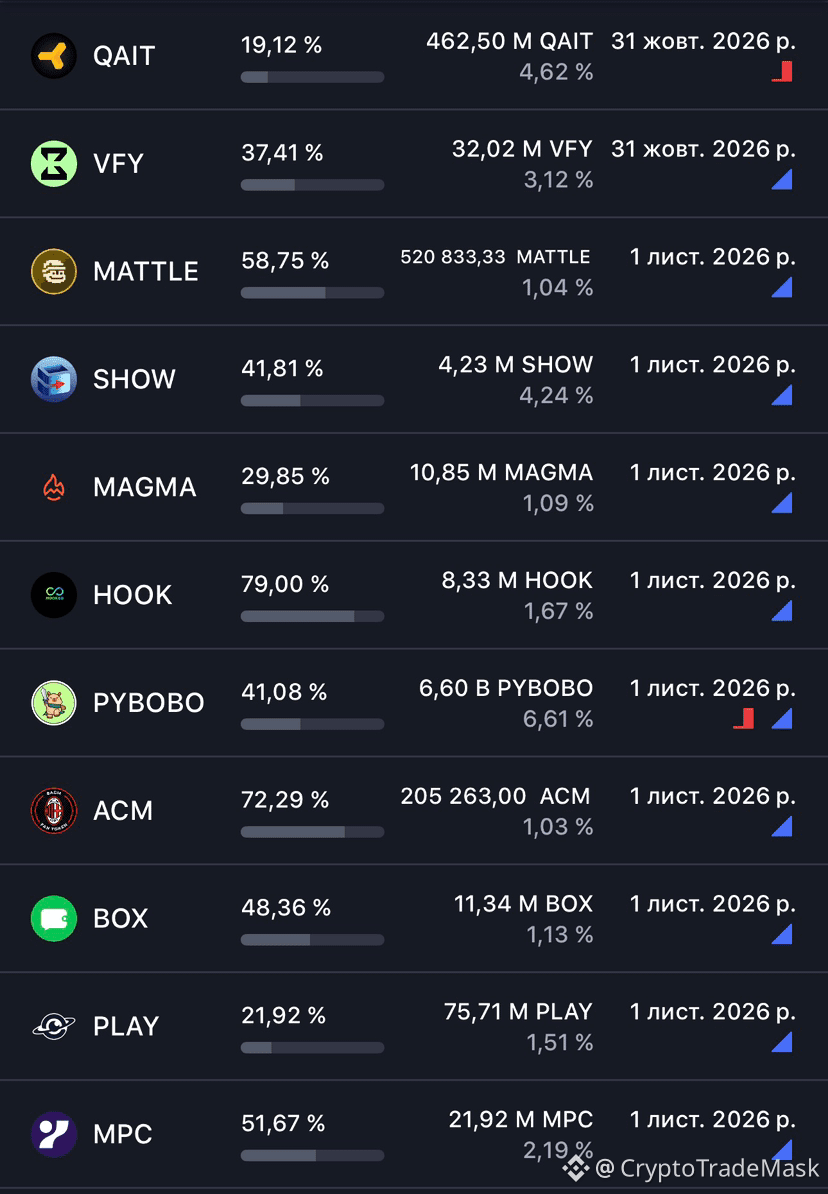
🔓 Token Unlocking - October 28 - November 2, 2026 🔓
$HAEDAL $KITE $FF
📌 What does this mean for the market?
✅ Supply growth – a new number of tokens enters free circulation.
⚖️ This can cause pressure on the price due to a possible excess supply.
📈 Investors are closely following the event, because unlocking sometimes opens up both new opportunities for accumulation and risks for short-term traders.
👀 Be prepared for increased volatility!
DYOR (Do Your Own Research) is always the right approach.
{future}(FFUSDT)
{future}(KITEUSDT)
{future}(HAEDALUSDT)
#TokenUnlock
🔓 Token Unlocking - October 28 - November 2, 2026 🔓
$HAEDAL $KITE $FF
📌 What does this mean for the market?
✅ Supply growth – a new number of tokens enters free circulation.
⚖️ This can cause pressure on the price due to a possible excess supply.
📈 Investors are closely following the event, because unlocking sometimes opens up both new opportunities for accumulation and risks for short-term traders.
👀 Be prepared for increased volatility!
DYOR (Do Your Own Research) is always the right approach.
1
311
Войдите, чтобы посмотреть больше материала
Присоединяйтесь к пользователям криптовалют по всему миру на Binance Square
⚡️ Получайте новейшую и полезную информацию о криптоактивах.
💬 Нам доверяет крупнейшая в мире криптобиржа.
👍 Получите достоверные аналитические данные от верифицированных создателей контента.
Эл. почта/номер телефона
В тренде
FedWatch
Просмотров: 16.3M
39,348 обсуждают
🚨 🇺🇸 PETER SCHIFF JUST THREW A BIG WARNING AT THE FED!
Peter Schiff is calling Kevin Warsh’s tough talk on inflation a “bluff,” and his prediction could have major implications for the markets.
Schiff believes the Fed could eventually return to money printing through quantitative easing (QE) and even cut interest rates next year, despite inflation continuing to rise.
Think about that for a moment.
🔥 Inflation could remain a problem. 🔥 The Fed could still move toward easier monetary policy. 🔥 More liquidity could flow into financial markets.
If this scenario plays out, it could create a very different market environment for stocks, gold, Bitcoin, and the wider crypto market.
But there’s a catch: if inflation stays high, the Fed could face a difficult choice between fighting rising prices and supporting the economy.
Will Warsh stick to a tough inflation policy, or will the Fed eventually change direction?
The next move could matter a lot for investors.
#FedWatch #EarningsSeason #USMidtermElections #BrazilCryptoExchangesMustApplyForLicensesByFriday #StanDruckenmillerBecomesInvestorInTradeXYZ
Jackson Liam
·Лайков: 3
·Просмотров: 8.2k
EarningsSeason
Просмотров: 6.4M
32,053 обсуждают
USMidtermElections
Просмотров: 37,090
599 обсуждают