


HM SHAHID 88
Открытая сделка
Случайный трейдер
1 г
4 подписок(и/а)
78 подписчиков(а)
105 понравилось
Посты
Портфель
Все
Цитирования

ASHFAQ NAEEM
·
--
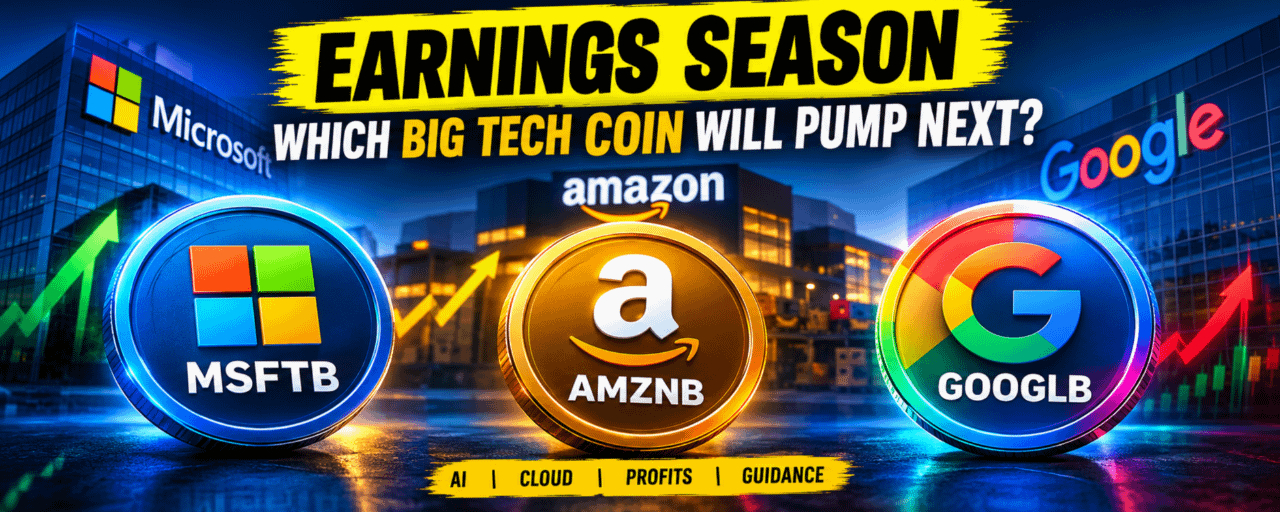
EARNINGS SEASON EXPLOSION MSFTB vs AMZNB vs GOOGLB — Which Big Tech Coin Will PUMP Next?
EARNINGS SEASON ALERT — MSFTB, AMZNB AND GOOGLB
Three Big Tech Giants, One Critical Question — Can AI Growth Justify the Cost?
Earnings season is where the market separates real business strength from hype
Microsoft, Amazon and Alphabet are entering a crucial period as investors focus on cloud growth, artificial intelligence revenue, infrastructure spending and future guidance
But here is the important detail many traders overlook
A company can report strong earnings and still see its token price fall if expectations were too high
1. MSFTB — Microsoft
Fundamental Analysis
Microsoft’s business is supported by Azure cloud computing, Microsoft 365, Copilot and enterprise AI services
In its latest reported fiscal fourth quarter for the period ended June 30 2026, Microsoft generated 90 billion dollars in revenue, up 18 percent year over year, while Microsoft Cloud revenue reached 59.3 billion dollars, up 27 percent
The major question now is whether AI demand can continue growing fast enough to justify the enormous cost of building data centers and expanding computing capacity
Investors will pay close attention to Azure growth, Copilot adoption, operating margins and capital expenditure guidance
Source Microsoft Investor Relations
Technical Analysis
Latest available Binance token data showed MSFTB near 523.33 USDT, down approximately 0.23 percent over 24 hours
The token was trading below its short term moving average according to the available technical snapshot, with momentum indicators showing weakness
Support to watch is around 521.80 USDT
A sustained hold above support followed by a recovery of short term averages could signal improving momentum
A breakdown below support would increase downside risk, while a breakout without stronger trading volume could prove unreliable
Bullish scenario: Strong earnings guidance and recovering momentum could attract buyers
Bearish scenario: Rising AI costs or disappointing cloud guidance could extend selling pressure
2. AMZNB — Amazon
Fundamental Analysis
Amazon has two major growth engines to watch during earnings season
AWS cloud computing and its advertising business
AWS demand related to AI infrastructure could support long term growth, but building data centers and purchasing computing equipment requires substantial investment
Amazon’s previously announced 2026 capital expenditure outlook of approximately 220 billion dollars makes investment efficiency a major issue for shareholders
The key question is not simply whether AWS grows
It is whether cloud revenue and operating profit can grow enough to justify the spending
Investors should monitor AWS growth, operating income, free cash flow and management’s next-quarter guidance
Technical Analysis
Latest available Binance token data showed AMZNB near 247.63 USDT, down approximately 0.52 percent over 24 hours
The available technical snapshot placed the token below its short term exponential moving averages
Support to watch is around 247.40 USDT, while the 7-period and 25-period exponential moving averages were near 247.83 and 248.65 USDT respectively
A sustained move above 248.65 with stronger volume could indicate a short term recovery
Failure to hold 247.40 would raise the risk of additional weakness
Bullish scenario: Strong AWS growth, improving profitability and a recovery above resistance could support renewed buying
Bearish scenario: Heavy investment costs combined with weaker guidance could pressure the token further
3. GOOGLB — Alphabet
Fundamental Analysis
Alphabet brings a different combination of growth opportunities through Google Search, YouTube, Google Cloud and its Gemini AI ecosystem
The central question is whether Alphabet can expand AI monetization while protecting its core advertising business
Google Cloud growth, enterprise AI demand, advertising performance and infrastructure spending will be particularly important
Investors should also watch whether AI-powered search changes advertising economics and whether new AI products generate meaningful revenue
Strong cloud demand could strengthen the long term outlook, but increasing costs or weaker advertising growth could challenge investor confidence
Technical Analysis
Latest available Binance token data showed GOOGLB near 320.57 USDT, down approximately 0.55 percent over 24 hours
The available snapshot showed weak momentum, with the token below its 25-period and 99-period exponential moving averages
The 25-period average was near 321.43 USDT and the 99-period average was near 328.01 USDT
A sustained recovery above 321.43 could be an initial improvement, while clearing 328.01 would provide a stronger technical signal
Failure to reclaim short term resistance could leave the token vulnerable to further selling
Bullish scenario: Strong Google Cloud growth and improving AI monetization could support a recovery
Bearish scenario: Advertising pressure, rising AI expenses or disappointing guidance could prolong weakness
THE THREE TOKEN COMPARISON
Microsoft offers exposure to enterprise software and cloud AI
Amazon offers exposure to AWS, e-commerce and digital advertising
Alphabet offers exposure to search advertising, YouTube, Google Cloud and AI products
All three have significant AI opportunities, but all three face the same fundamental test
Can future profits justify today’s infrastructure spending?
FINAL VERDICT
The earnings opportunity is not simply about buying whichever company reports the biggest profit
It is about identifying which business delivers the strongest combination of growth, profitability and forward guidance
For technical confirmation, watch support levels, moving average recoveries and volume rather than treating a single green candle as a breakout
Remember that MSFTB, AMZNB and GOOGLB are tokenized assets, not necessarily identical to holding conventional company shares. Check the specific product’s legal rights, redemption terms, trading hours and liquidity before making any decision
The prices and technical levels above are snapshots from the available Binance data, not live-updated chart levels. Confirm them before trading
Which one has the strongest earnings setup in your opinion — MSFTB, AMZNB or GOOGLB?
#earningsseason #BinancePick #MSFTB #AMZNB #GOOGLB
$MSFTB $AMZNB $GOOGLB
ASHFAQ NAEEM
·
--
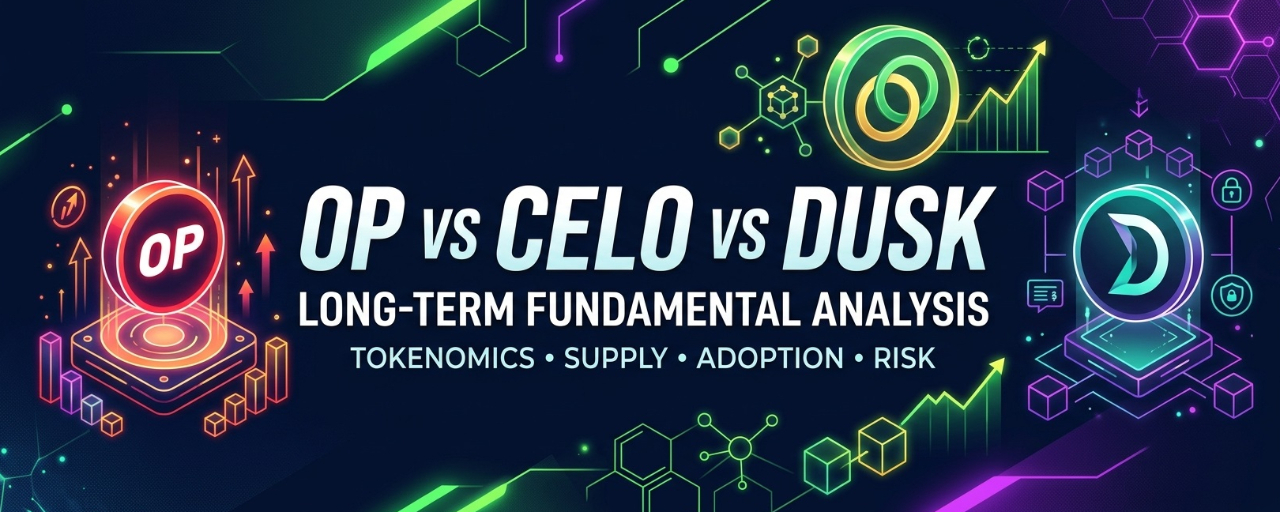
OP vs CELO vs DUSK: Which Crypto Has the Strongest Long-Term Potential?
A Fundamental Analysis of Tokenomics, Supply, Adoption and Investment Risks
The cryptocurrency market is full of projects promising future growth, but long-term investors should look beyond price movements and hype. A project's real value depends on adoption, token utility, supply dynamics and its ability to generate sustainable demand.
In this article, we compare three projects with different long-term investment theses: Optimism (OP), Celo (CELO) and Dusk (DUSK).
1. Optimism (OP) — Betting on Ethereum Scaling
Optimism is an Ethereum Layer-2 ecosystem designed to make blockchain transactions more scalable and accessible. Its OP Stack allows developers to build their own chains, while the Superchain vision aims to connect multiple chains within a shared ecosystem.
Why OP could grow:
Expansion of the Superchain ecosystem.Increasing demand for Ethereum scaling solutions.Potential improvement in token value accrual through governance and buyback mechanisms.Growing developer and application adoption.
Tokenomics and risks:
OP has an initial supply of approximately 4.295 billion tokens. Its circulating supply has continued to increase as allocations enter the market. Investors should monitor future distributions, circulating supply growth and the actual execution of any token buyback programme.
The main risk is that ecosystem growth does not automatically translate into demand for OP. Competition from other Layer-2 networks is another important factor.
Long-term outlook: OP may appeal to investors who believe Ethereum scaling and the Superchain ecosystem will continue expanding. Its investment case becomes stronger if revenue growth and token value accrual improve.
2. Celo (CELO) — Real-World Payments and Stablecoins
Celo focuses on mobile-friendly blockchain payments, stablecoins and financial accessibility. Its transition to an Ethereum Layer-2 network provides a foundation for expanding its developer and application ecosystem.
Why CELO could grow:
Greater adoption of stablecoin payments.Mobile-first financial applications.Low-cost transactions and easier access to blockchain services.Expansion of real-world payment use cases.
Tokenomics and risks:
CELO has a maximum supply of 1 billion tokens. Its circulating supply is lower than the maximum, meaning future releases and vesting schedules remain important considerations.
The biggest question is whether increased network usage will create meaningful demand for CELO itself. More stablecoin transactions do not necessarily mean that the native token's price must rise.
Long-term outlook: CELO could benefit if it demonstrates sustainable growth in active users, recurring transactions and real payment activity. Adoption metrics matter more than announcements alone.
3. Dusk (DUSK) — Privacy and Regulated Digital Finance
Dusk focuses on privacy-preserving blockchain infrastructure for regulated financial markets, including digital securities and tokenized assets.
Its long-term thesis is based on the possibility that financial institutions will increasingly use blockchain technology to issue, transfer and settle regulated assets.
Why DUSK could grow:
Expansion of tokenized securities and real-world assets.Demand for privacy alongside regulatory compliance.Network utility through transaction fees and staking.Potential institutional adoption of blockchain-based financial infrastructure.
Tokenomics and risks:
DUSK's tokenomics include a long-term issuance schedule, with a maximum supply of up to 1 billion tokens according to its published tokenomics documentation. Future emissions can create selling pressure if network adoption does not grow fast enough.
Its key risks include regulatory uncertainty, competition, limited liquidity and the possibility that announced partnerships fail to generate significant real-world activity.
Long-term outlook: DUSK offers exposure to a specialized sector with potential upside, but its success depends heavily on real institutional adoption, actual settlement activity and sustainable token demand.
4. Fundamental Comparison
OP: Focuses on Ethereum scaling and the Superchain ecosystem.
CELO: Focuses on payments, stablecoins and mobile financial services.
DUSK: Focuses on privacy-preserving infrastructure and regulated digital assets.
Each project has a different path to growth. OP must demonstrate that ecosystem expansion benefits token holders. CELO needs to prove sustained payment adoption and native-token demand. DUSK must convert its institutional-finance vision into measurable network activity.
5. What Long-Term Investors Should Monitor
Before investing, track these indicators:
OP: Superchain revenue, buyback execution, circulating supply and ecosystem activity.CELO: Stablecoin usage, active users, recurring payments and token unlocks.DUSK: Real asset issuance, network fees, staking, emissions and institutional adoption.
Market capitalization alone does not determine future returns. A smaller market cap may offer greater upside potential, but it can also come with lower liquidity, higher volatility and greater execution risk.
Final Verdict
There is no guaranteed winner among OP, CELO and DUSK.
OP is an infrastructure-focused investment thesis. CELO is a payments and stablecoin adoption thesis. DUSK is a specialized regulated-finance thesis with potentially higher execution risk.
The most important question is not which token is cheapest today, but which project can create sustainable demand for its token while managing future supply.
Always conduct independent research, verify current tokenomics and unlock schedules, and never invest more than you can afford to lose.
Disclaimer: This article is for educational purposes only and is not financial advice. Cryptocurrency investments carry substantial risk.
#OP #CELO #dusk #BinanceSquare #Write2Earn $OP $CELO $DUSK
ASHFAQ NAEEM
·
--
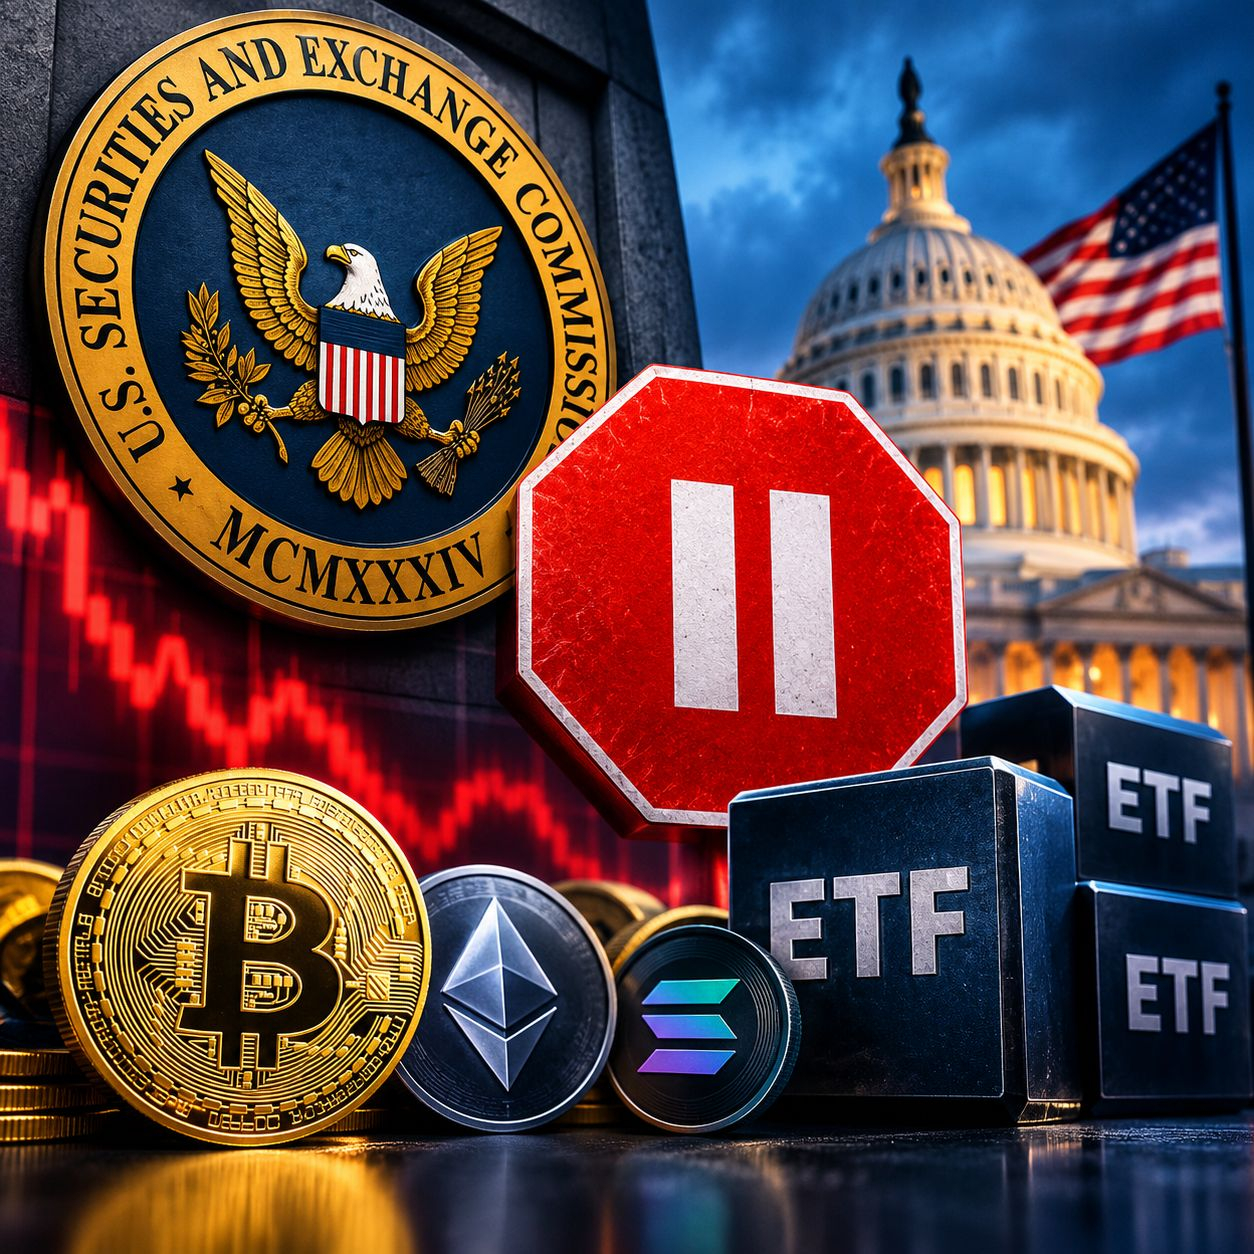
🚨 SEC HALTS CRYPTO ETF REVIEWS
The U.S. SEC has reportedly paused crypto ETF reviews amid a federal funding lapse, potentially delaying decisions on several pending digital-asset investment products. The disruption could slow institutional access to crypto and create short-term uncertainty for issuers and traders.
With ETF approvals already a major catalyst for Bitcoin and altcoins, any prolonged delay could pressure market sentiment and postpone fresh capital inflows.
Could this delay trigger another crypto market shake-up? 👀
#sechaltscryptoetfreviewsamidfundinglapse
$BTC #CryptoNews $ETH #BinanceSquare $SOL
ASHFAQ NAEEM
·
--
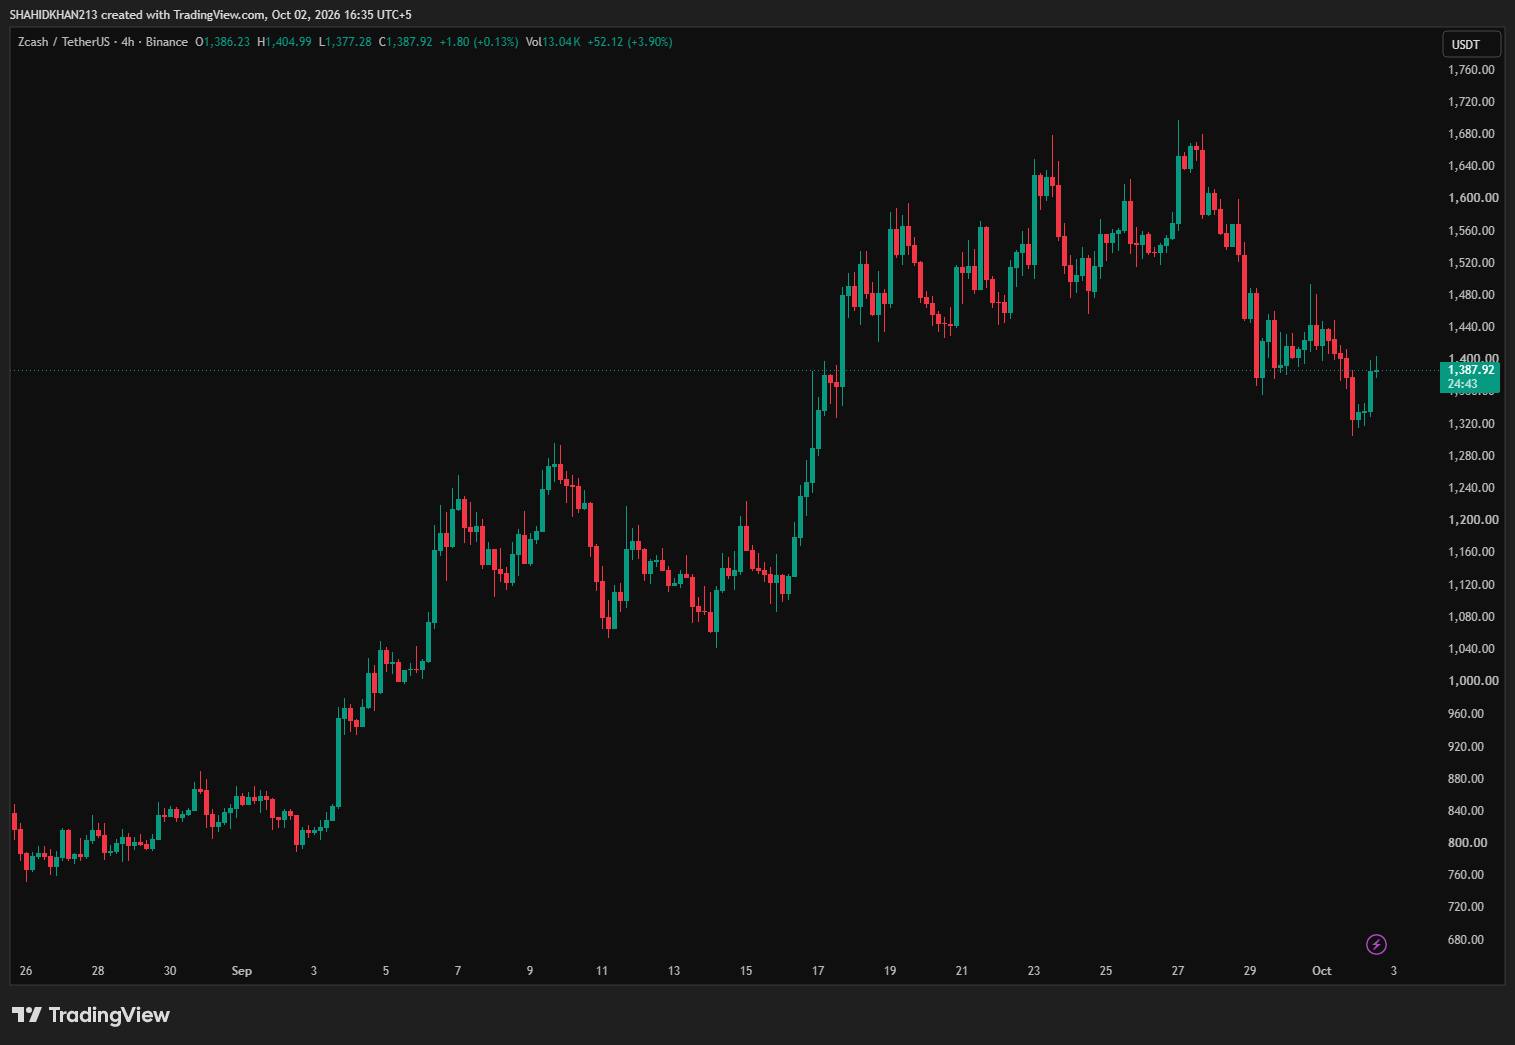
#zcashfalls21%fromseptemberpeak
Zcash ($ZEC ) has pulled back sharply after its explosive September rally, falling about 21% from the late-September peak near $1,698. On October 1, ZEC dropped more than 7%, trading around $1,335 at the time.
📉 What’s driving the pullback?
💰 ETF outflows: Grayscale’s Zcash ETF recorded about $30.25M in net outflows on September 30.
🔥 Profit-taking: $ZEC had rallied roughly 253% from its late-August/early-September base, making a correction unsurprising after such a vertical move.
⚠️ Market uncertainty: Concerns surrounding stolen crypto moving through privacy-focused networks have also added pressure to sentiment.
The key question now: Is this simply a cooldown after a massive rally, or the start of a deeper correction? 👀
$ZEC



Войдите, чтобы посмотреть больше материала