

KanT Crypto
4.5k Публикации

KanT Crypto
Отправить жалобу
Заблокировать пользователя
Decoding Politics. Tracking Crypto. Real-time news. 100% Signal with 0% Noise.
Открытая сделка

Владелец BNB
Трейдер с регулярными сделками
1.2 г
125 подписок(и/а)
1.7K+ подписчиков(а)
8.3K+ понравилось
Посты
Портфель
Все
Цитирования
Видео
Активно
PINNED
·
--
Рост
Проверено
🚨 BREAKING: 🇺🇸 Trump Reportedly Signs Order Letting Tax-Free Red Diesel Run on US Highways
The move would allow dyed off-road diesel, normally reserved for farms and heavy equipment, on public roads for the rest of 2026.
It's the same fuel. The red dye only marks that highway taxes weren't paid: 24.3 cents a gallon federal, plus about 35.5 cents in state taxes on average. Louisiana and Nebraska had already eased the rules on their own.
The catch: analysts say it won't lower the wholesale price. Refiners still get market rates, so the relief comes from skipped taxes, not more supply.
For markets, cheaper fuel at the pump cools inflation a little, and every bit helps the case for a Fed on hold.
Watch whether pump prices actually fall, and whether the diesel export-ban talk comes back.
Not financial advice.
$CL
{future}(CLUSDT)
$BZ
{future}(BZUSDT)
$NATGAS
{future}(NATGASUSDT)
🚨 BREAKING: 🇺🇸 Trump Reportedly Signs Order Letting Tax-Free Red Diesel Run on US Highways
The move would allow dyed off-road diesel, normally reserved for farms and heavy equipment, on public roads for the rest of 2026.
It's the same fuel. The red dye only marks that highway taxes weren't paid: 24.3 cents a gallon federal, plus about 35.5 cents in state taxes on average. Louisiana and Nebraska had already eased the rules on their own.
The catch: analysts say it won't lower the wholesale price. Refiners still get market rates, so the relief comes from skipped taxes, not more supply.
For markets, cheaper fuel at the pump cools inflation a little, and every bit helps the case for a Fed on hold.
Watch whether pump prices actually fall, and whether the diesel export-ban talk comes back.
Not financial advice.
$CL
$BZ
$NATGAS
1
1
28
31.7k
PINNED
·
--
Падение
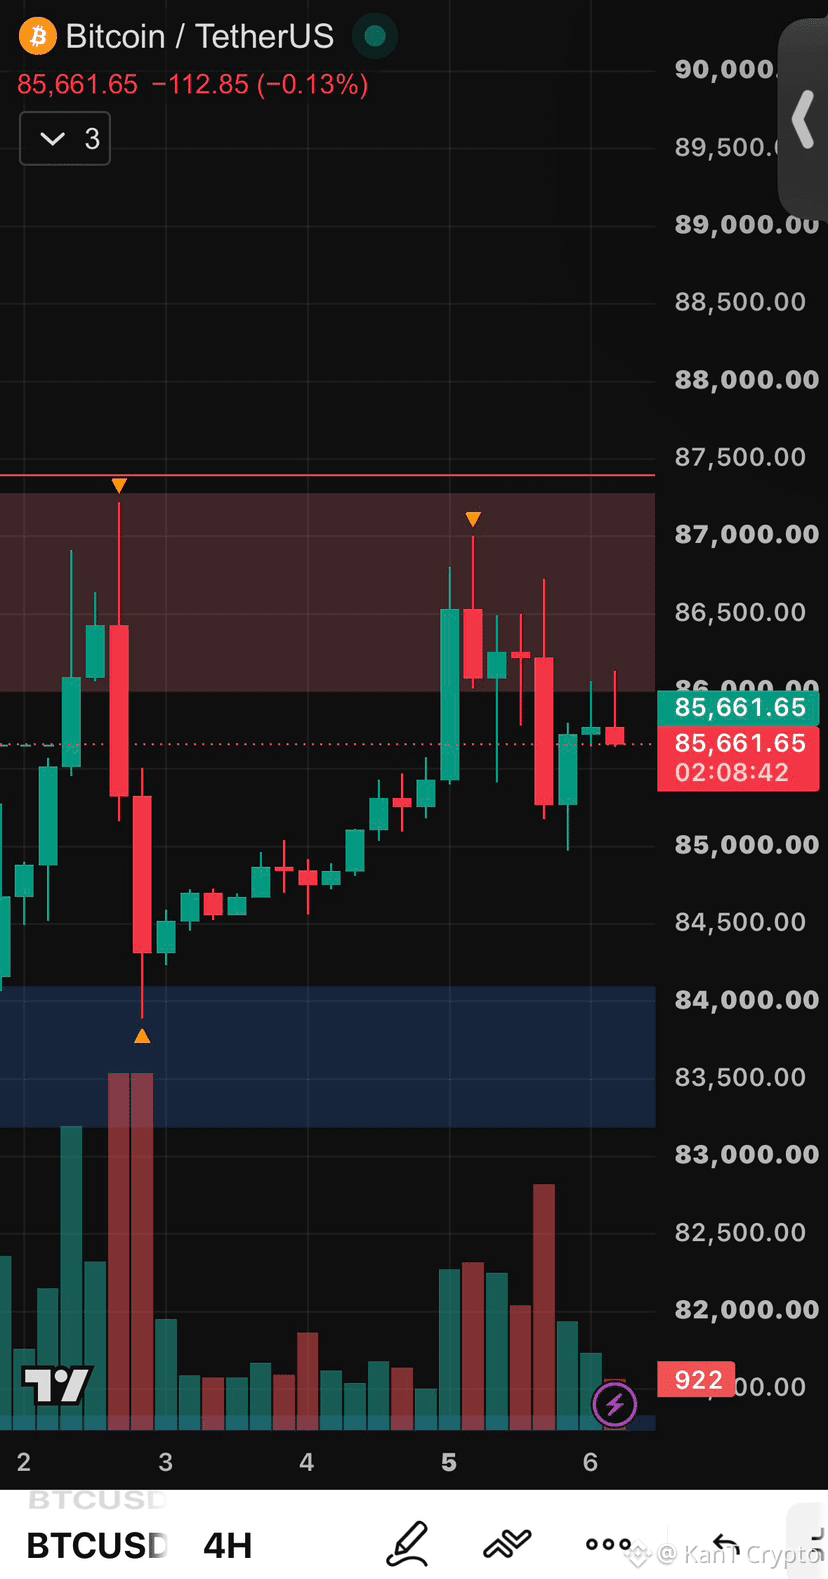
⚠️ The $87K Wall Just Blocked Bitcoin for the Third Time
Same wall. Same result.
Late September: rejected at $87.4K.
October 2: rejected at $87.2K.
October 5: rejected near $87K, then sold straight down to $85K.
Now BTC sits at $85,660 on the 4H, catching its breath. 👀
For the record, last time we said another rejection would make $85K the first stop. That's exactly where the selling paused, and the level is holding for now.
Look closer at those tops, though. Each push peaks a little lower: $87.4K, $87.2K, $87K, then $86.7K, and the latest bounce stalled near $86.1K. Buyers keep showing up, just with less force each time.
The lows tell the opposite story: $83.9K after the jobs-report flush, $85K this time. Higher lows under lower highs means the range is getting squeezed from both sides, and squeezes don't last forever.
The levels.
A 4H close above $87.4K finally breaks the wall, and the September highs turn into support.
Lose $85K, and the $83.2K to $84.1K demand zone is next, the same area that caught the last flush.
When a range tightens like this, the break usually comes fast. Let it pick a direction before you do.
Fourth try breaks the wall, or does $85K crack first? 🔥
Not financial advice.
$BTC
{future}(BTCUSDT)
$RLC
{future}(RLCUSDT)
$NEAR
{future}(NEARUSDT)
⚠️ The $87K Wall Just Blocked Bitcoin for the Third Time
Same wall. Same result.
Late September: rejected at $87.4K.
October 2: rejected at $87.2K.
October 5: rejected near $87K, then sold straight down to $85K.
Now BTC sits at $85,660 on the 4H, catching its breath. 👀
For the record, last time we said another rejection would make $85K the first stop. That's exactly where the selling paused, and the level is holding for now.
Look closer at those tops, though. Each push peaks a little lower: $87.4K, $87.2K, $87K, then $86.7K, and the latest bounce stalled near $86.1K. Buyers keep showing up, just with less force each time.
The lows tell the opposite story: $83.9K after the jobs-report flush, $85K this time. Higher lows under lower highs means the range is getting squeezed from both sides, and squeezes don't last forever.
The levels.
A 4H close above $87.4K finally breaks the wall, and the September highs turn into support.
Lose $85K, and the $83.2K to $84.1K demand zone is next, the same area that caught the last flush.
When a range tightens like this, the break usually comes fast. Let it pick a direction before you do.
Fourth try breaks the wall, or does $85K crack first? 🔥
Not financial advice.
$BTC
$RLC
$NEAR
1
10
7.5k
·
--
Падение
🚨BREAKING🚨
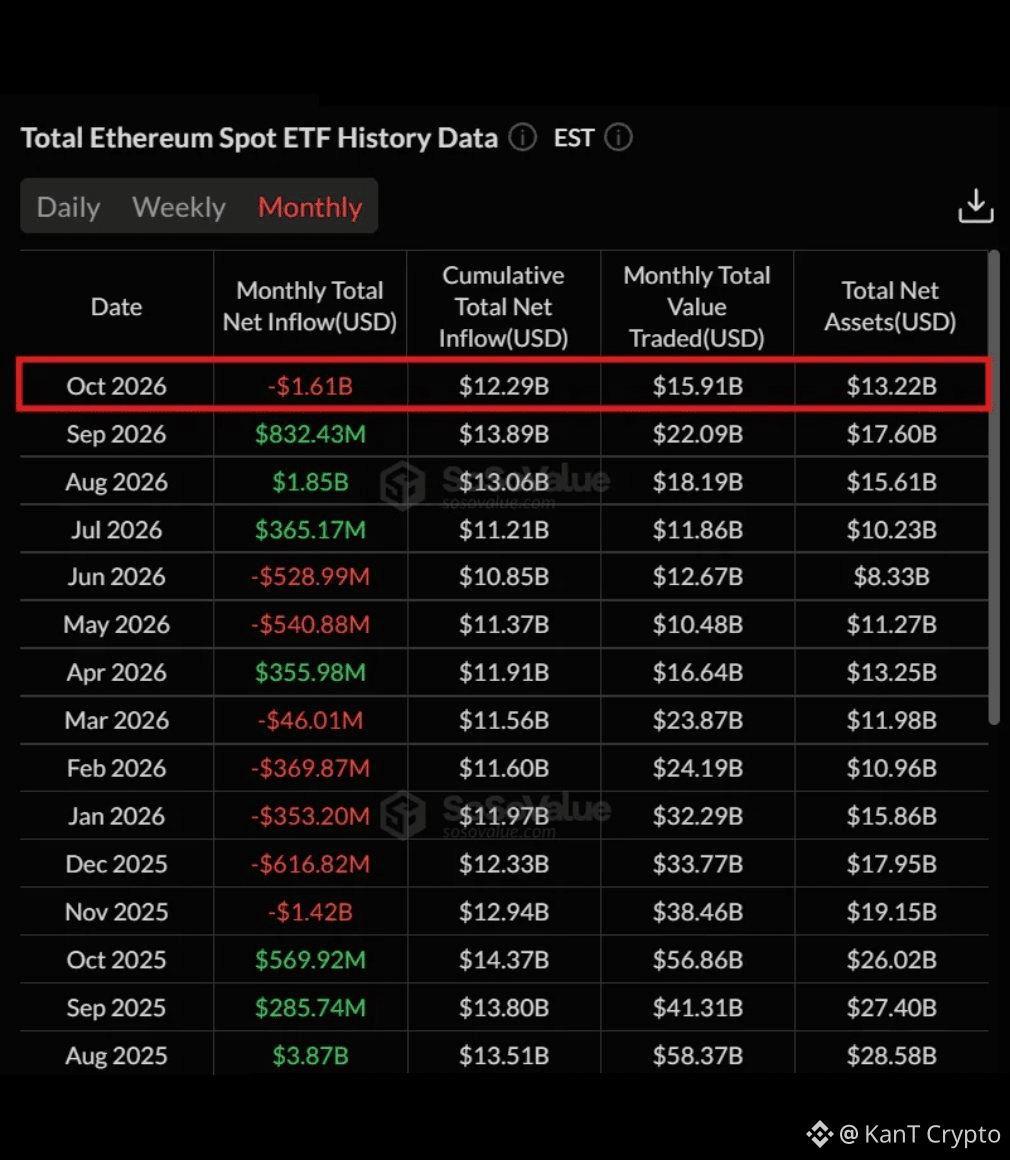
BlackRock and other ETFs sold $1.61 BILLION worth of Ethereum this month.
Largest monthly outflow since inception.
$ETH
{future}(ETHUSDT)
$BTC
{future}(BTCUSDT)
$SOL
{future}(SOLUSDT)
🚨BREAKING🚨
BlackRock and other ETFs sold $1.61 BILLION worth of Ethereum this month.
Largest monthly outflow since inception.
$ETH
$BTC
$SOL
BlackRock and other ETFs sold $1.61 BILLION worth of Ethereum this month.
Largest monthly outflow since inception.
$ETH
$BTC
$SOL

1
78
·
--
Падение
Частичная правда
BREAKING : 🇺🇸 BlackRock and other ETFs have sold $643.33 million worth of Bitcoin.
Largest single day outflow in the past 4 months.
$BTC
{future}(BTCUSDT)
$ETH
{future}(ETHUSDT)
$SOL
{future}(SOLUSDT)
BREAKING : 🇺🇸 BlackRock and other ETFs have sold $643.33 million worth of Bitcoin.
Largest single day outflow in the past 4 months.
$BTC
$ETH
$SOL
Largest single day outflow in the past 4 months.
$BTC
$ETH
$SOL

1
349
·
--
Рост
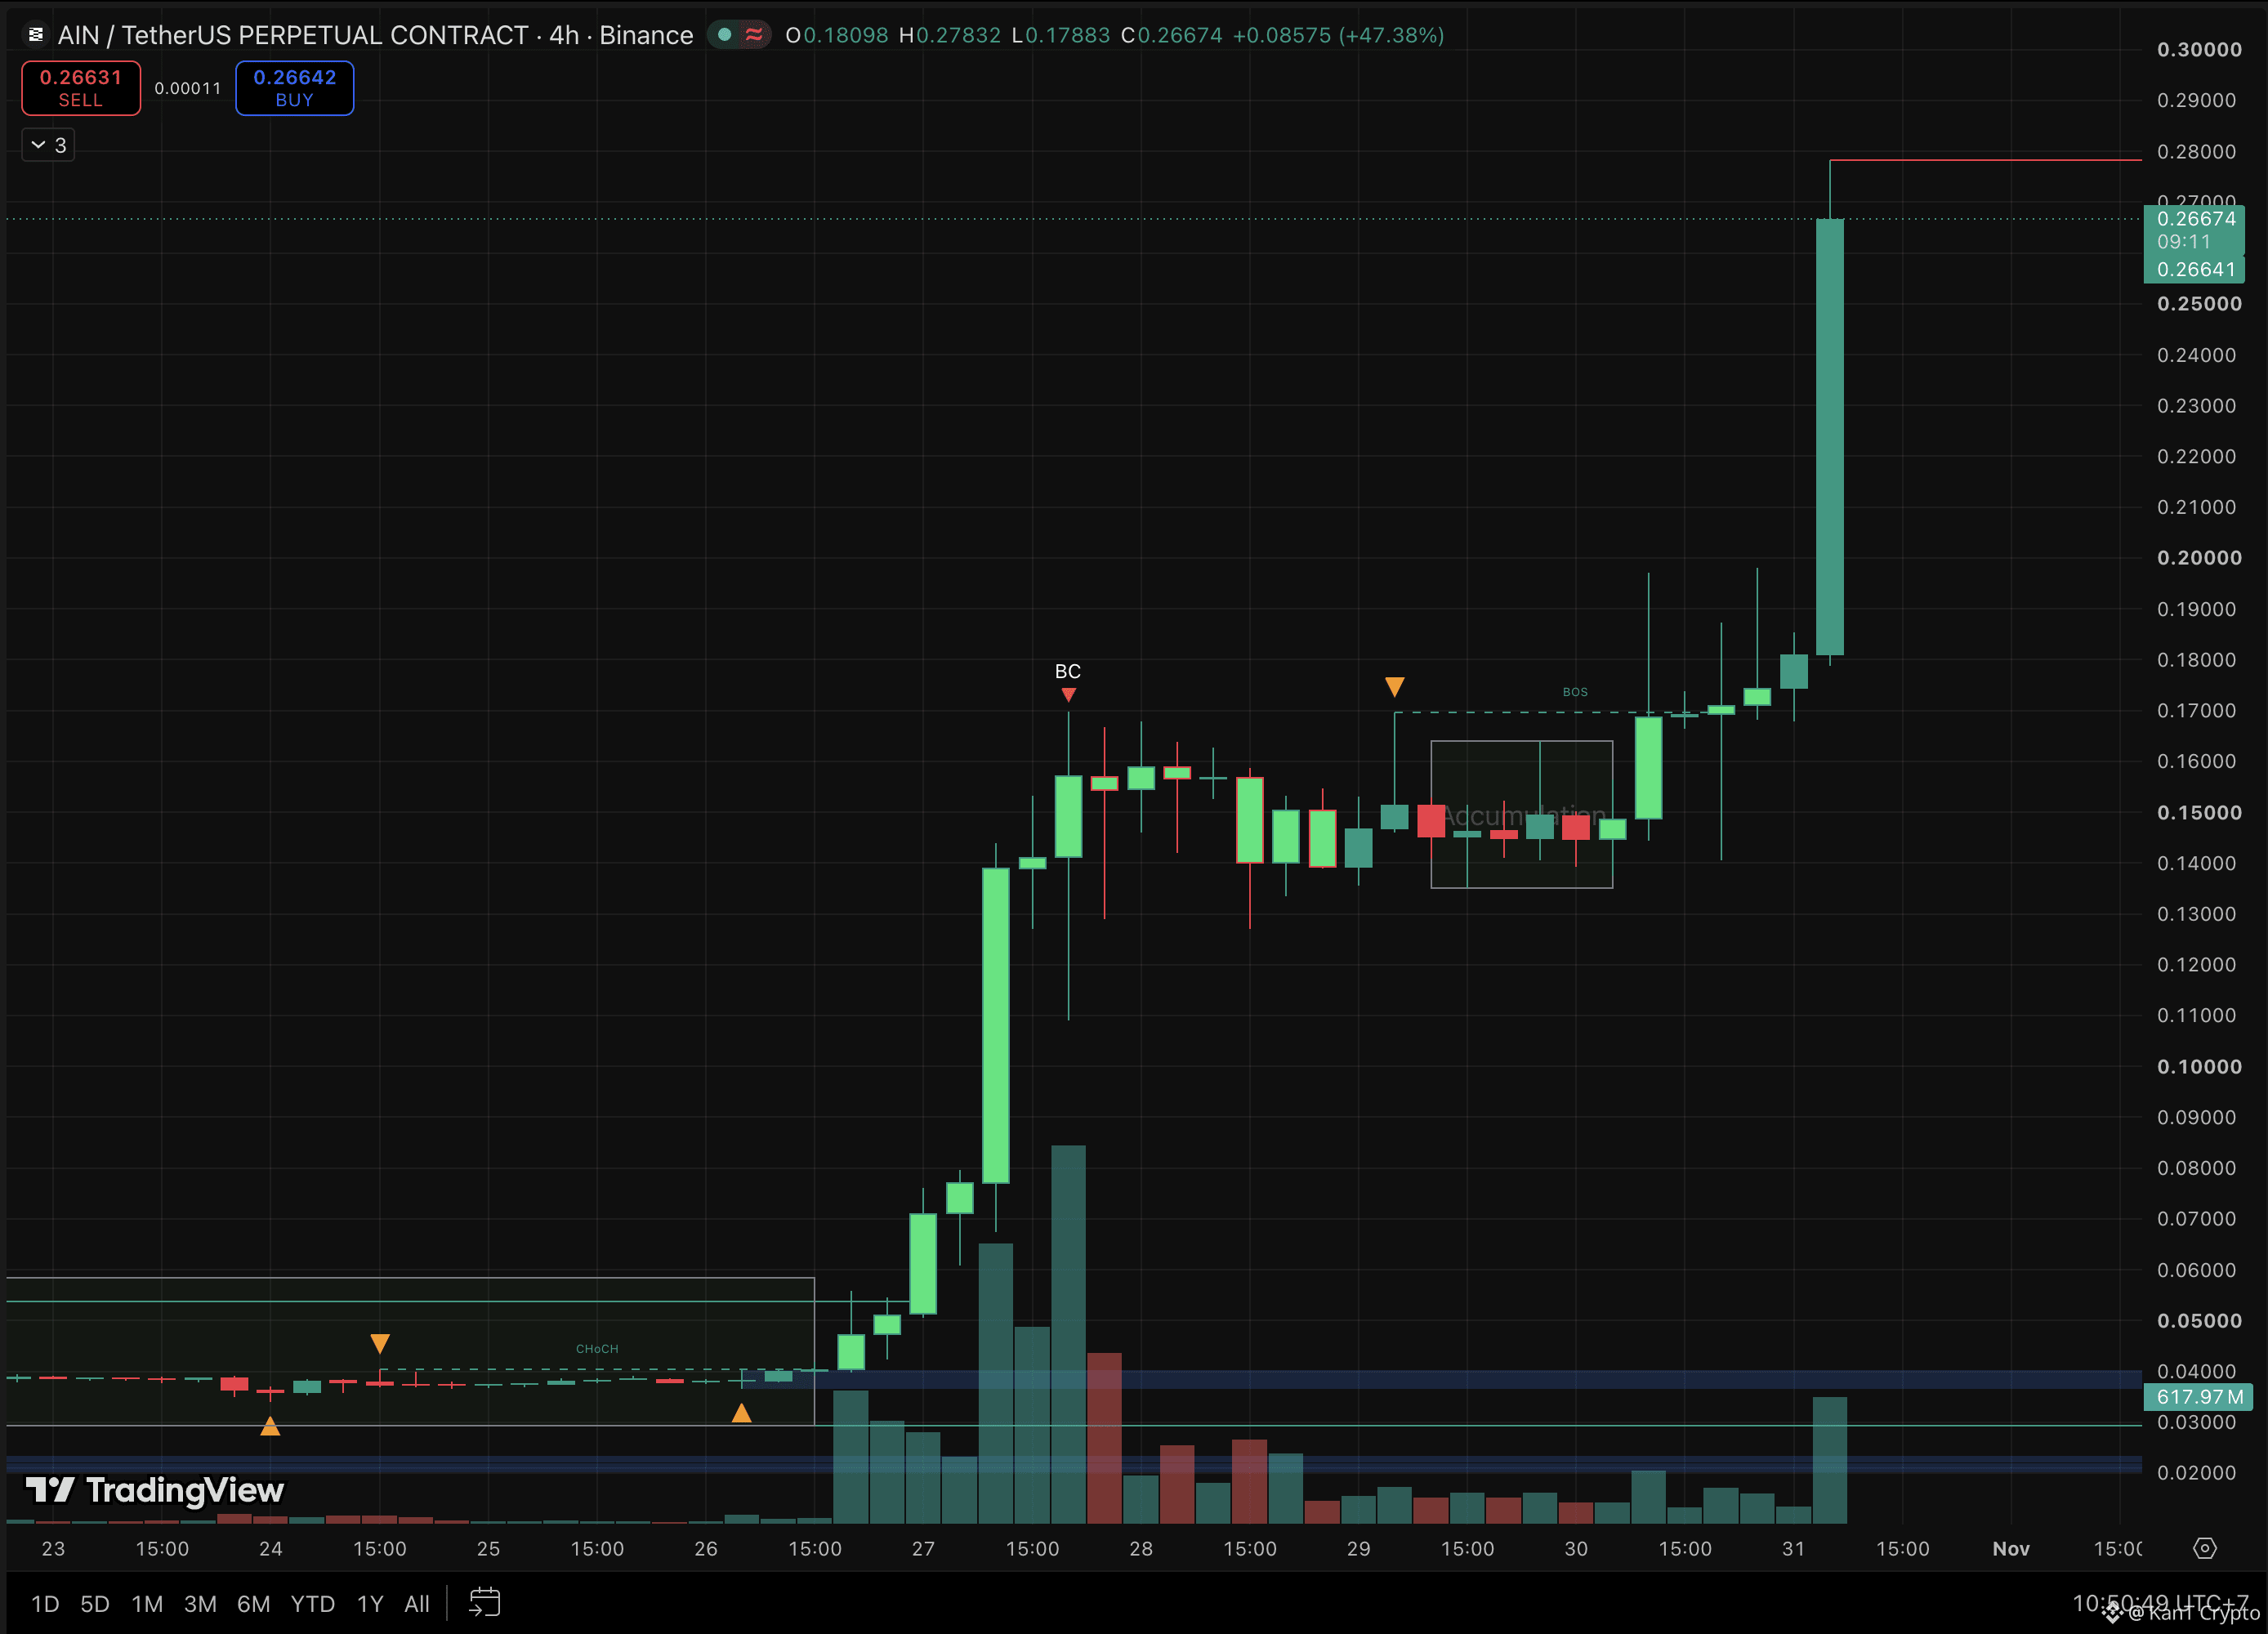
📈 AIN's silence just got its answer: +47% in a single 4H candle.
From $0.18 to $0.278 in four hours, and nearly 7x from the $0.04 base of Oct 26.
For the record, my last AIN post said stay under $0.15 and the $0.129 wick comes back, while a break of the $0.170 top starts a new leg. Both played out, in order: a dip to $0.127 that held, then a clean push above $0.170 and now this.
That three-day pause between $0.135 and $0.165 turned out to be re-accumulation, a sideways stretch in which buyers soak up supply before the next leg. Every dip inside it got bought.
Now the hard part. With minutes left, this bar has printed about a third of the volume of the first leg's peak. And this chart shows no trading history over $0.20, so the only levels overhead are round numbers like $0.28 and $0.30. Moves into empty space can extend fast, and reverse as quickly.
The map:
Hold $0.20 → the old wick highs flip to support, and $0.28 to $0.30 is in play.
Lose $0.20 → $0.181, where this move started, then the $0.170 breakout level.
A 47% candle is a bad place to open a position and a good place to tighten a stop.
Extension, or exhaustion?
Quiet ranges always end. So do vertical candles.
Not financial advice.
$AIN
{future}(AINUSDT)
$BEAMX
{future}(BEAMXUSDT)
$IDOL
{future}(IDOLUSDT)
📈 AIN's silence just got its answer: +47% in a single 4H candle.
From $0.18 to $0.278 in four hours, and nearly 7x from the $0.04 base of Oct 26.
For the record, my last AIN post said stay under $0.15 and the $0.129 wick comes back, while a break of the $0.170 top starts a new leg. Both played out, in order: a dip to $0.127 that held, then a clean push above $0.170 and now this.
That three-day pause between $0.135 and $0.165 turned out to be re-accumulation, a sideways stretch in which buyers soak up supply before the next leg. Every dip inside it got bought.
Now the hard part. With minutes left, this bar has printed about a third of the volume of the first leg's peak. And this chart shows no trading history over $0.20, so the only levels overhead are round numbers like $0.28 and $0.30. Moves into empty space can extend fast, and reverse as quickly.
The map:
Hold $0.20 → the old wick highs flip to support, and $0.28 to $0.30 is in play.
Lose $0.20 → $0.181, where this move started, then the $0.170 breakout level.
A 47% candle is a bad place to open a position and a good place to tighten a stop.
Extension, or exhaustion?
Quiet ranges always end. So do vertical candles.
Not financial advice.
$AIN
$BEAMX
$IDOL
1
632
·
--
Рост
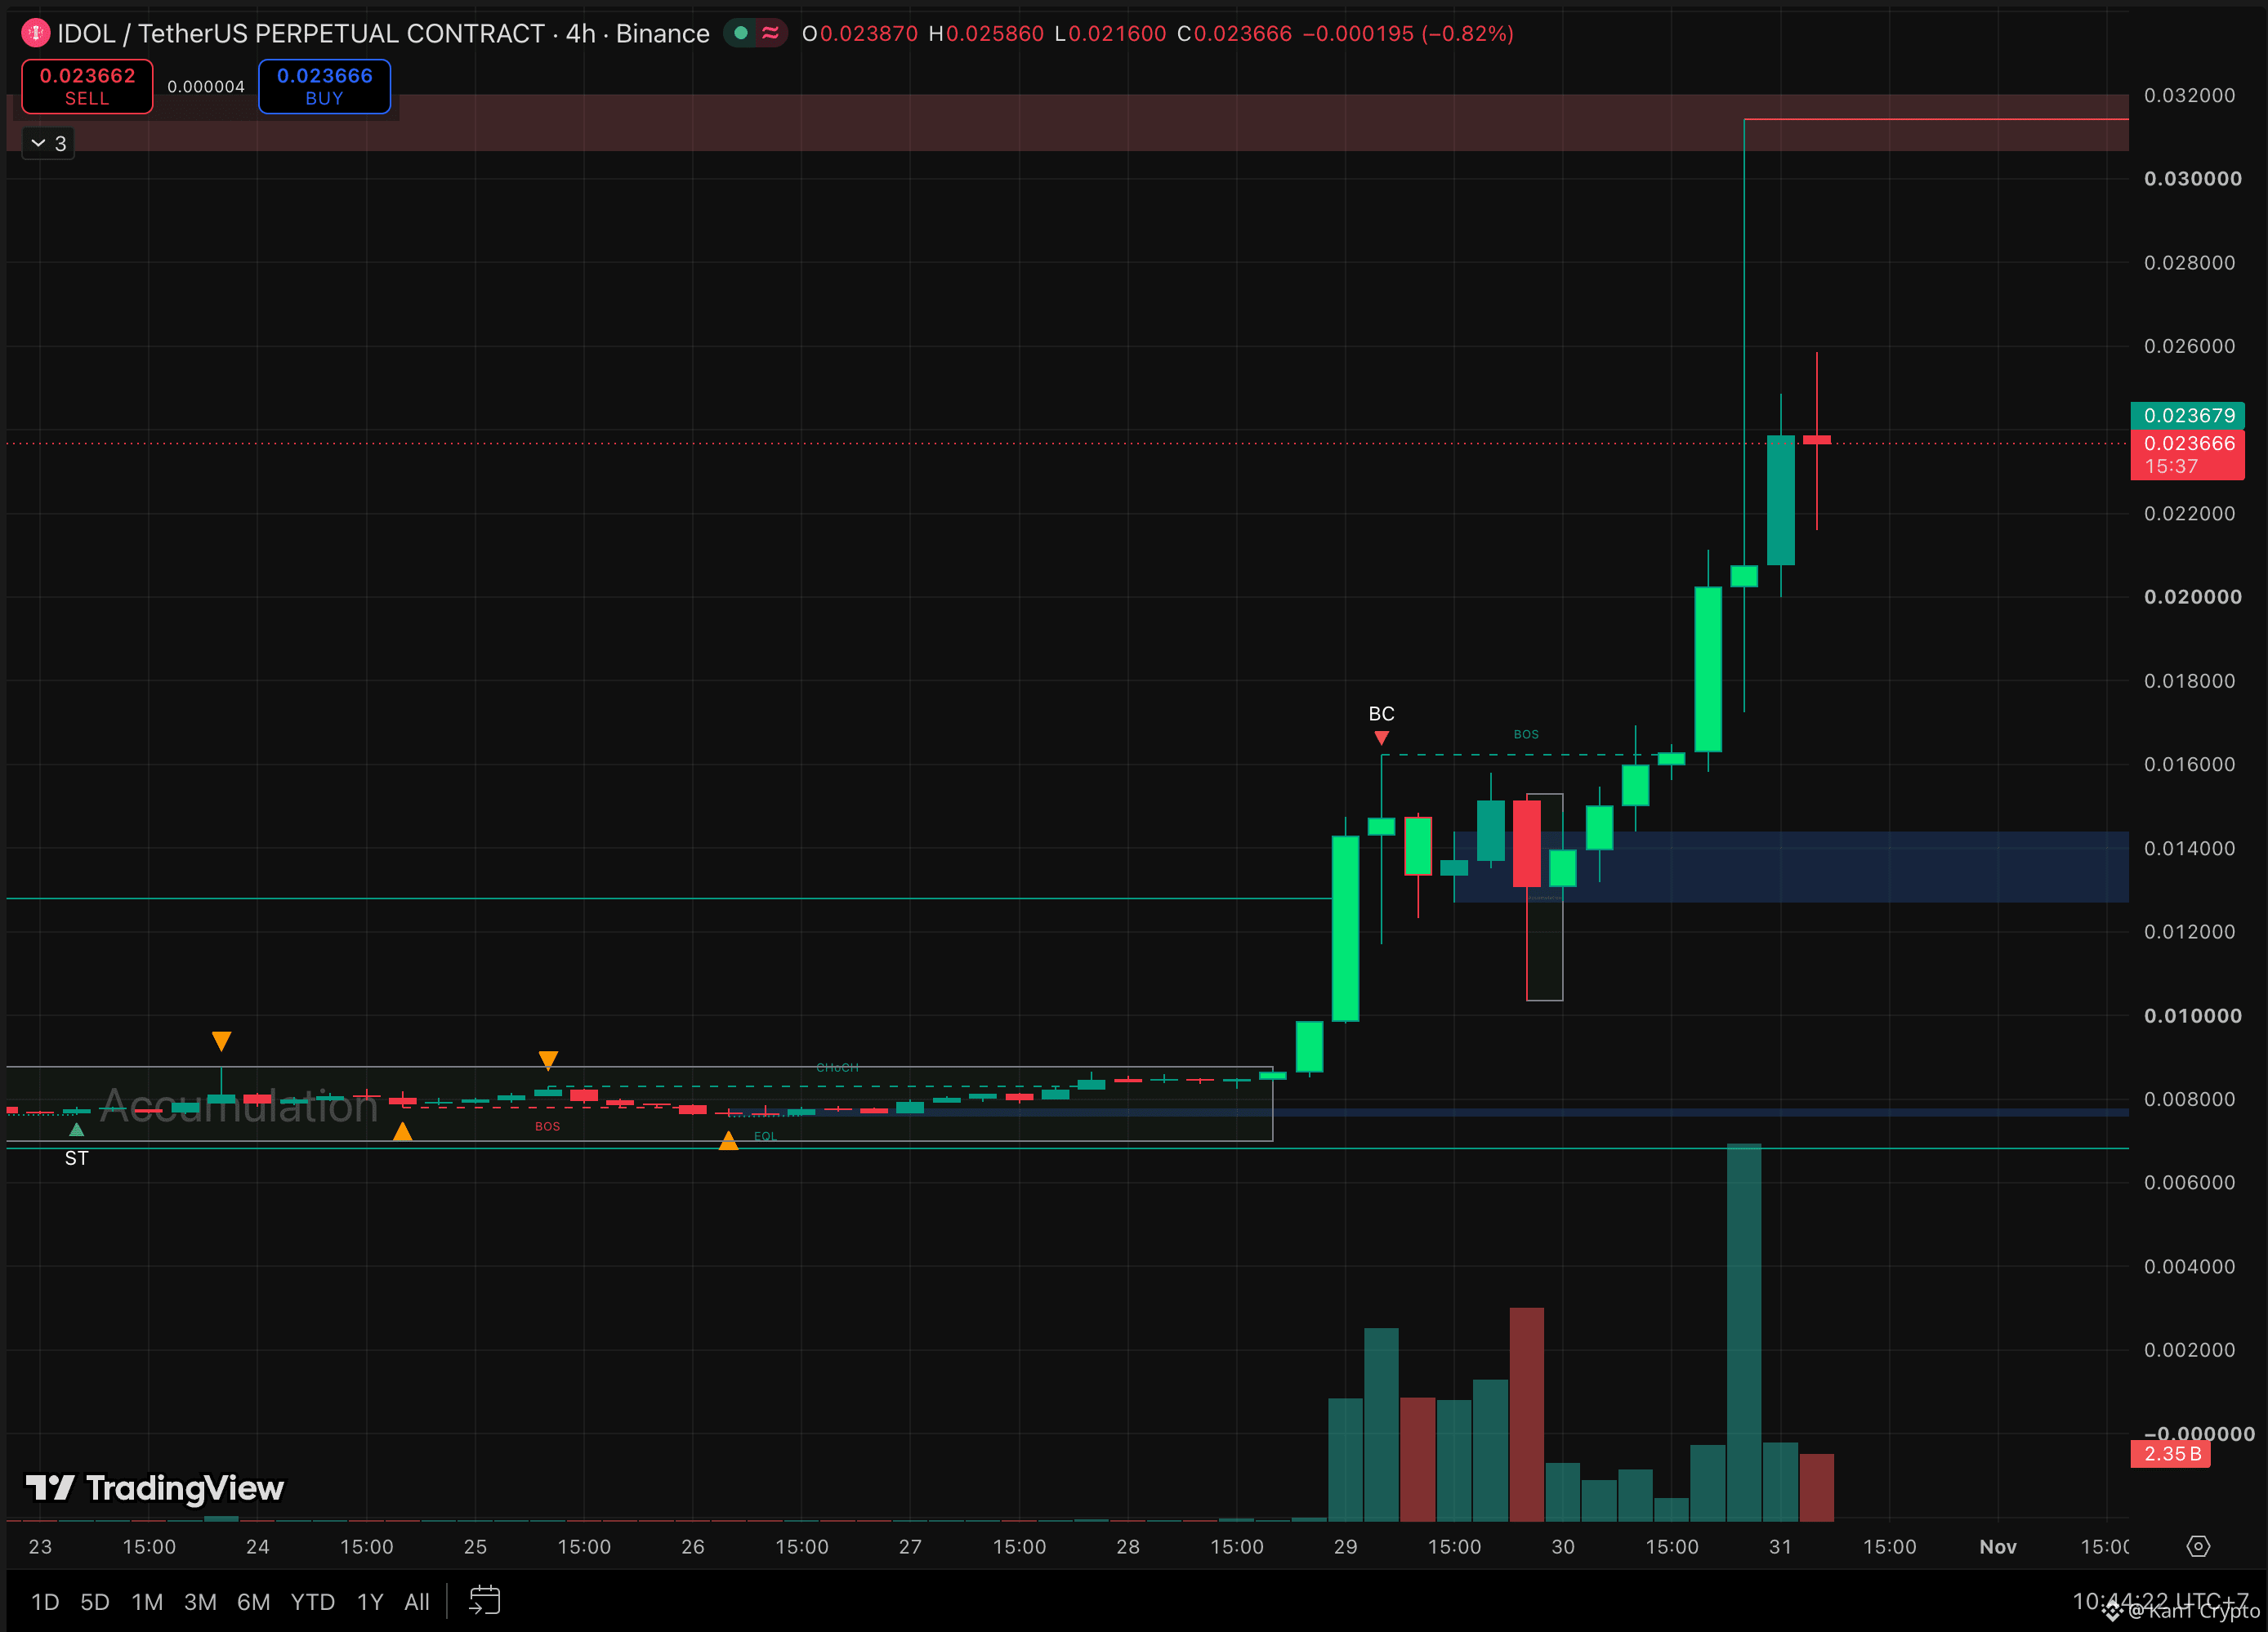
📈 IDOL more than TRIPLED off its base, then left a 55% wick on top.
From $0.0087 to a $0.0314 high in two days. Now it sits at $0.0237.
For the record, my last IDOL map called the $0.0117 to $0.0162 range a 38% box and said the breakout would pick the exit. Both sides got tested first: a push to $0.0158, then a wick to $0.0104, beneath the AR low. Then it broke the $0.0162 top cleanly and kept going.
That flush under the floor was textbook. In Wyckoff terms it's a spring, a quick break below the range that traps late sellers right before the real move.
Then came the candle that matters now. One 4H bar spiked from $0.0202 to $0.0314, straight into the $0.0307 to $0.032 supply zone, and closed at $0.0207 on the heaviest volume of the whole run. Everyone who chased that pop is sitting on a loss.
Since then price has been rebuilding between $0.020 and $0.026.
The map:
Hold $0.020 → another run at the $0.0259 high, then the $0.0307 to $0.032 supply.
Lose $0.020 → $0.0172, that candle's low, then $0.0162, the old top now acting as support.
Watch the bagholders. The buyers trapped above $0.026 are the ones who sell into any return to those prices.
Second leg loading, or was that spike the top?
Big wicks leave memories. Markets usually come back to argue with them.
Not financial advice. $IDOL
{future}(IDOLUSDT)
$AIN
{future}(AINUSDT)
$BEAMX
{future}(BEAMXUSDT)
📈 IDOL more than TRIPLED off its base, then left a 55% wick on top.
From $0.0087 to a $0.0314 high in two days. Now it sits at $0.0237.
For the record, my last IDOL map called the $0.0117 to $0.0162 range a 38% box and said the breakout would pick the exit. Both sides got tested first: a push to $0.0158, then a wick to $0.0104, beneath the AR low. Then it broke the $0.0162 top cleanly and kept going.
That flush under the floor was textbook. In Wyckoff terms it's a spring, a quick break below the range that traps late sellers right before the real move.
Then came the candle that matters now. One 4H bar spiked from $0.0202 to $0.0314, straight into the $0.0307 to $0.032 supply zone, and closed at $0.0207 on the heaviest volume of the whole run. Everyone who chased that pop is sitting on a loss.
Since then price has been rebuilding between $0.020 and $0.026.
The map:
Hold $0.020 → another run at the $0.0259 high, then the $0.0307 to $0.032 supply.
Lose $0.020 → $0.0172, that candle's low, then $0.0162, the old top now acting as support.
Watch the bagholders. The buyers trapped above $0.026 are the ones who sell into any return to those prices.
Second leg loading, or was that spike the top?
Big wicks leave memories. Markets usually come back to argue with them.
Not financial advice. $IDOL
$AIN
$BEAMX
1
669
·
--
Падение
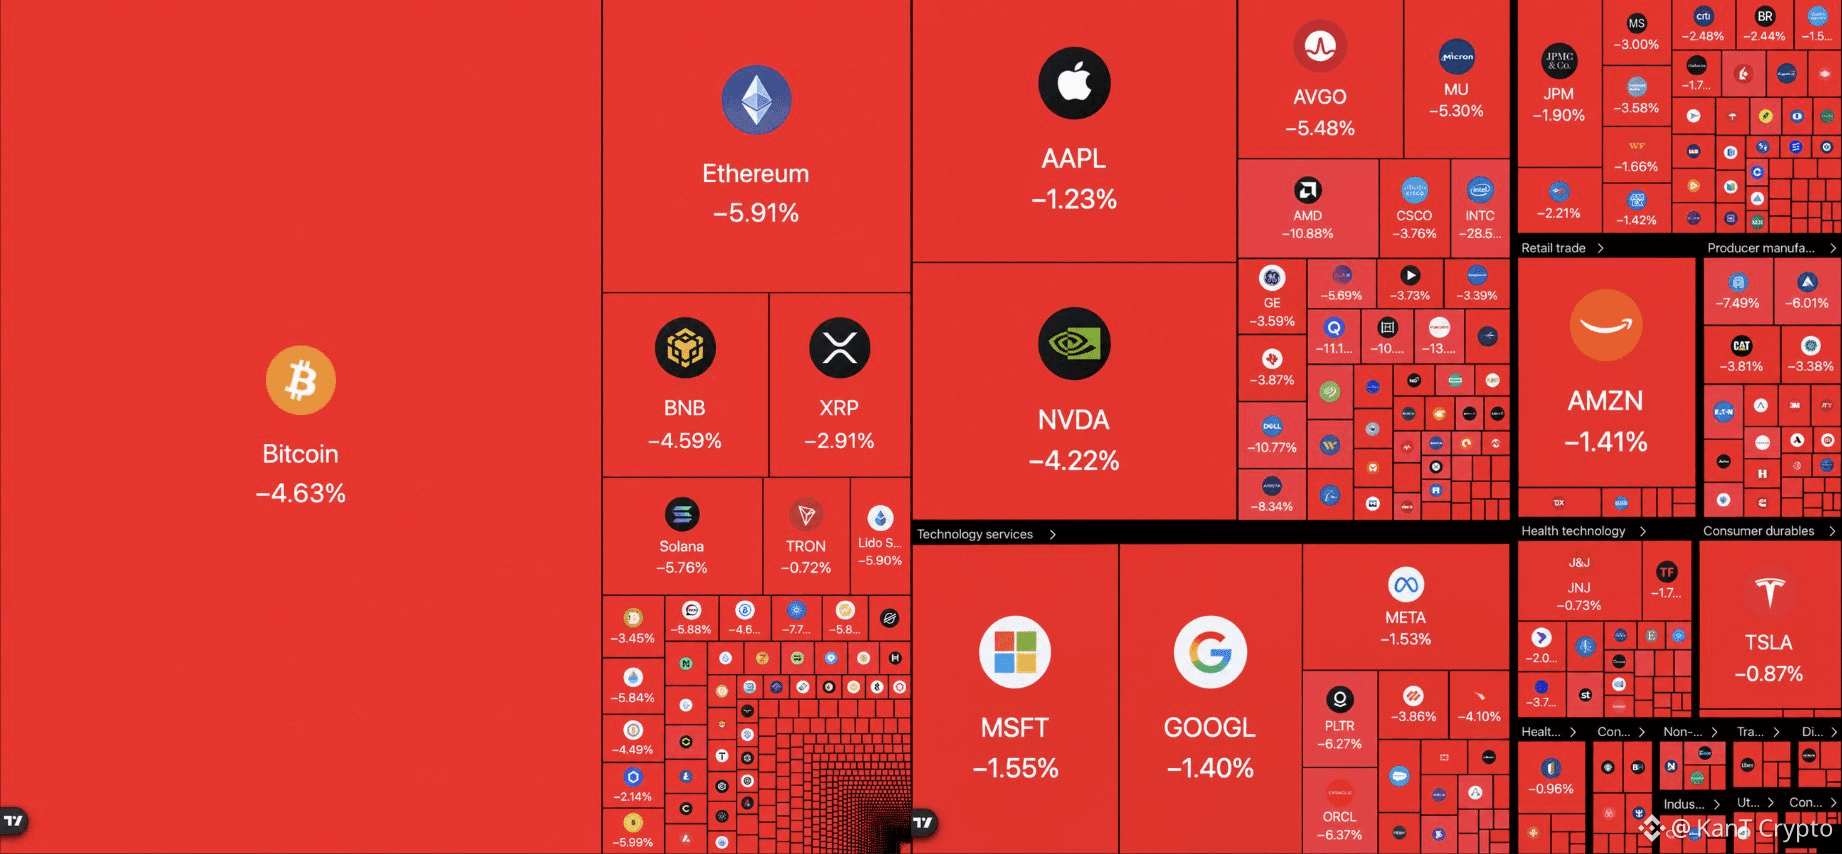
Bitcoin is crashing... 🩸
Stocks are crashing.
Gold is crashing.
Silver is crashing.
$BTC
{future}(BTCUSDT)
$XAU
{future}(XAUUSDT)
$XAG
{future}(XAGUSDT)
Bitcoin is crashing... 🩸
Stocks are crashing.
Gold is crashing.
Silver is crashing.
$BTC
$XAU
$XAG
Stocks are crashing.
Gold is crashing.
Silver is crashing.
$BTC
$XAU
$XAG
2
610
·
--
Падение
Проверено
📉 The "safe haven" just fell harder than the Nasdaq.
Gold dropped about 3.5% on Friday to under $3,900, its lowest level in over a year. Silver did worse, down 6% to around $49.
The trigger was Wall Street. A tech-led selloff dragged the S&P 500 down 1.8%, its worst day since June, and the Nasdaq down 2.9%. When portfolios bleed, gold is one of the first things funds sell.
The strange part: bond yields fell and the dollar eased, which normally lifts gold. But this market is trading the Fed's next move, not today's yields. The Fed held at 3.75% to 4% with two officials voting for a hike, Q3 growth came in at 3.4%, and futures lean toward another hike in December. Brent at $117 after a tanker attack in Hormuz keeps that inflation fear alive.
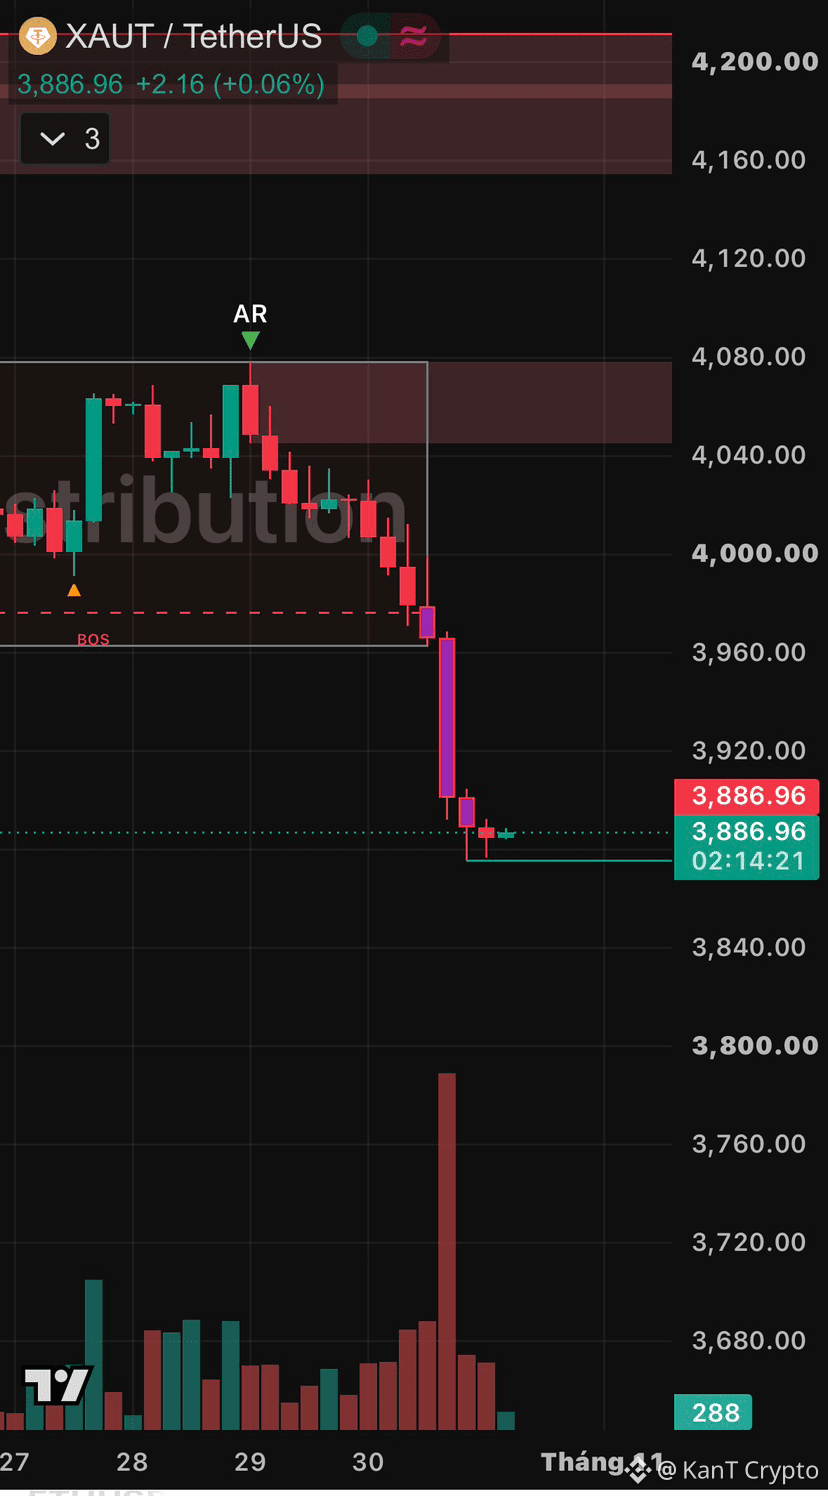
For the record, on Oct 20 I flagged gold topping lower under $4,200, with $4,123 as the line. That line broke, and everything below it followed.
On the 4H chart, gold spent three days in a $3,963 to $4,078 distribution range, sellers unloading into every bounce. Then the floor gave way, and the heaviest volume of the week hit on the dump to a $3,875 low.
Where it goes next:
Reclaim $3,910 → a bounce toward $3,963, the old floor now acting as resistance.
Lose $3,875 → $3,800, then $3,780, are the next marks.
Catching falling gold feels safer than catching falling crypto. When the selling is forced, it isn't.
Oversold bounce, or a new leg lower?
Safe havens stay safe only until someone needs the cash.
Not financial advice.
$XAU
{future}(XAUUSDT)
$XAUT
{future}(XAUTUSDT)
$PAXG
{future}(PAXGUSDT)
📉 The "safe haven" just fell harder than the Nasdaq.
Gold dropped about 3.5% on Friday to under $3,900, its lowest level in over a year. Silver did worse, down 6% to around $49.
The trigger was Wall Street. A tech-led selloff dragged the S&P 500 down 1.8%, its worst day since June, and the Nasdaq down 2.9%. When portfolios bleed, gold is one of the first things funds sell.
The strange part: bond yields fell and the dollar eased, which normally lifts gold. But this market is trading the Fed's next move, not today's yields. The Fed held at 3.75% to 4% with two officials voting for a hike, Q3 growth came in at 3.4%, and futures lean toward another hike in December. Brent at $117 after a tanker attack in Hormuz keeps that inflation fear alive.
For the record, on Oct 20 I flagged gold topping lower under $4,200, with $4,123 as the line. That line broke, and everything below it followed.
On the 4H chart, gold spent three days in a $3,963 to $4,078 distribution range, sellers unloading into every bounce. Then the floor gave way, and the heaviest volume of the week hit on the dump to a $3,875 low.
Where it goes next:
Reclaim $3,910 → a bounce toward $3,963, the old floor now acting as resistance.
Lose $3,875 → $3,800, then $3,780, are the next marks.
Catching falling gold feels safer than catching falling crypto. When the selling is forced, it isn't.
Oversold bounce, or a new leg lower?
Safe havens stay safe only until someone needs the cash.
Not financial advice.
$XAU
$XAUT
$PAXG
1
814
·
--
Падение
JUST IN: 🇰🇵 North Korea responsible for $6 billion Binance hack, CNN reports.
$BNB
{future}(BNBUSDT)
$BTC
{future}(BTCUSDT)
$SOL
{future}(SOLUSDT)
JUST IN: 🇰🇵 North Korea responsible for $6 billion Binance hack, CNN reports.
$BNB
$BTC
$SOL
$BNB
$BTC
$SOL


1
54
·
--
Падение
JUST IN: Binance says $6,300,000,000 worth of crypto was impacted following major hack.
$BNB
{future}(BNBUSDT)
$BTC
{future}(BTCUSDT)
$ETH
{future}(ETHUSDT)
JUST IN: Binance says $6,300,000,000 worth of crypto was impacted following major hack.
$BNB
$BTC
$ETH
$BNB
$BTC
$ETH
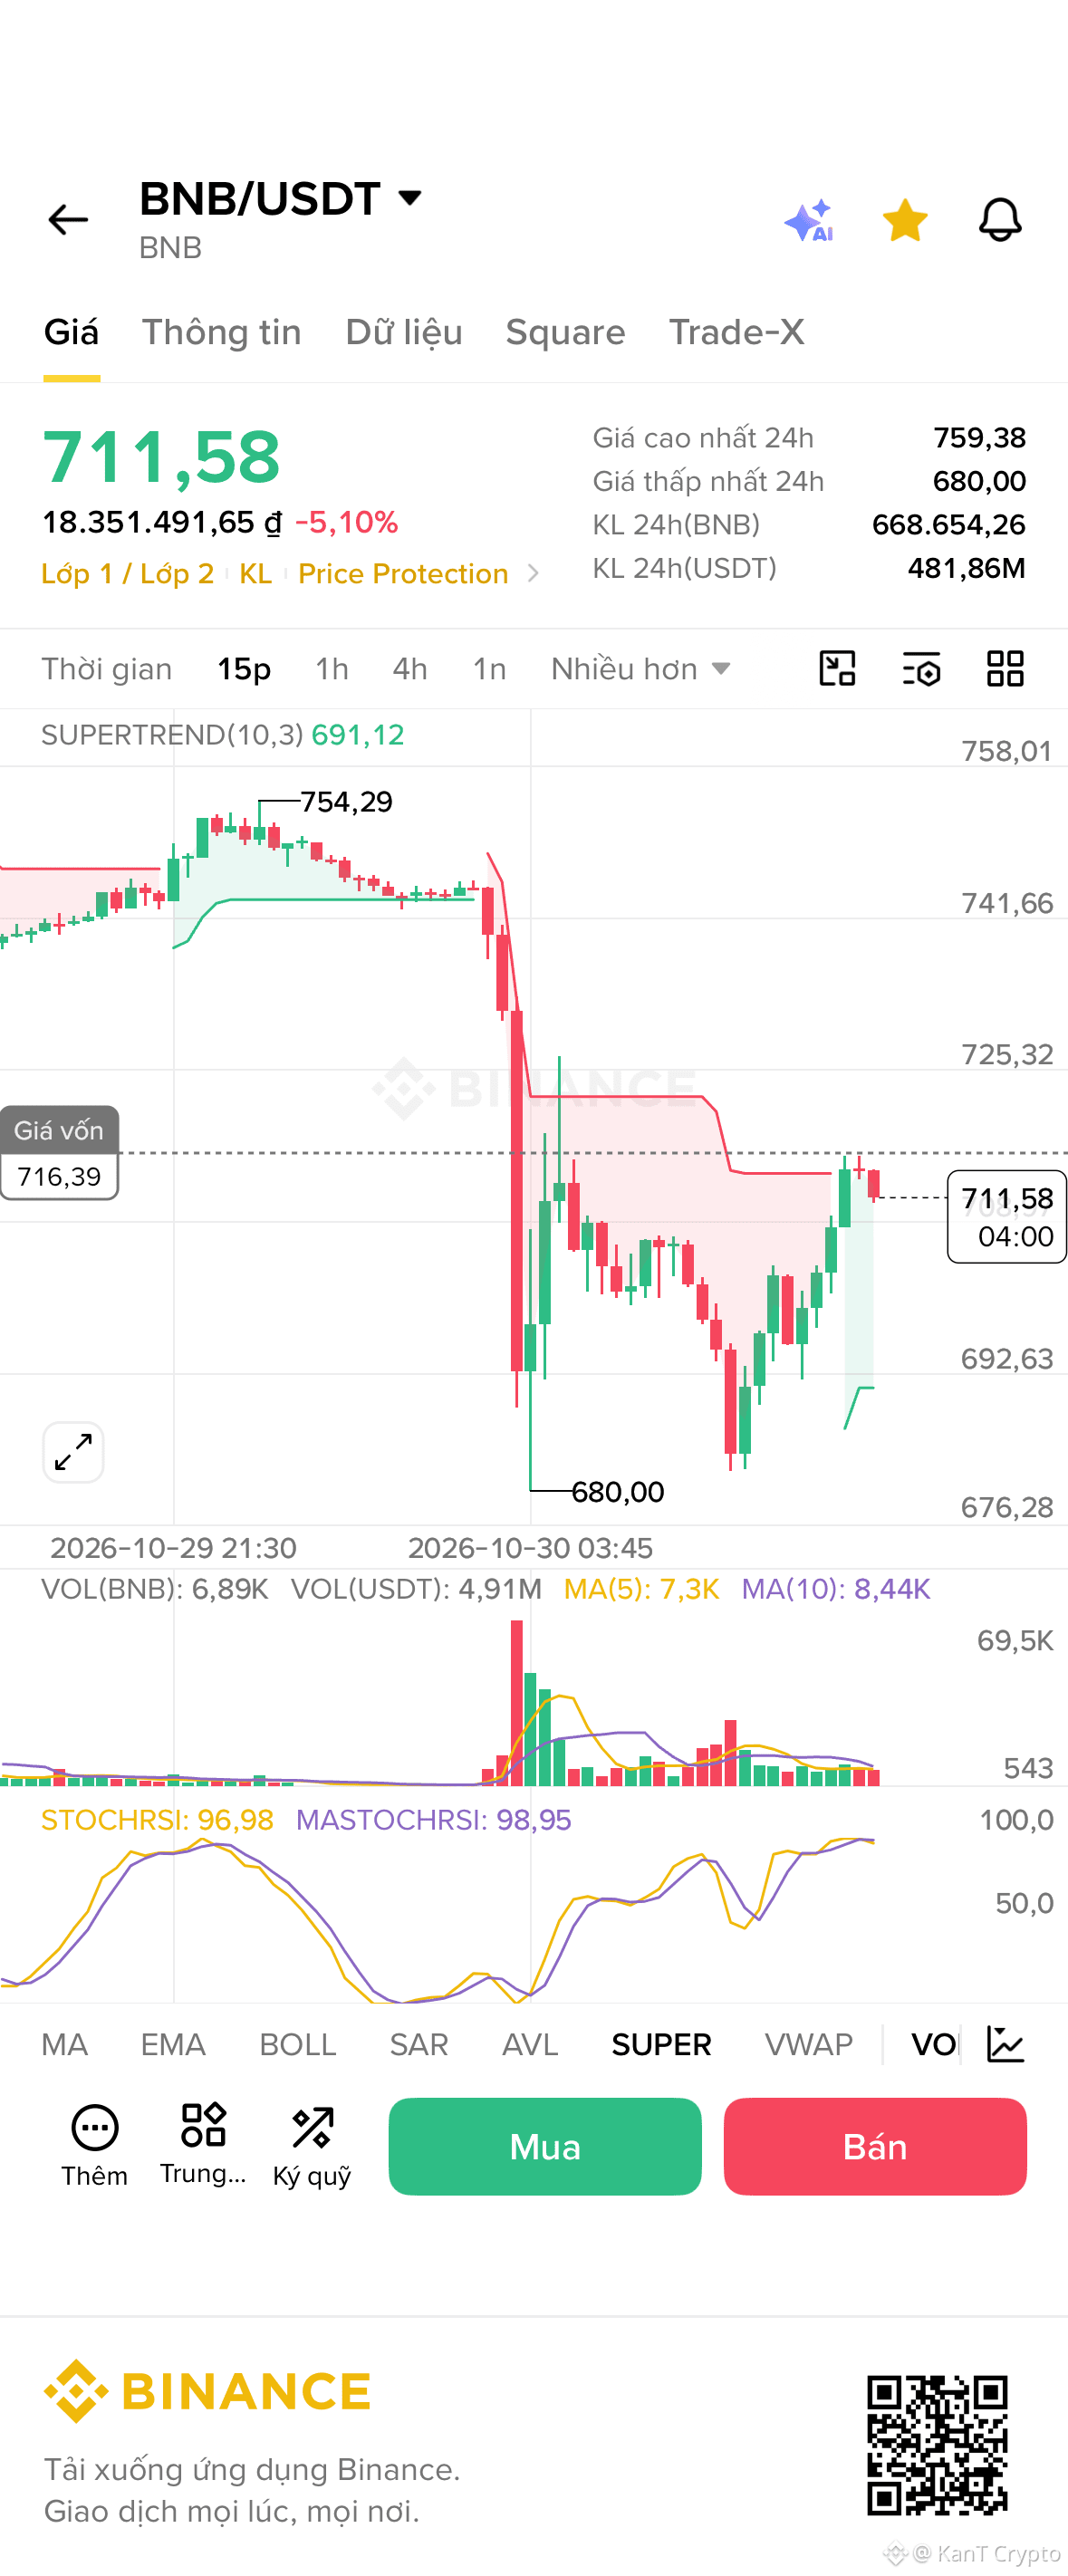
Источник: скриншот пользователя Binance»
1
98
·
--
Рост
Частичная правда
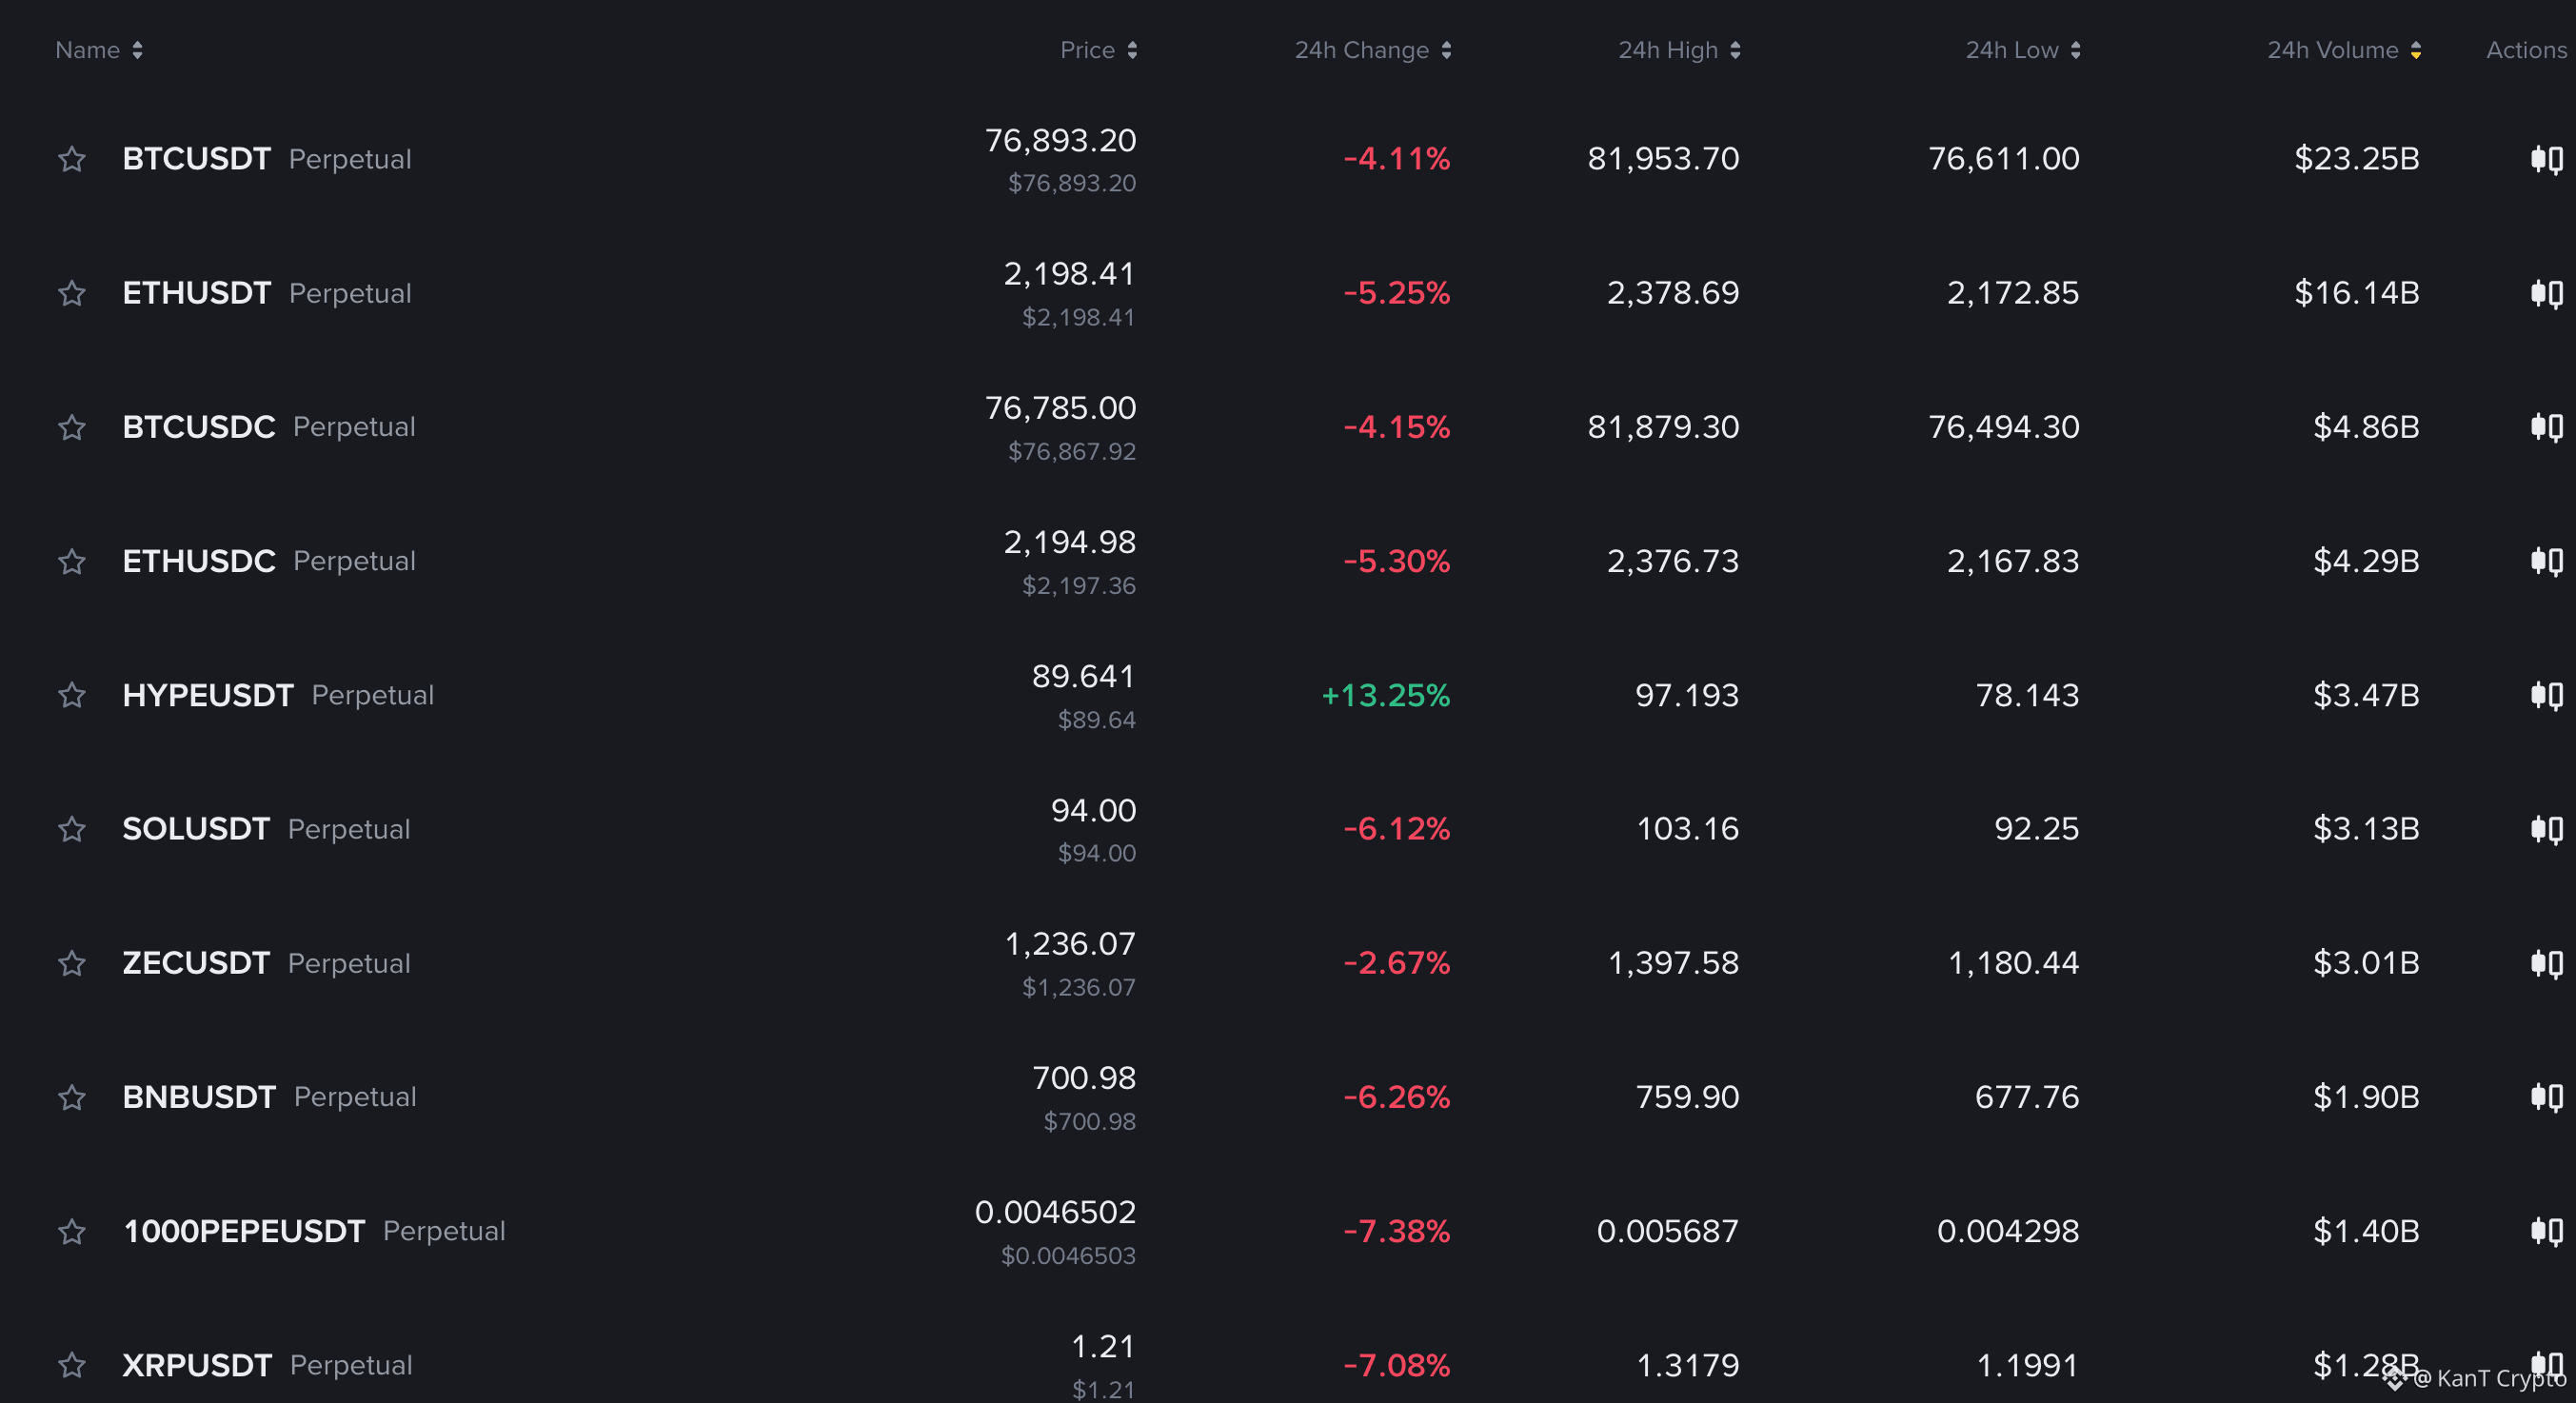
📈 BTC -4%. ETH -5%. SOL -6%. HYPE +13%.
The whole board is bleeding, and one chart refuses to follow.
The reason is still yesterday’s headline: NYSE owner ICE plans a regulated US venue for perpetual futures built on HYPE’s network.
While the hawkish Fed and the Big Tech selloff dragged most of the market down, that story kept a bid under HYPE.
The volume says this isn’t a thin pump. HYPE did $3.47B in 24h futures volume, more than SOL’s $3.13B and third only behind BTC and ETH.
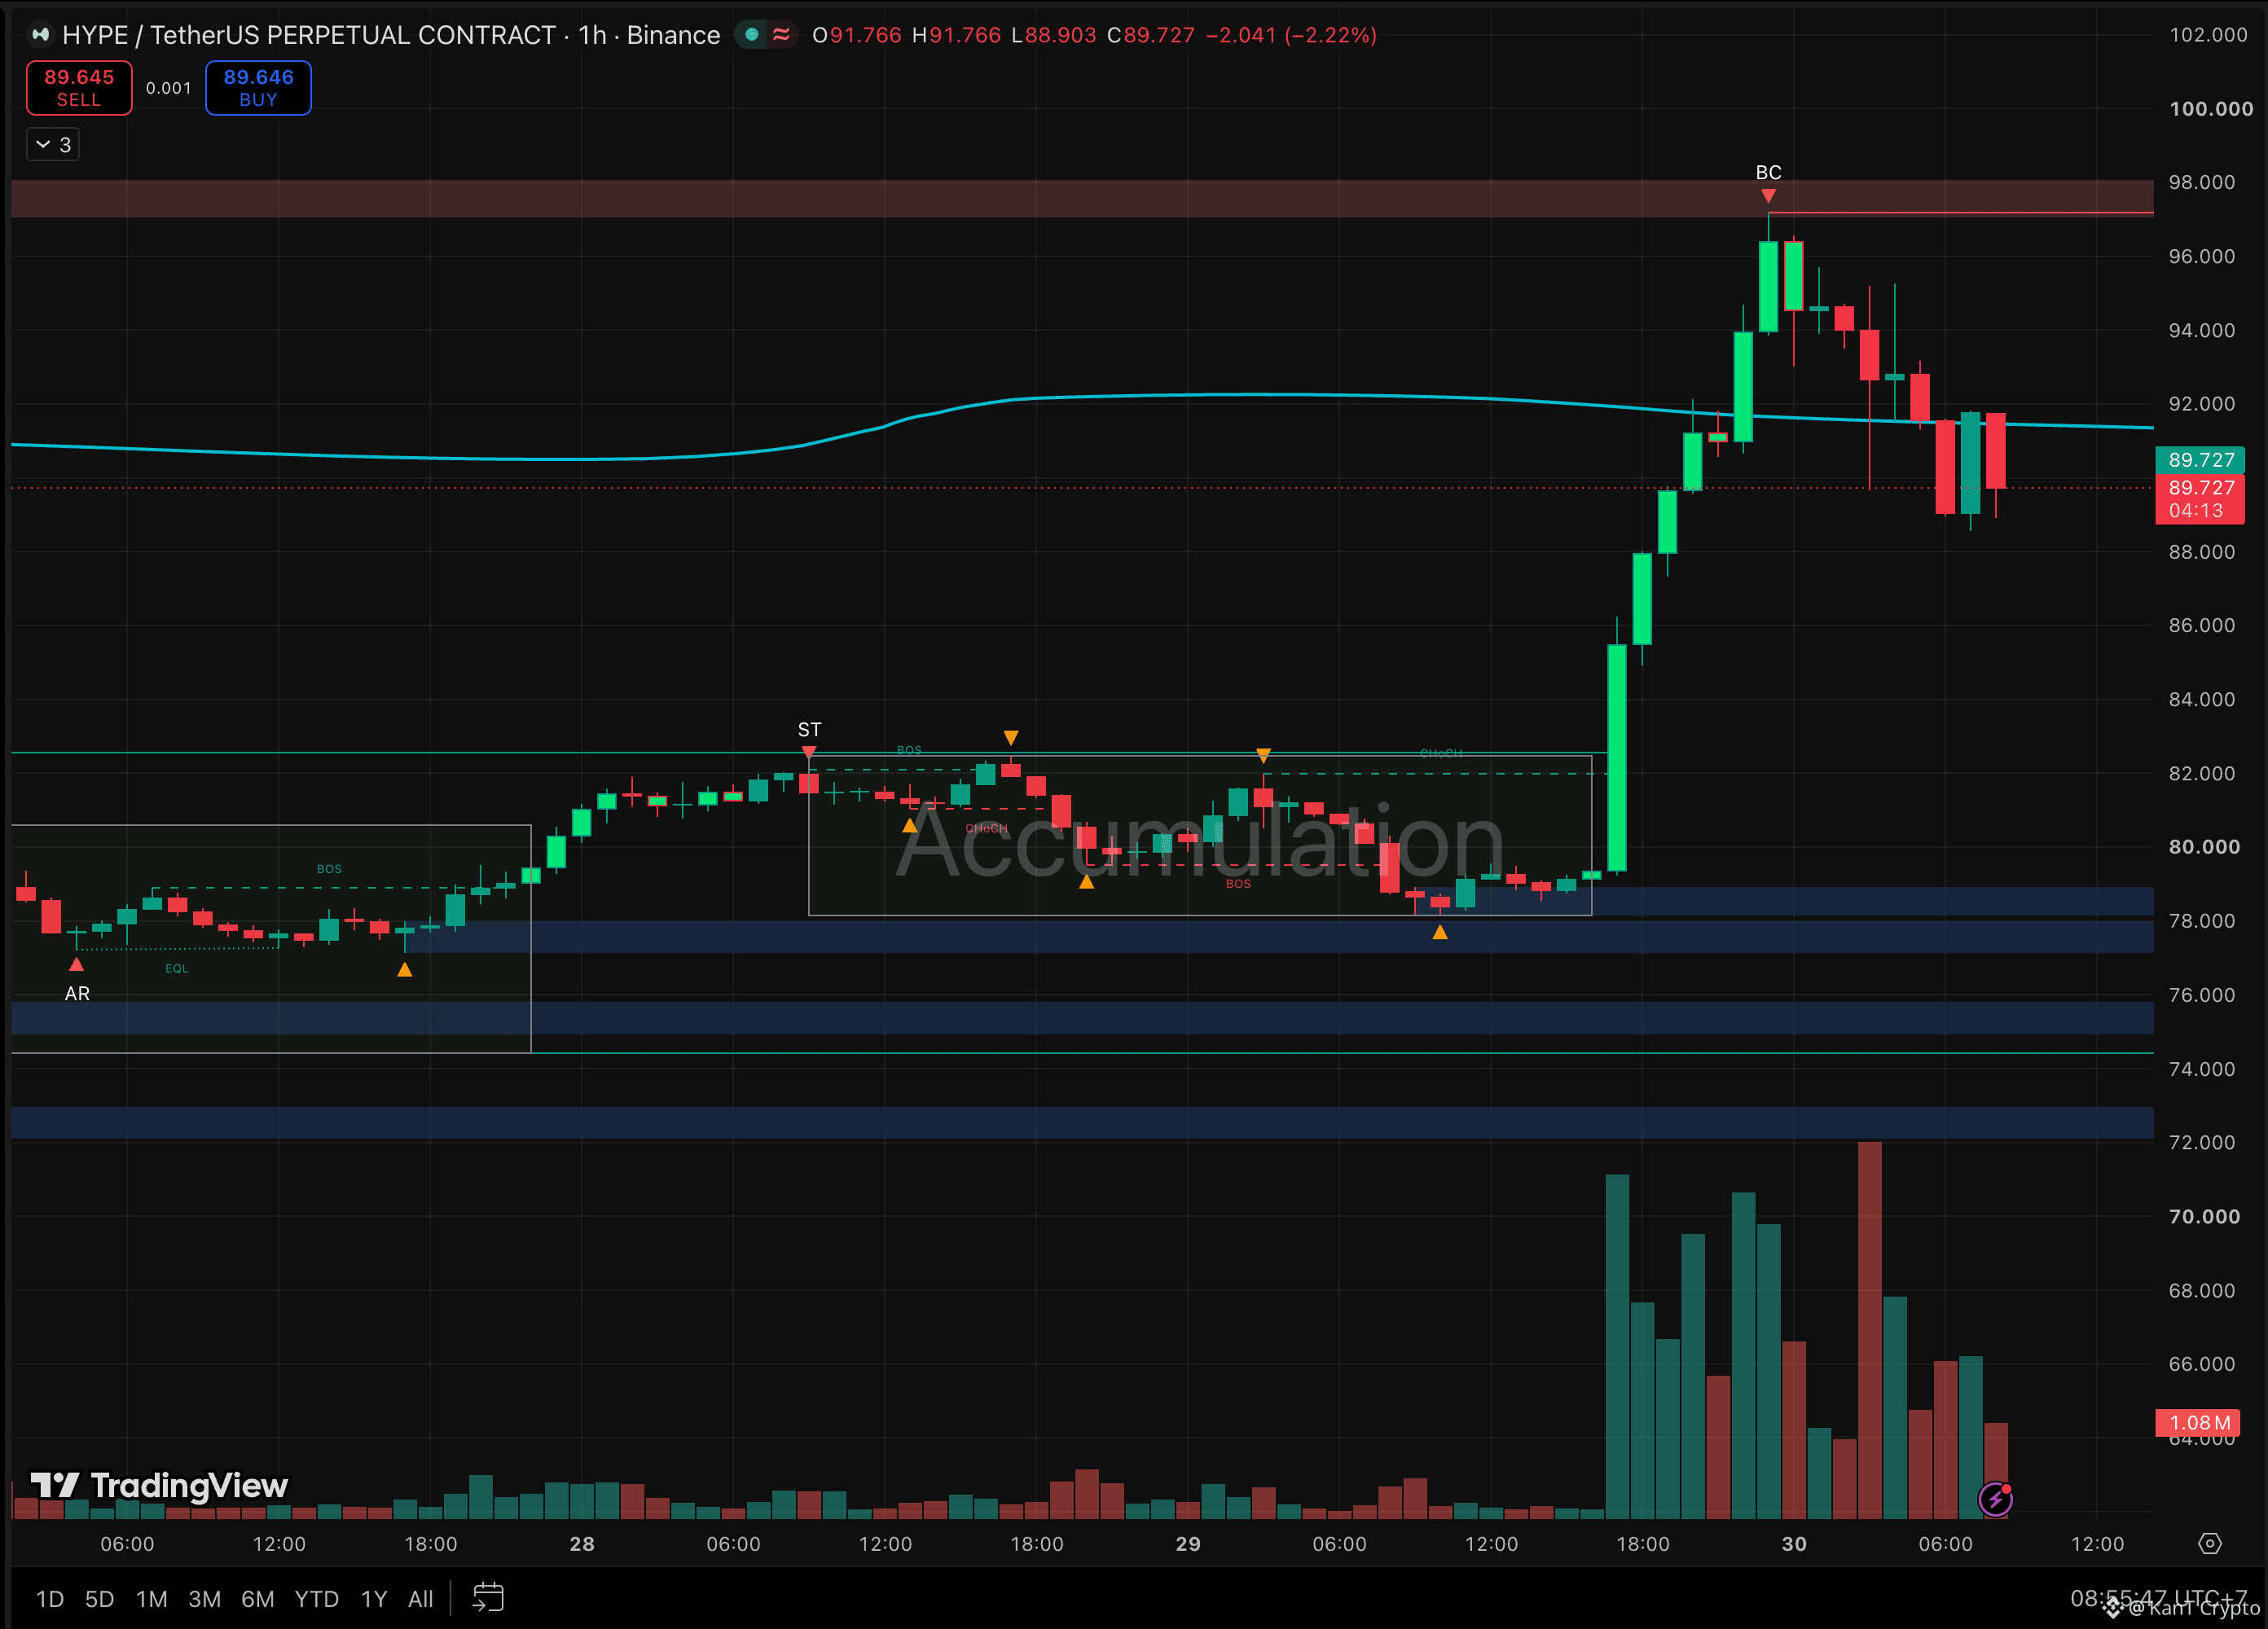
For the record, yesterday’s map said hold $88 and the $93.8 to $95.3 band comes next. It ran straight through that band and tagged $97.2, right inside the $97 to $98 supply zone.
Strong isn’t the same as immune, though. That $97.2 top printed as a buying climax, the overheated peak where late money rushes in, and price has slipped about 8% since. The heaviest red volume of the move hit on the dip toward $89.8, so sellers are clearly active up here.
Levels that decide it:
Hold $88 → this becomes a base for another run at $97 to $98.
Lose $88 → $82.5, the top of the old accumulation box, is the next real support.
One more risk: relative strength rarely survives a market that keeps falling. If BTC loses its $75K floor, even HYPE’s story may not be enough.
Market leader, or the last domino to fall?
Leaders in a red market get tested hardest. This one’s exam is $88.
Not financial advice.
$HYPE
{future}(HYPEUSDT)
$ZEC
{future}(ZECUSDT)
$BTC
{future}(BTCUSDT)
📈 BTC -4%. ETH -5%. SOL -6%. HYPE +13%.
The whole board is bleeding, and one chart refuses to follow.
The reason is still yesterday’s headline: NYSE owner ICE plans a regulated US venue for perpetual futures built on HYPE’s network.
While the hawkish Fed and the Big Tech selloff dragged most of the market down, that story kept a bid under HYPE.
The volume says this isn’t a thin pump. HYPE did $3.47B in 24h futures volume, more than SOL’s $3.13B and third only behind BTC and ETH.
For the record, yesterday’s map said hold $88 and the $93.8 to $95.3 band comes next. It ran straight through that band and tagged $97.2, right inside the $97 to $98 supply zone.
Strong isn’t the same as immune, though. That $97.2 top printed as a buying climax, the overheated peak where late money rushes in, and price has slipped about 8% since. The heaviest red volume of the move hit on the dip toward $89.8, so sellers are clearly active up here.
Levels that decide it:
Hold $88 → this becomes a base for another run at $97 to $98.
Lose $88 → $82.5, the top of the old accumulation box, is the next real support.
One more risk: relative strength rarely survives a market that keeps falling. If BTC loses its $75K floor, even HYPE’s story may not be enough.
Market leader, or the last domino to fall?
Leaders in a red market get tested hardest. This one’s exam is $88.
Not financial advice.
$HYPE
$ZEC
$BTC
1
770
·
--
Падение
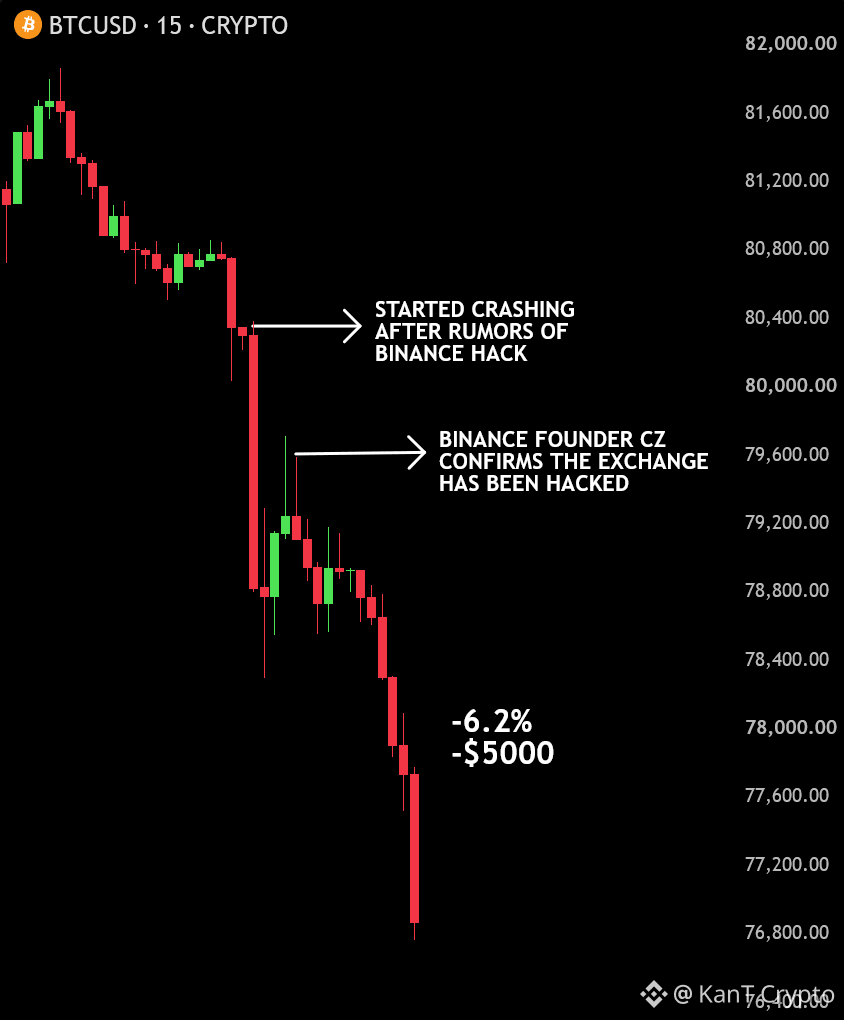
BREAKING: Bitcoin crashes below $77,000 following one of the largest hack in financial recorded history.
Estimated losses reach $5.6 BILLION, nearly 3.9% of Binance's entire $144 Billion in assets under custody.
Binance says $3 Billion worth of stolen crypto has been frozen so far.
$170 Billion wiped out from the crypto market as $1.32 Billion worth of positions were liquidated in just 12 hours.
$BTC
{future}(BTCUSDT)
$ETH
{future}(ETHUSDT)
$SOL
{future}(SOLUSDT)
BREAKING: Bitcoin crashes below $77,000 following one of the largest hack in financial recorded history.
Estimated losses reach $5.6 BILLION, nearly 3.9% of Binance's entire $144 Billion in assets under custody.
Binance says $3 Billion worth of stolen crypto has been frozen so far.
$170 Billion wiped out from the crypto market as $1.32 Billion worth of positions were liquidated in just 12 hours.
$BTC
$ETH
$SOL
2
305
·
--
Падение
JUST IN: Over $1.3 billion in leveraged crypto longs have been liquidated in the past 5 hours.
This comes after Binance was hacked, with an estimated $5.7 billion in cryptocurrency stolen, making it the largest hack in crypto history.
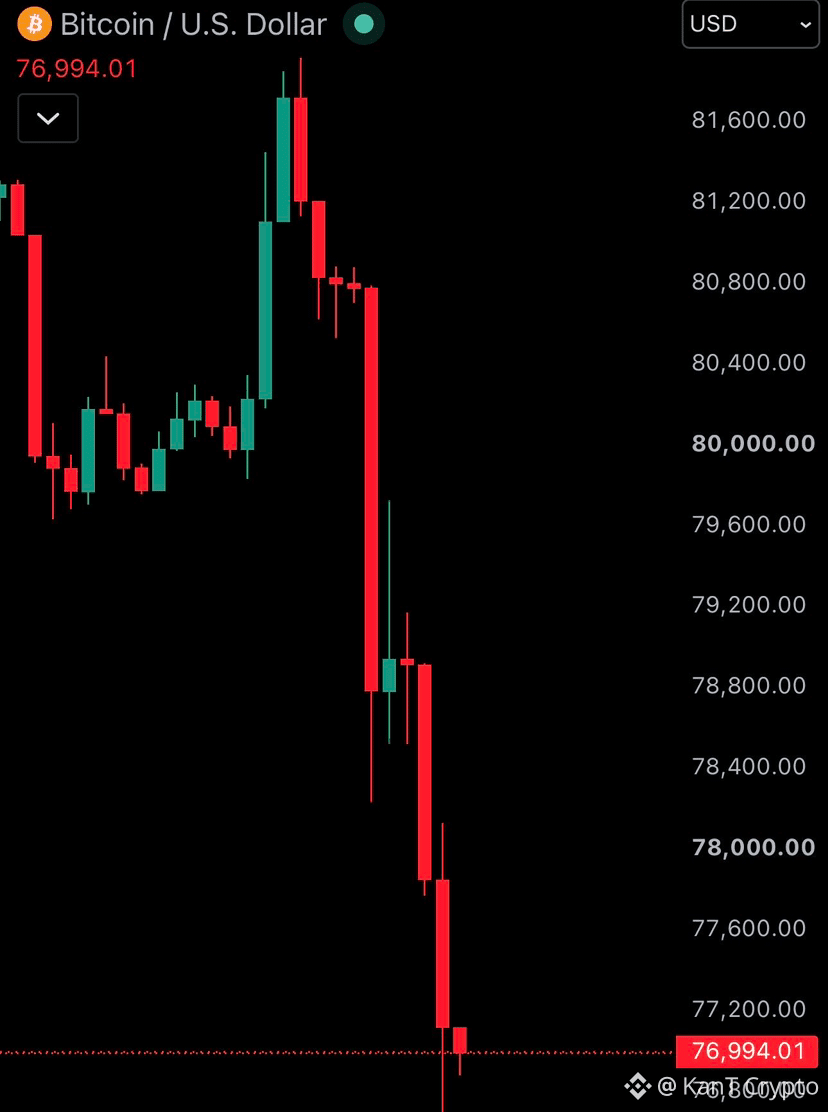
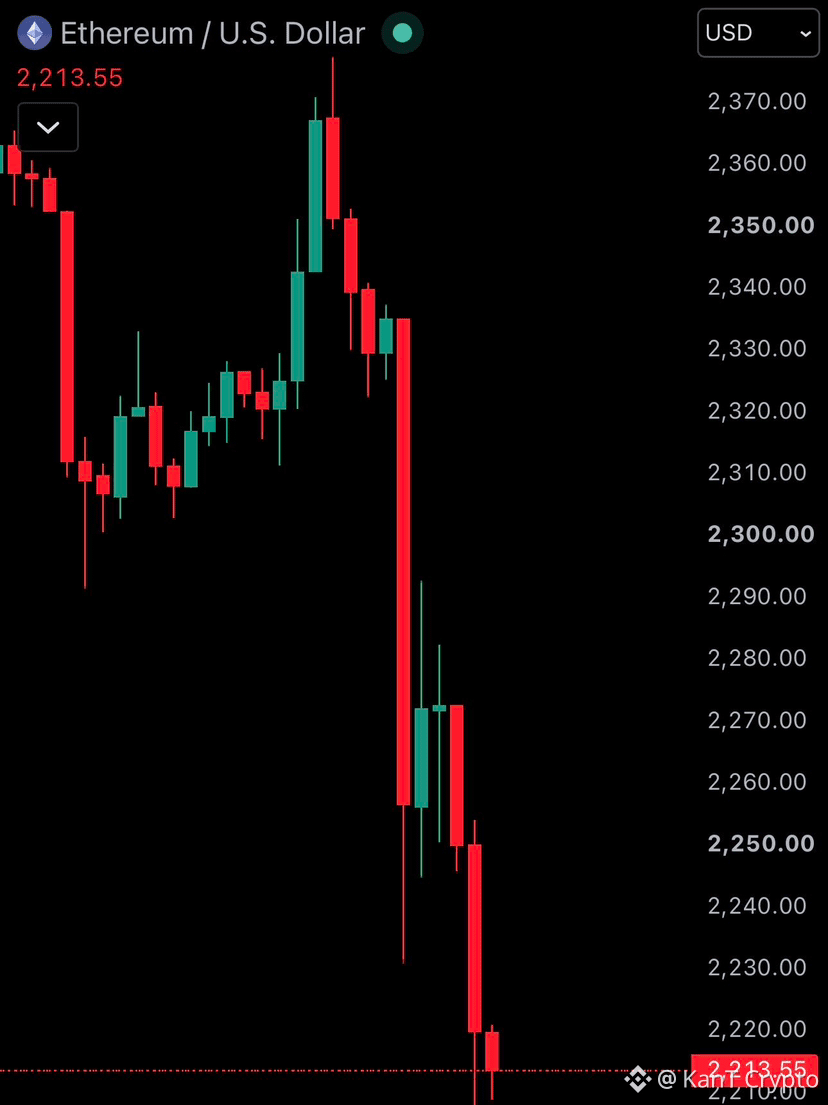
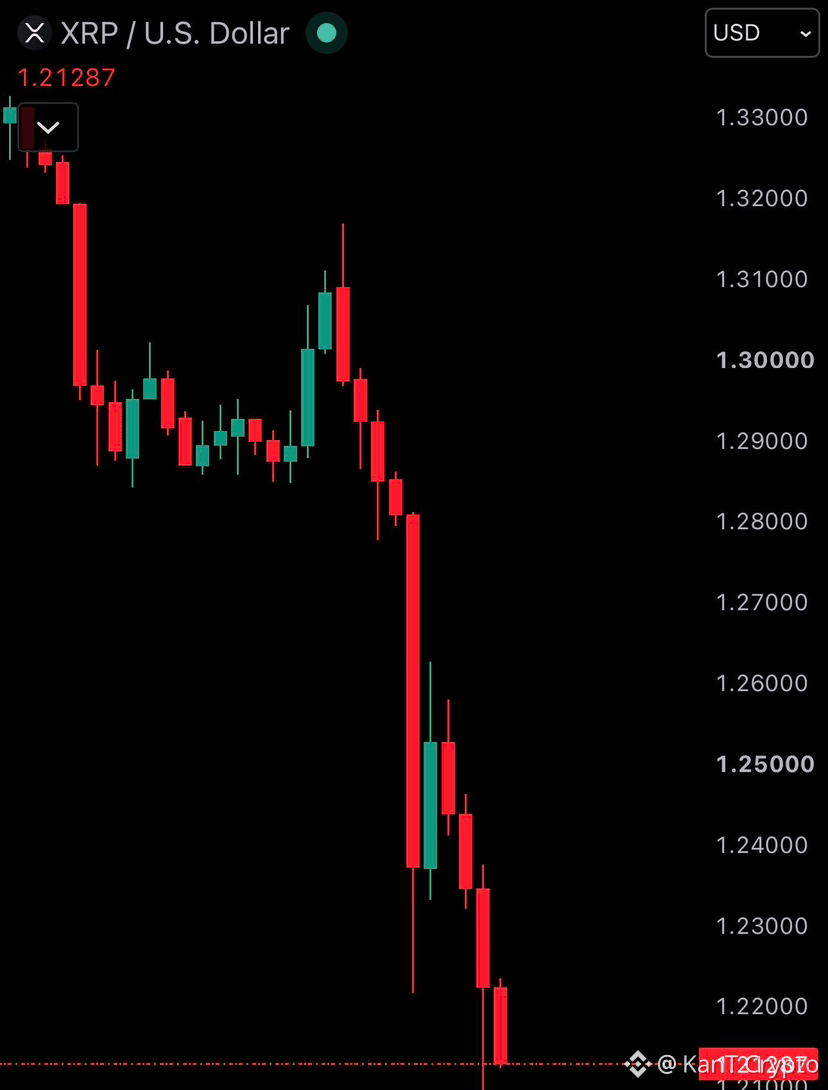
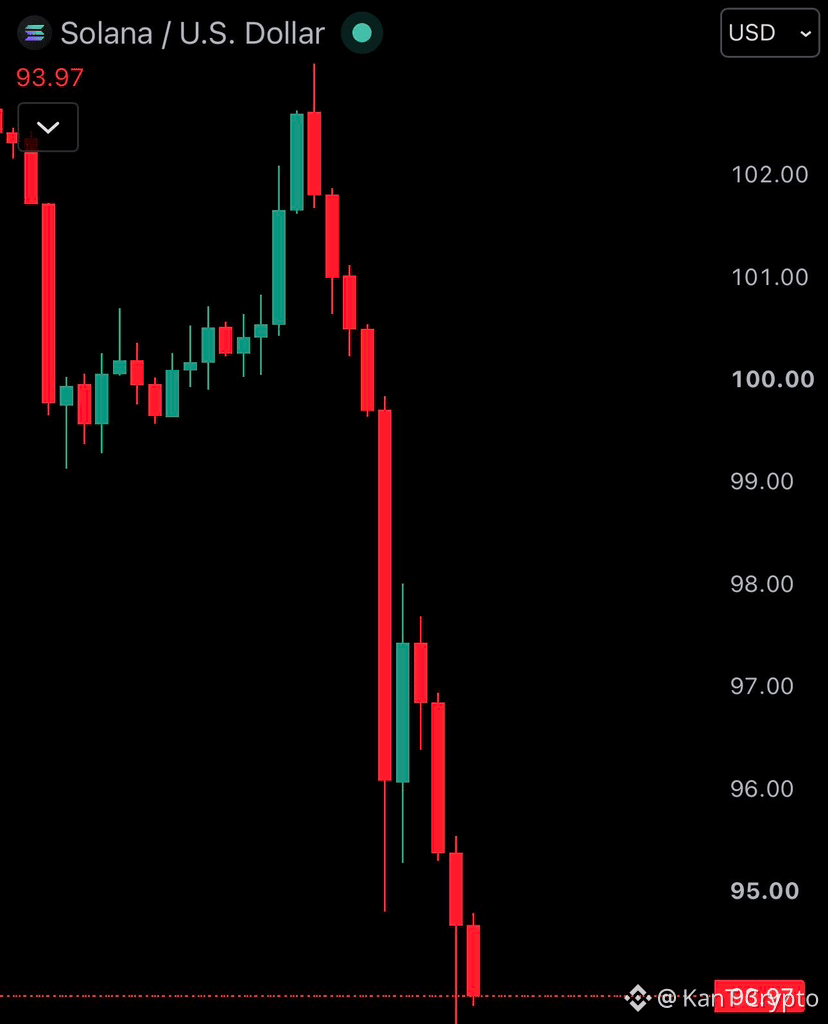
Bitcoin, Ethereum, and other cryptocurrencies continue to dump, with $BTC falling under $77,000 and $ETH falling below $2,215
{future}(BTCUSDT)
$ETH
{future}(ETHUSDT)
$XRP
{future}(XRPUSDT)
JUST IN: Over $1.3 billion in leveraged crypto longs have been liquidated in the past 5 hours.
This comes after Binance was hacked, with an estimated $5.7 billion in cryptocurrency stolen, making it the largest hack in crypto history.
Bitcoin, Ethereum, and other cryptocurrencies continue to dump, with $BTC falling under $77,000 and $ETH falling below $2,215
$ETH
$XRP
This comes after Binance was hacked, with an estimated $5.7 billion in cryptocurrency stolen, making it the largest hack in crypto history.
Bitcoin, Ethereum, and other cryptocurrencies continue to dump, with $BTC falling under $77,000 and $ETH falling below $2,215
$ETH
$XRP
1
858
·
--
Падение
Проверено
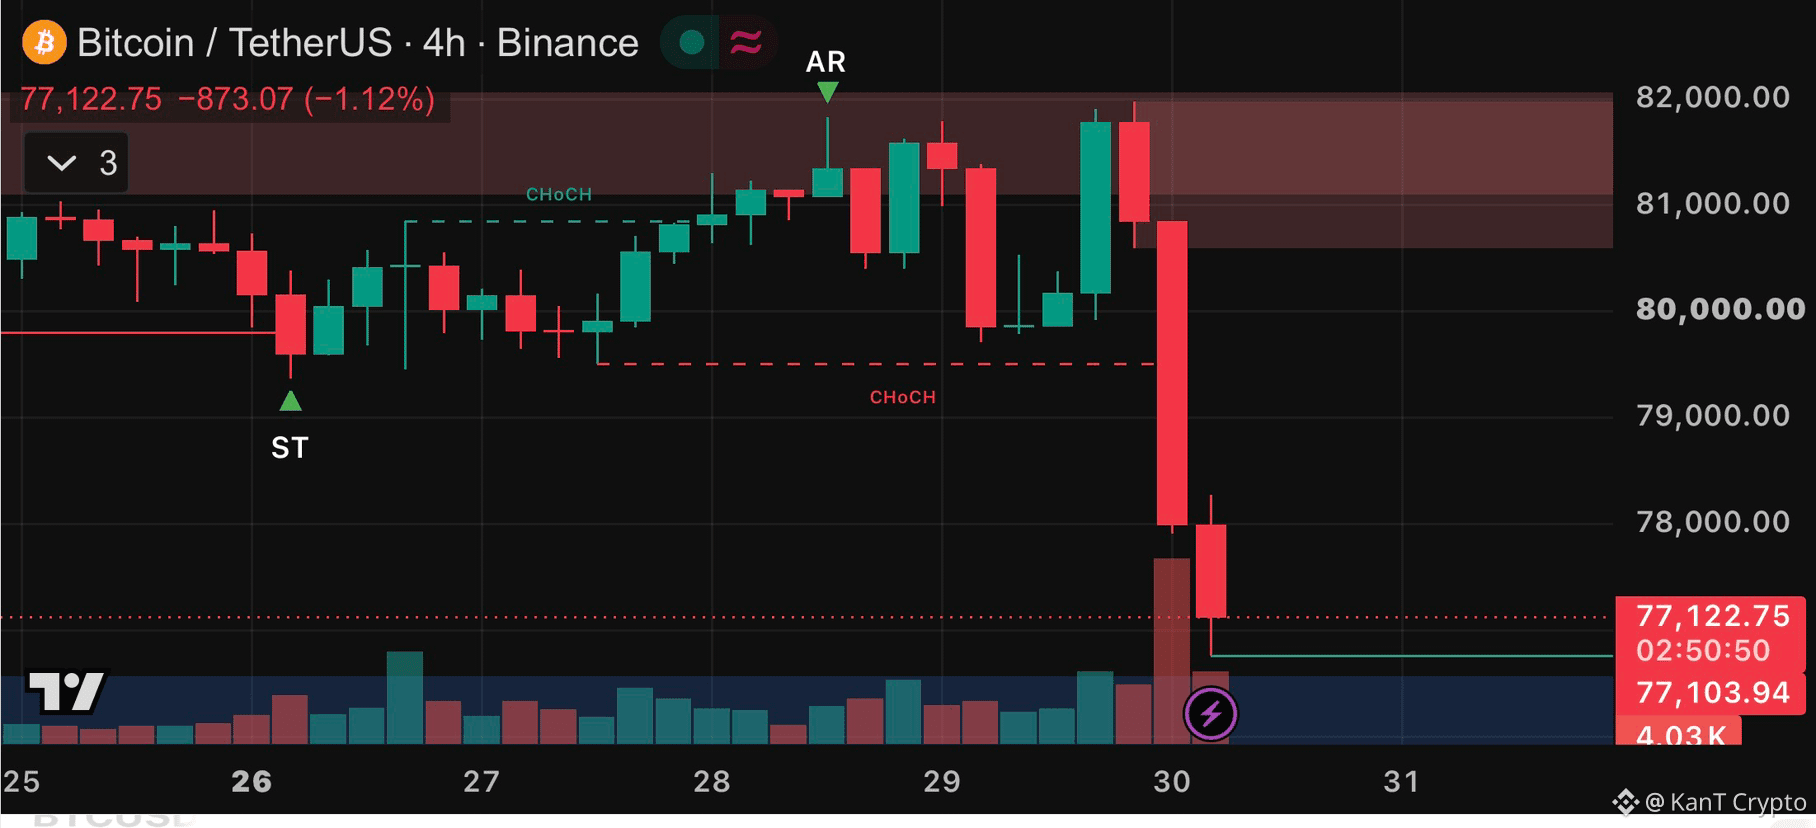
📉 Bitcoin's $79K floor just caved in, and Wall Street pushed it.
From $81.9K to a $76.8K low, and the floor that held all month is gone.
The backdrop turned hostile fast. The Fed held rates at 3.75% to 4% after September's hike, and Chair Warsh said inflation is still too high, keeping a December hike on the table.
Then Big Tech cracked: Alphabet missed on earnings, Samsung's chip profit fell short, and the Nasdaq dropped 1.4%. Crypto got dragged with it. Once $78K broke, forced selling did the rest, with reportedly over $1B liquidated in 24 hours, almost all of it longs.
One 4H candle did most of the damage: $80.8K to $78.0K on the heaviest selling of the chart, then a wick to $76.8K.
For the record, yesterday's map said reclaim $80.4K and $81K gets retested, lose $79.4K and $79.2K is the last line before the $75K to $78K demand zone. Both played out, in that order.
That also breaks the Wyckoff accumulation I've tracked since Oct 24, built on the $79.2K climax low and the $79.3K retest. The only rescue is a spring: a fast dip under the range that snaps back and traps late sellers. That needs a quick reclaim of $79.2K.
The map:
Reclaim $79.2K → spring in play, $80.4K next.
Stay under $78K → the $75K to $78K demand zone gets worked, with $75K as its floor.
The trap right now: catching the knife because "it's already down 6%." With rate-hike talk in the air, that can turn into 10%.
Spring, or a slide to $75K?
Floors that break become ceilings. $79.2K just changed jobs.
Not financial advice.
$BTC
{future}(BTCUSDT)
$ETH
{future}(ETHUSDT)
$BNB
{future}(BNBUSDT)
📉 Bitcoin's $79K floor just caved in, and Wall Street pushed it.
From $81.9K to a $76.8K low, and the floor that held all month is gone.
The backdrop turned hostile fast. The Fed held rates at 3.75% to 4% after September's hike, and Chair Warsh said inflation is still too high, keeping a December hike on the table.
Then Big Tech cracked: Alphabet missed on earnings, Samsung's chip profit fell short, and the Nasdaq dropped 1.4%. Crypto got dragged with it. Once $78K broke, forced selling did the rest, with reportedly over $1B liquidated in 24 hours, almost all of it longs.
One 4H candle did most of the damage: $80.8K to $78.0K on the heaviest selling of the chart, then a wick to $76.8K.
For the record, yesterday's map said reclaim $80.4K and $81K gets retested, lose $79.4K and $79.2K is the last line before the $75K to $78K demand zone. Both played out, in that order.
That also breaks the Wyckoff accumulation I've tracked since Oct 24, built on the $79.2K climax low and the $79.3K retest. The only rescue is a spring: a fast dip under the range that snaps back and traps late sellers. That needs a quick reclaim of $79.2K.
The map:
Reclaim $79.2K → spring in play, $80.4K next.
Stay under $78K → the $75K to $78K demand zone gets worked, with $75K as its floor.
The trap right now: catching the knife because "it's already down 6%." With rate-hike talk in the air, that can turn into 10%.
Spring, or a slide to $75K?
Floors that break become ceilings. $79.2K just changed jobs.
Not financial advice.
$BTC
$ETH
$BNB
2
799
·
--
Падение
Частичная правда
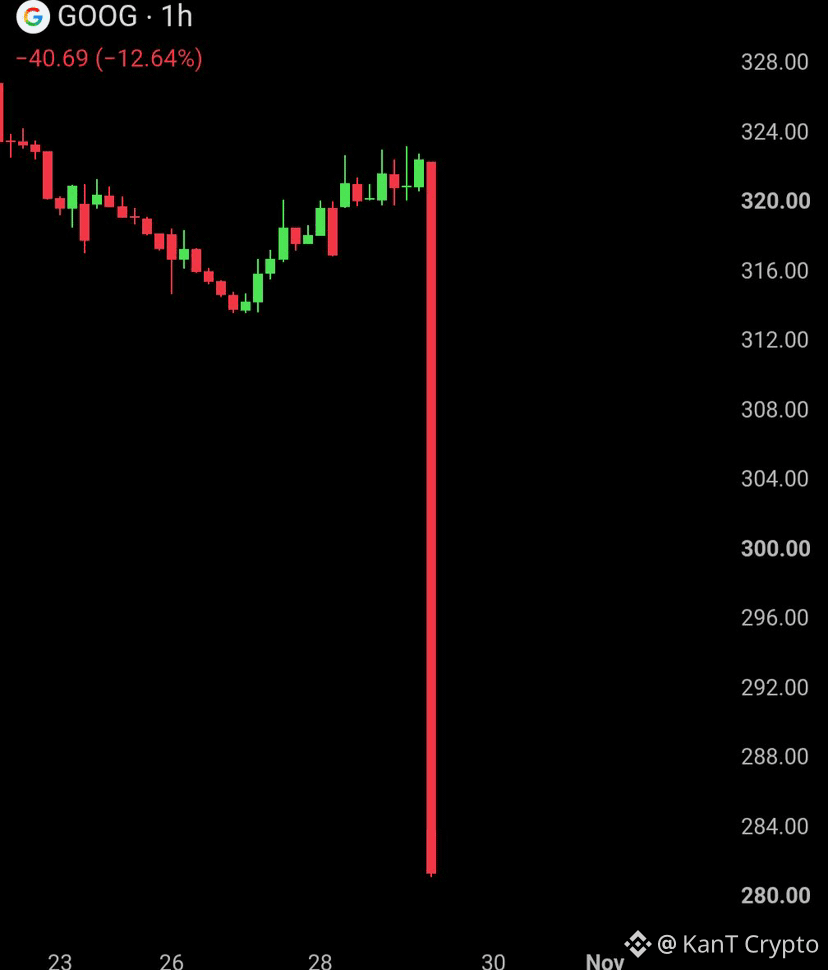
BREAKING: Google $GOOGL is down 13%, wiping out $480 billion from its market cap in just one single day.
That is more than 3.5 times the $127.6 billion Google made in revenue in the entire last quarter.
$SPCX
{future}(SPCXUSDT)
{future}(GOOGLUSDT)
$AAPL
{future}(AAPLUSDT)
BREAKING: Google $GOOGL is down 13%, wiping out $480 billion from its market cap in just one single day.
That is more than 3.5 times the $127.6 billion Google made in revenue in the entire last quarter.
$SPCX
$AAPL
That is more than 3.5 times the $127.6 billion Google made in revenue in the entire last quarter.
$SPCX
$AAPL
1
1.5k
·
--
Рост
🚨 JUST IN: 🇺🇸 Wall Street wants in on HYPE perps. Is THIS the breakout that sticks? 👀
NYSE owner ICE is teaming up with Trade[XYZ] on a regulated US venue for perpetual futures built on Hyperliquid, the network behind HYPE.
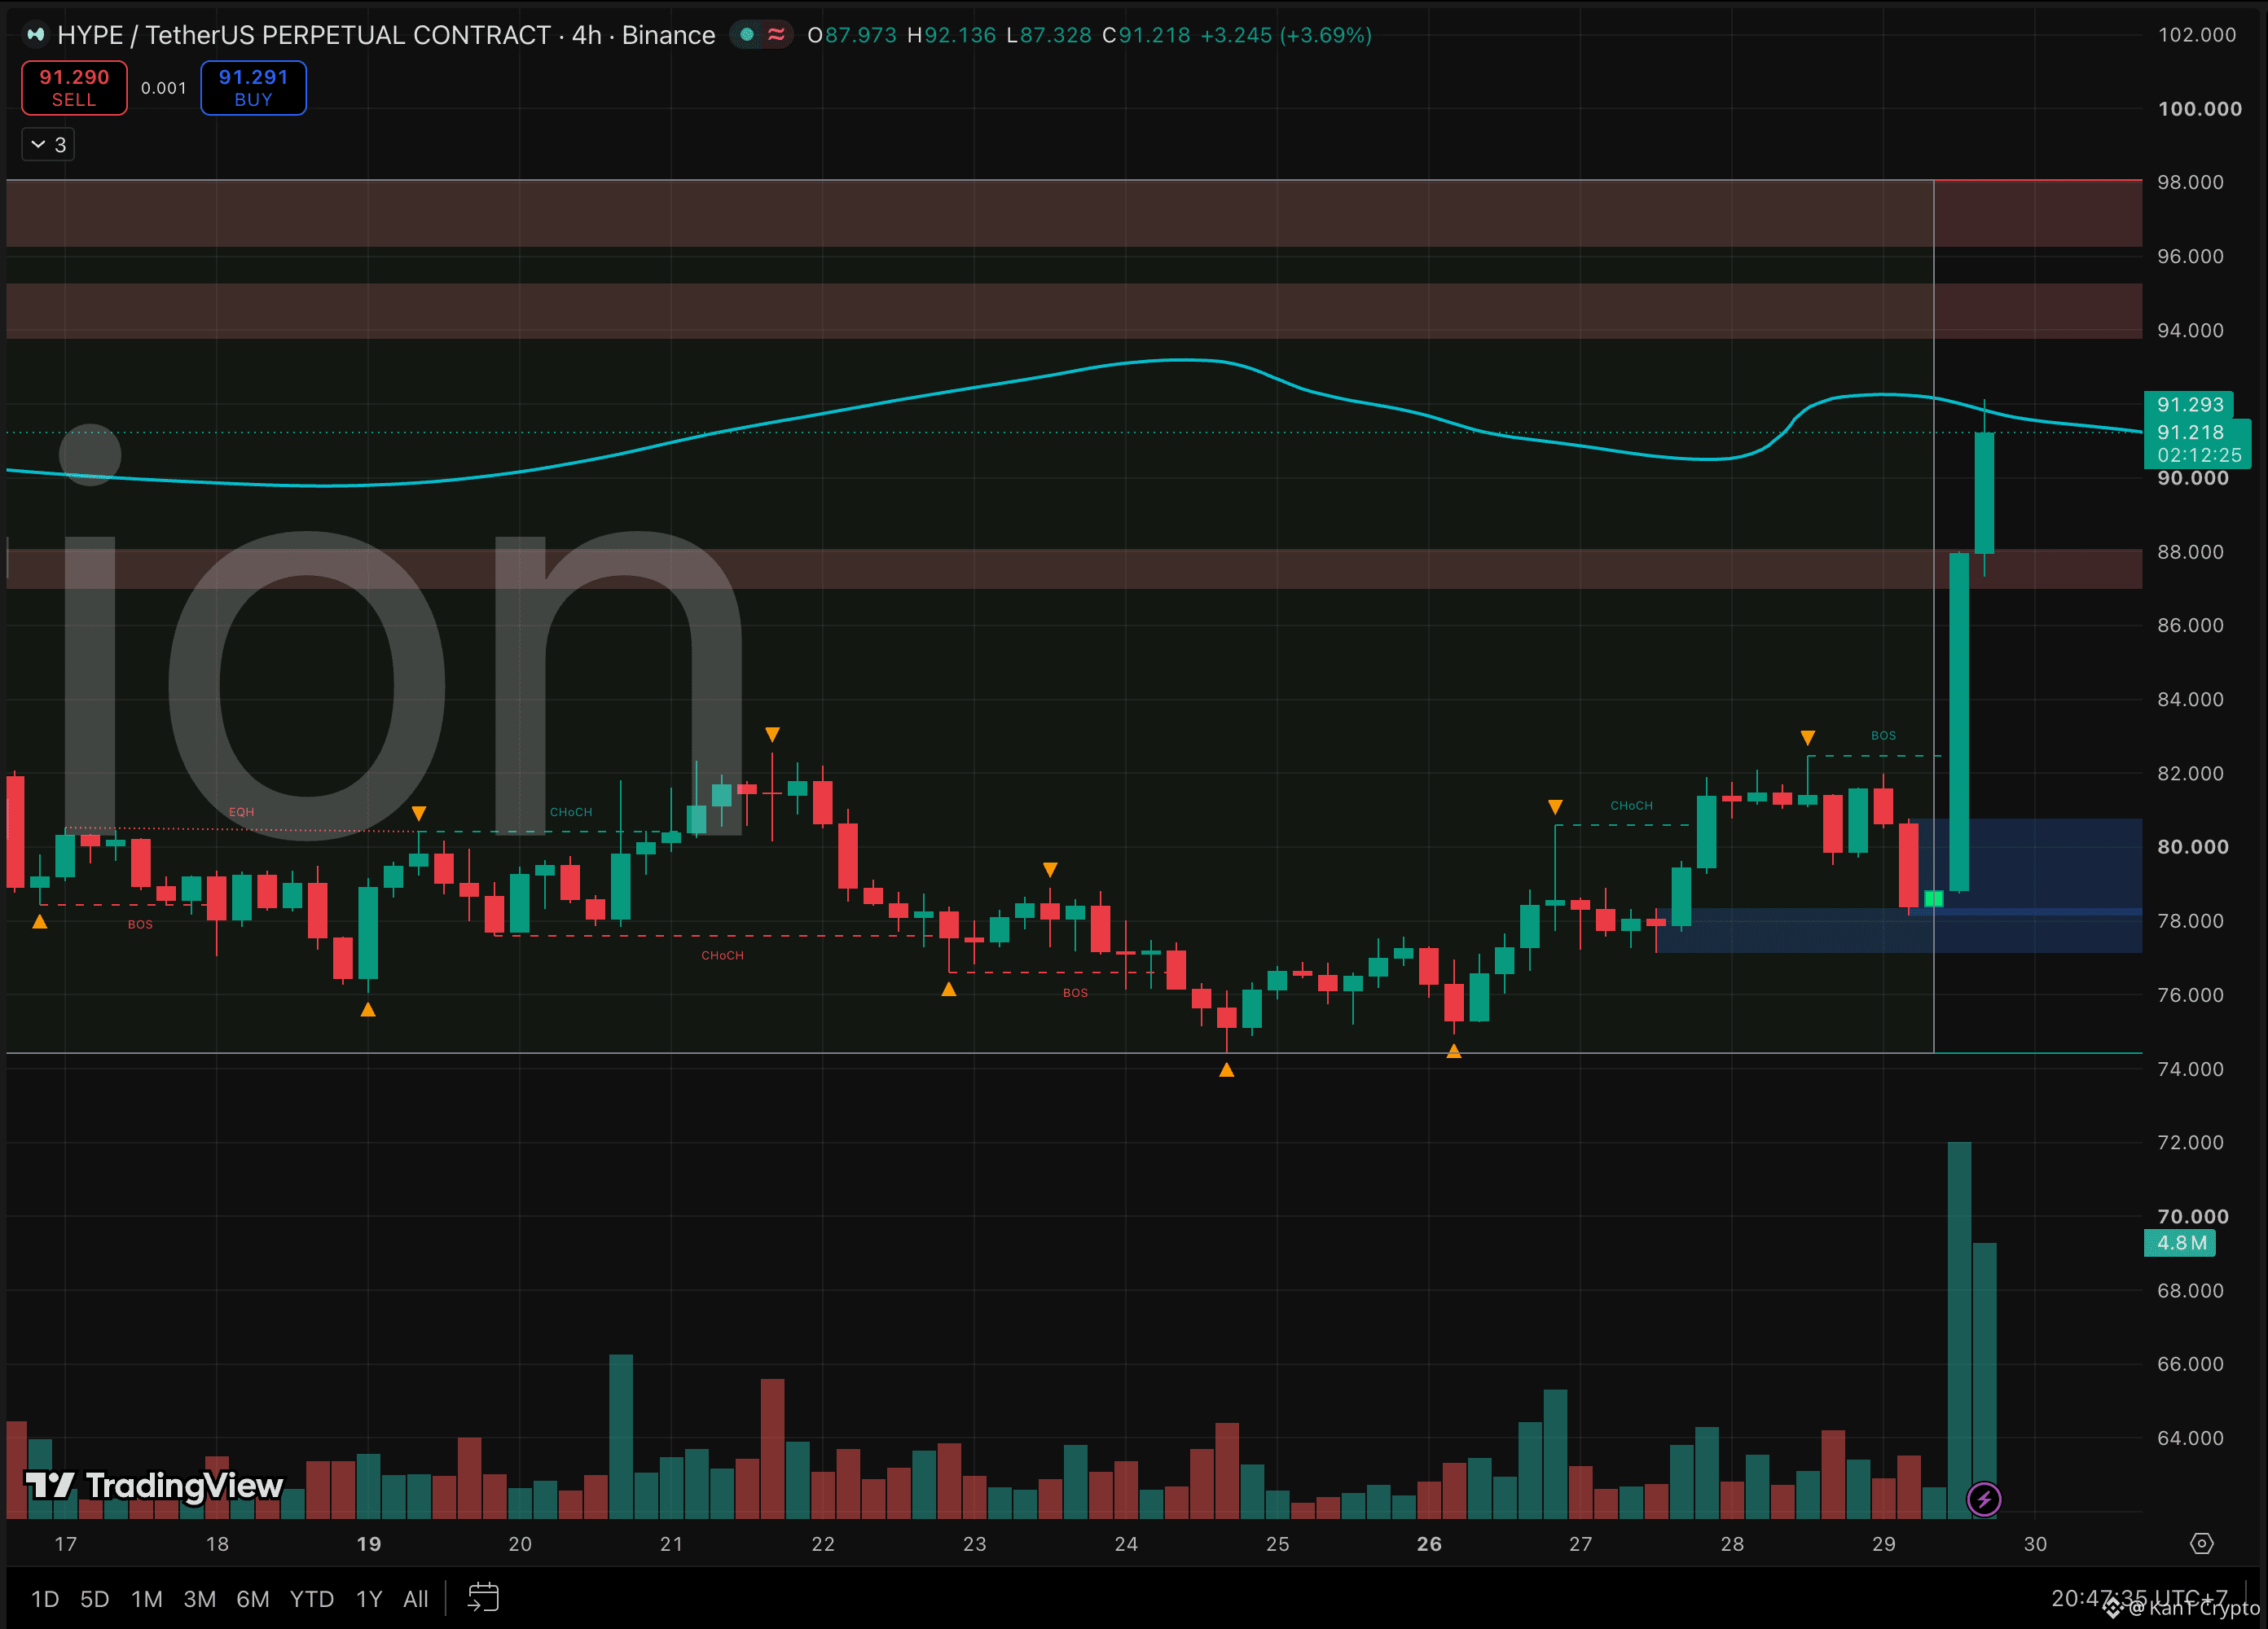
Price didn’t wait. Two 4H candles took HYPE from $78.9 to $92.1, up nearly 17%, on the heaviest volume in two weeks.
That matters because of where it started. For twelve days HYPE was boxed between roughly $74.5 and $82.5, with sellers capping every push. This move cleared $82.5 and the $87 to $88 supply band in one shot.
A perpetual future is a no-expiry contract that tracks price with leverage, the most traded product in crypto. A regulated US doorway tied to HYPE’s own network gives this pump a real fundamental story behind it.
But it’s a plan, not a live product. Launch timing and how much value actually flows back to the token are still unclear.
The bullish case:
A two-week range broke on huge volume.
The old $87 to $88 supply now sits right below as a possible floor.
The catch:
More supply waits at $93.8 to $95.3, then $96.3 to $98.
Headline pumps often give back part of the move once the first wave of buyers is in.
The map:
4H closes holding above $88 → $93.8 to $95.3 is next.
Lose $88 → $82.5, the old range top, gets retested.
The trap right now: chasing the headline candle. If the story is real, a retest of $88 offers a calmer seat.
Headlines start moves. Retests decide if they last.
Not financial advice.
$HYPE
{future}(HYPEUSDT)
$ZEC
{future}(ZECUSDT)
$BTC
{future}(BTCUSDT)
🚨 JUST IN: 🇺🇸 Wall Street wants in on HYPE perps. Is THIS the breakout that sticks? 👀
NYSE owner ICE is teaming up with Trade[XYZ] on a regulated US venue for perpetual futures built on Hyperliquid, the network behind HYPE.
Price didn’t wait. Two 4H candles took HYPE from $78.9 to $92.1, up nearly 17%, on the heaviest volume in two weeks.
That matters because of where it started. For twelve days HYPE was boxed between roughly $74.5 and $82.5, with sellers capping every push. This move cleared $82.5 and the $87 to $88 supply band in one shot.
A perpetual future is a no-expiry contract that tracks price with leverage, the most traded product in crypto. A regulated US doorway tied to HYPE’s own network gives this pump a real fundamental story behind it.
But it’s a plan, not a live product. Launch timing and how much value actually flows back to the token are still unclear.
The bullish case:
A two-week range broke on huge volume.
The old $87 to $88 supply now sits right below as a possible floor.
The catch:
More supply waits at $93.8 to $95.3, then $96.3 to $98.
Headline pumps often give back part of the move once the first wave of buyers is in.
The map:
4H closes holding above $88 → $93.8 to $95.3 is next.
Lose $88 → $82.5, the old range top, gets retested.
The trap right now: chasing the headline candle. If the story is real, a retest of $88 offers a calmer seat.
Headlines start moves. Retests decide if they last.
Not financial advice.
$HYPE
$ZEC
$BTC
1
504
·
--
Рост
Проверено
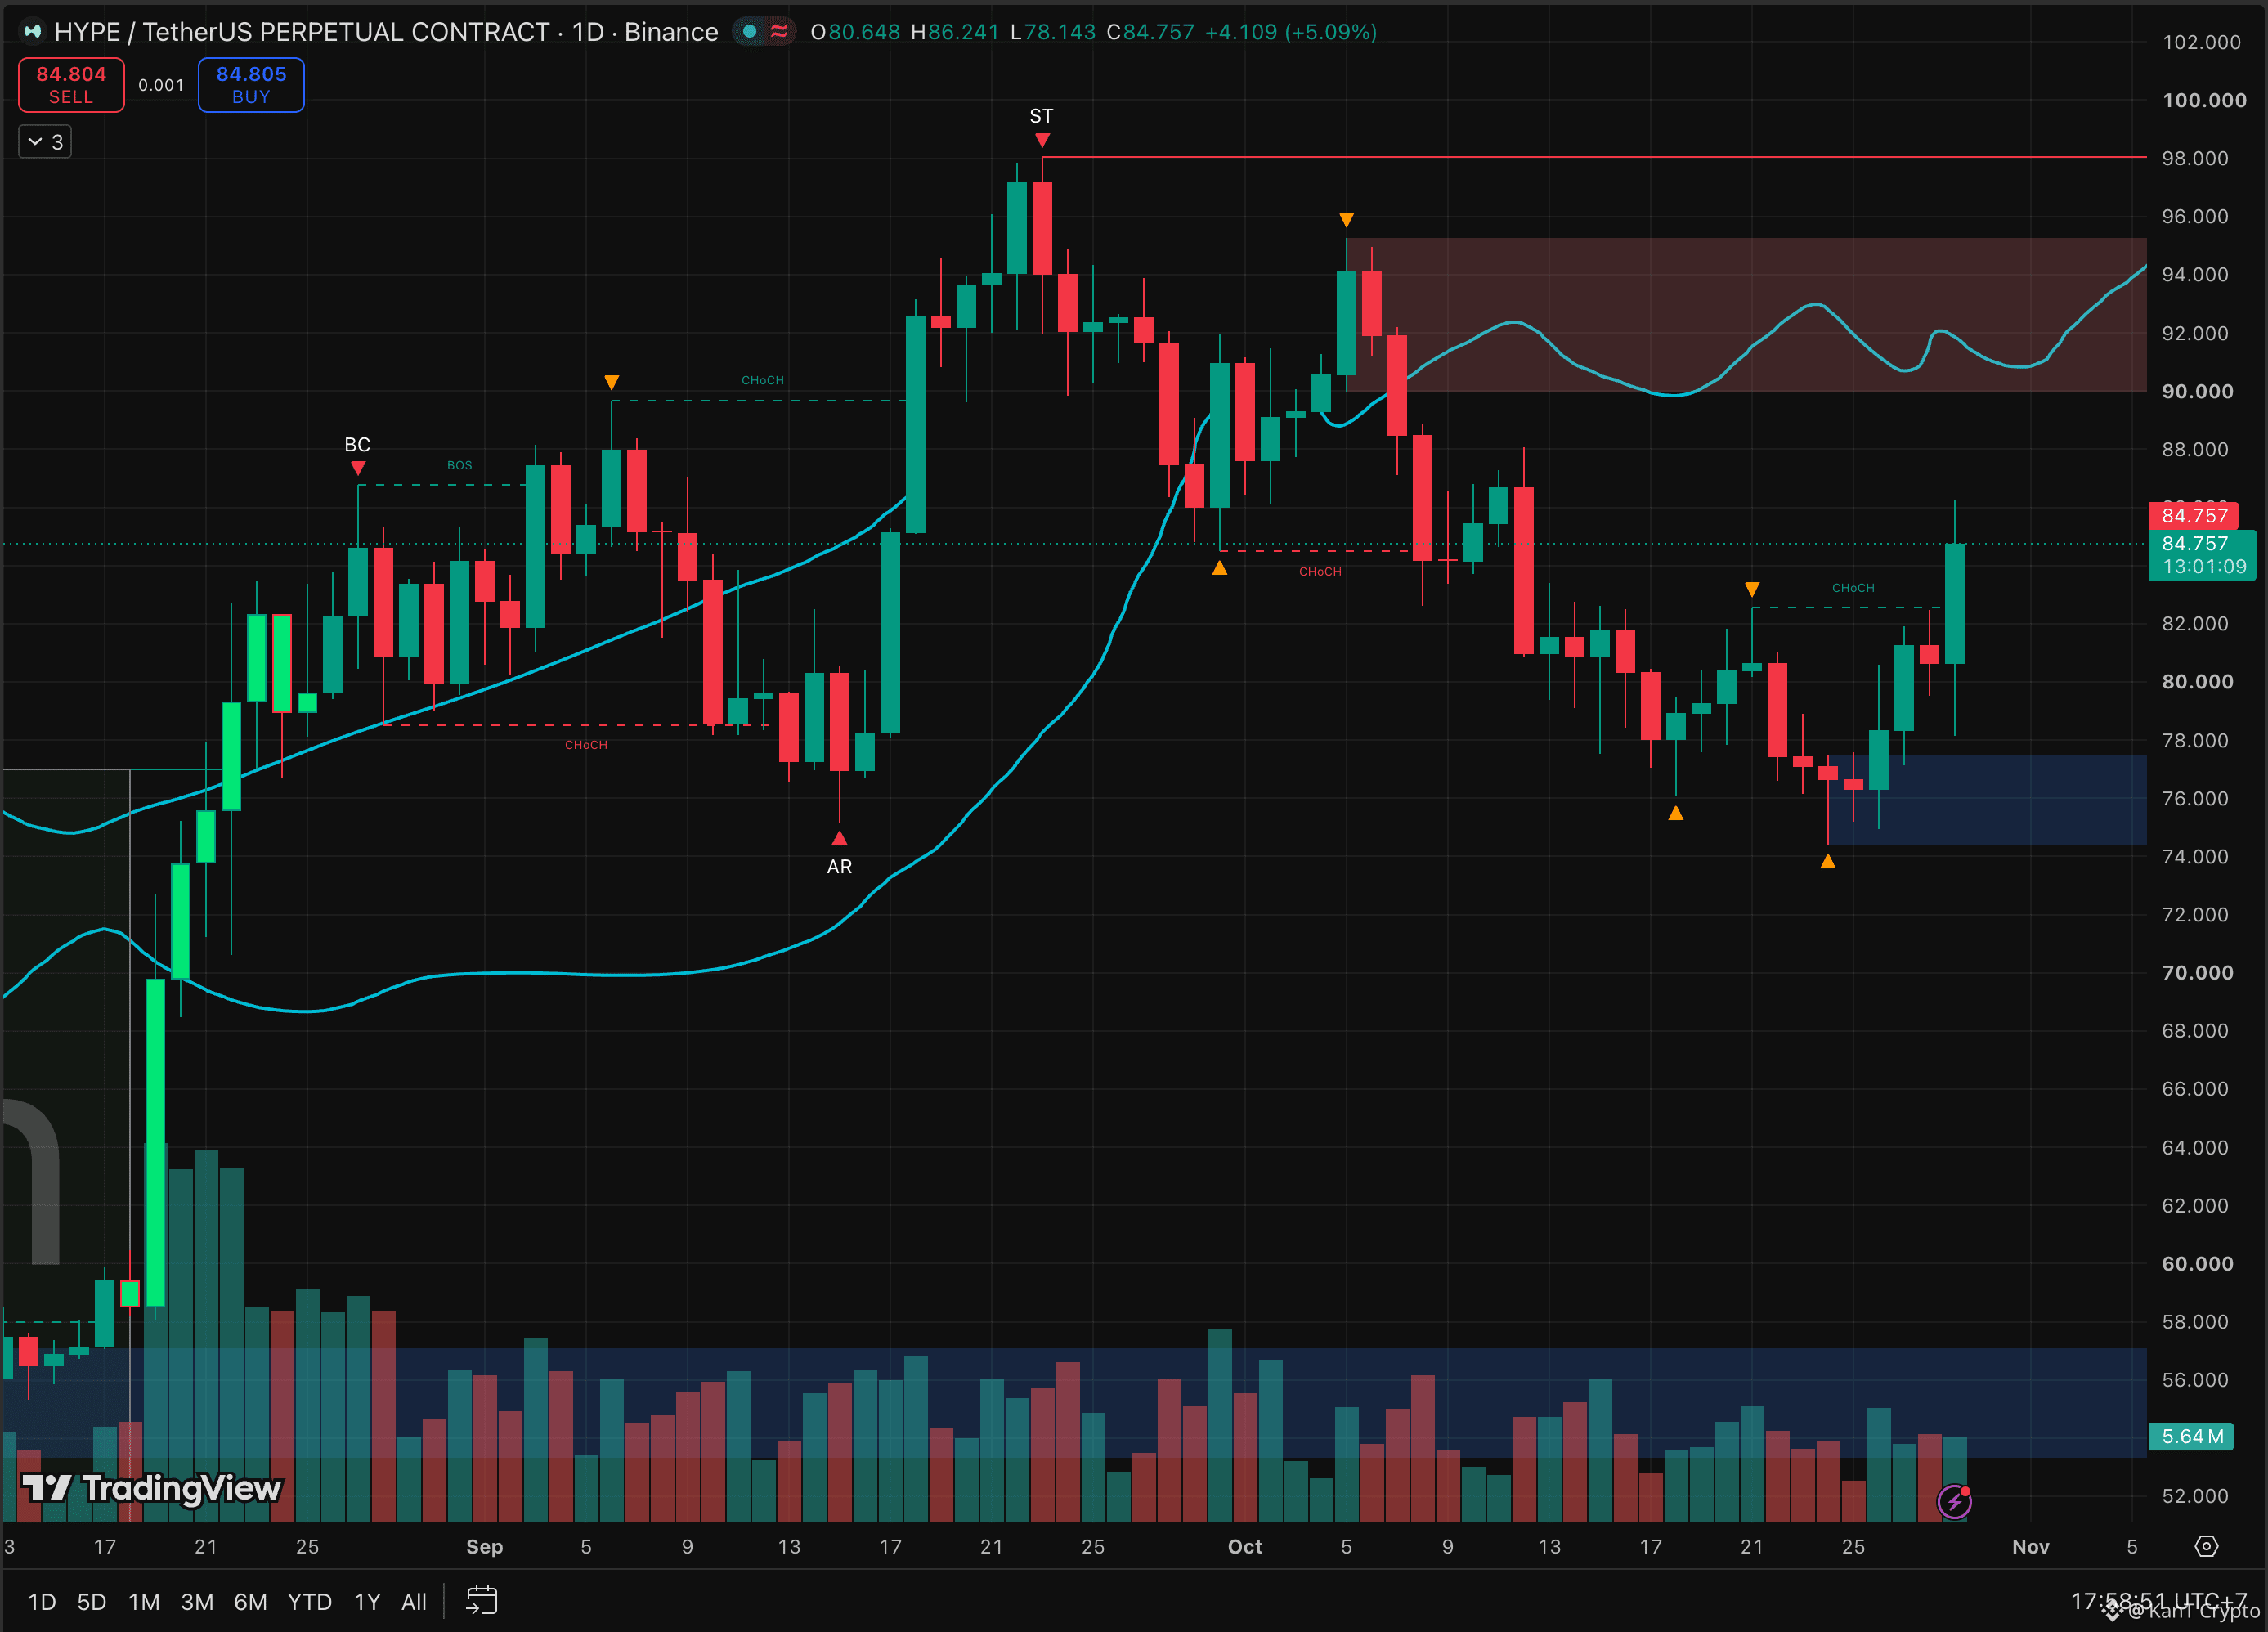
JUST IN: 🇺🇸 NYSE owner to bring Hyperliquid perpetual futures to regulated U.S. markets.
$HYPE
{future}(HYPEUSDT)
$ZEC
{future}(ZECUSDT)
$SOL
{future}(SOLUSDT)
JUST IN: 🇺🇸 NYSE owner to bring Hyperliquid perpetual futures to regulated U.S. markets.
$HYPE
$ZEC
$SOL
$HYPE
$ZEC
$SOL
1
327
·
--
Рост
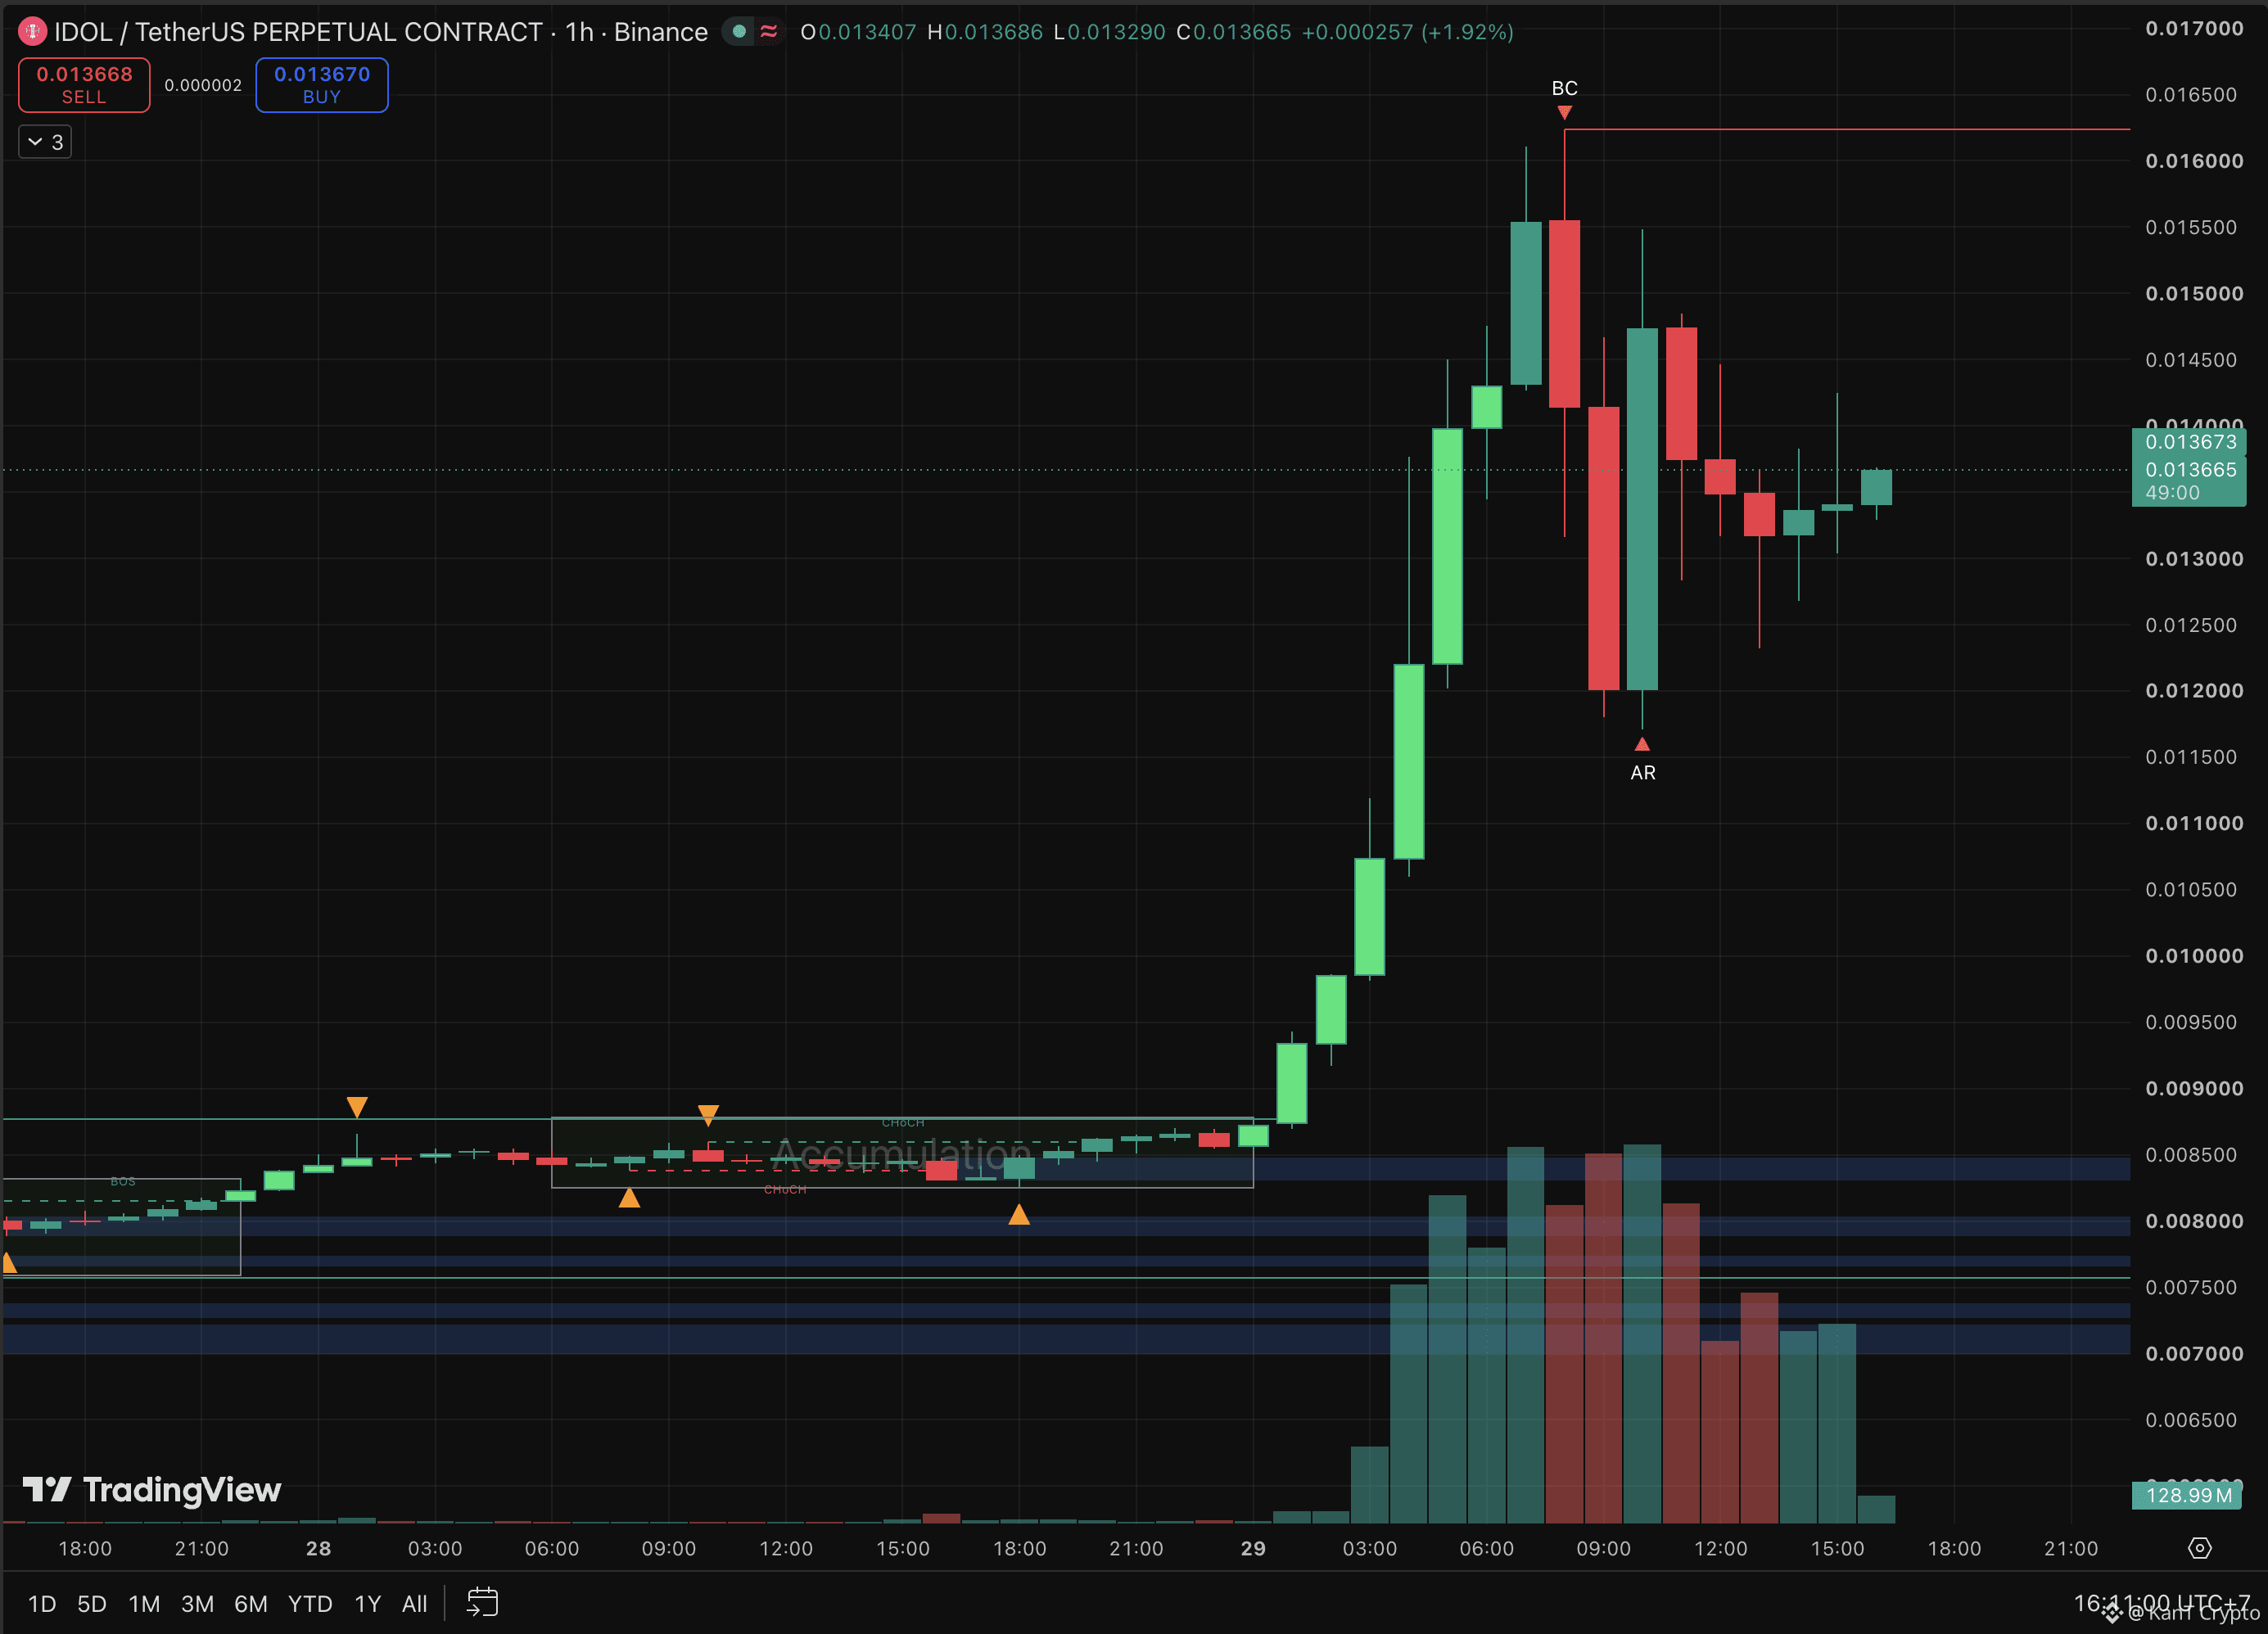
📊 IDOL ran 89% in 8 hours, then gave back 28% in two hours. Reload or TOP? 👀
A quiet $0.0086 base, a $0.0162 peak, and now a wide new box in between.
The climb was clean: eight straight green hourly candles out of a day-long accumulation zone near $0.0083 to $0.0088. Then the top came fast. The buying climax at $0.0162, the frenzied peak where late money piles in, was followed by a dump to $0.012, and the next candle wicked to $0.0117 before ripping back to $0.0155.
That sequence draws the map. In Wyckoff terms, a buying climax plus the automatic reaction after it (the AR, the first hard drop) mark the two walls of a new range: $0.0117 below, $0.0162 above. Since then price has been feeling around inside, and volume is cooling.
The case for a reload:
The $0.0117 AR low got bought instantly.
Lows since have held above $0.0123.
The case for a top:
Every bounce since the spike has topped lower, $0.0155 and then $0.0143.
The heaviest red volume printed right at the peak.
The map:
Hourly close above $0.0143 → $0.0155, then the $0.0162 top.
Lose $0.0123 → the $0.0117 AR low, and under it the $0.0088 base the run launched from.
The trap right now: treating a 38% box like a trend. The middle of a range this wide is where accounts get chopped.
Climaxes draw the box. Breakouts pick the exit.
Not financial advice.
$IDOL
{future}(IDOLUSDT)
$INIT
{future}(INITUSDT)
$BTC
{future}(BTCUSDT)
📊 IDOL ran 89% in 8 hours, then gave back 28% in two hours. Reload or TOP? 👀
A quiet $0.0086 base, a $0.0162 peak, and now a wide new box in between.
The climb was clean: eight straight green hourly candles out of a day-long accumulation zone near $0.0083 to $0.0088. Then the top came fast. The buying climax at $0.0162, the frenzied peak where late money piles in, was followed by a dump to $0.012, and the next candle wicked to $0.0117 before ripping back to $0.0155.
That sequence draws the map. In Wyckoff terms, a buying climax plus the automatic reaction after it (the AR, the first hard drop) mark the two walls of a new range: $0.0117 below, $0.0162 above. Since then price has been feeling around inside, and volume is cooling.
The case for a reload:
The $0.0117 AR low got bought instantly.
Lows since have held above $0.0123.
The case for a top:
Every bounce since the spike has topped lower, $0.0155 and then $0.0143.
The heaviest red volume printed right at the peak.
The map:
Hourly close above $0.0143 → $0.0155, then the $0.0162 top.
Lose $0.0123 → the $0.0117 AR low, and under it the $0.0088 base the run launched from.
The trap right now: treating a 38% box like a trend. The middle of a range this wide is where accounts get chopped.
Climaxes draw the box. Breakouts pick the exit.
Not financial advice.
$IDOL
$INIT
$BTC
1
443
·
--
Падение
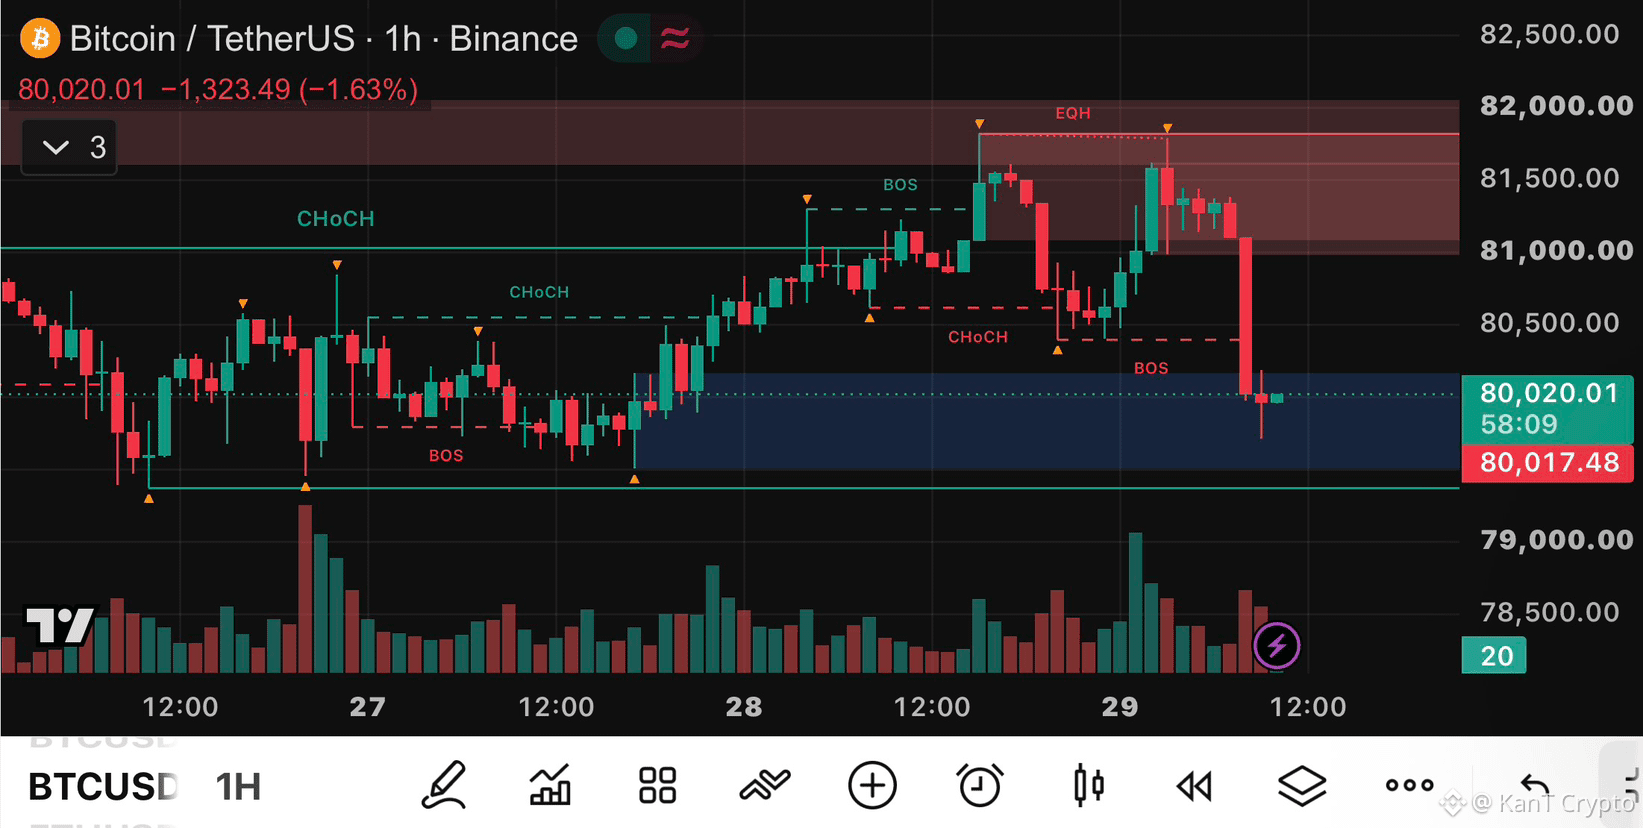
📉 Bitcoin just dropped $1,100 in one hour. Was $81.8K the TOP? 👀
Two taps at $81.8K, then a single red candle erased two days of grinding higher.
For the record, my last map said a 4H close above $81.3K makes $82K the real test, and a slip back under $80.8K means the breakout failed. The first part half happened: price pushed to $81.8K twice but never reached $82K. Now the second part is in. By my own rule, the breakout has failed.
Those two tops at the same price are equal highs, a double top with stop orders stacked just above. Price never went for them. Instead, one hourly candle fell from $81.1K to $80.0K with a wick to $79.7K, snapping the $80.4K break of structure, the last higher low of the climb.
So where does that leave things?
The case for a bounce:
Price is back in the $79.5K to $80.2K demand zone that held all week.
The $79.7K wick got bought within the same hour.
The case against:
$81.8K is now a clear ceiling under $82K.
With $80.4K gone, the short-term trend has flipped down.
The map:
Reclaim $80.4K → back inside the range, and $81K gets retested.
Lose $79.4K → the week's lows break, and the $79.2K climax low from Oct 24 is the last line before the $75K to $78K demand zone.
The trap right now: calling a crash on one candle, or buying the dip on one wick. Let the next few closes speak.
Double tops whisper. Breakdowns shout.
Not financial advice.
$BTC
{future}(BTCUSDT)
$ETH
{future}(ETHUSDT)
$SOL
{future}(SOLUSDT)
📉 Bitcoin just dropped $1,100 in one hour. Was $81.8K the TOP? 👀
Two taps at $81.8K, then a single red candle erased two days of grinding higher.
For the record, my last map said a 4H close above $81.3K makes $82K the real test, and a slip back under $80.8K means the breakout failed. The first part half happened: price pushed to $81.8K twice but never reached $82K. Now the second part is in. By my own rule, the breakout has failed.
Those two tops at the same price are equal highs, a double top with stop orders stacked just above. Price never went for them. Instead, one hourly candle fell from $81.1K to $80.0K with a wick to $79.7K, snapping the $80.4K break of structure, the last higher low of the climb.
So where does that leave things?
The case for a bounce:
Price is back in the $79.5K to $80.2K demand zone that held all week.
The $79.7K wick got bought within the same hour.
The case against:
$81.8K is now a clear ceiling under $82K.
With $80.4K gone, the short-term trend has flipped down.
The map:
Reclaim $80.4K → back inside the range, and $81K gets retested.
Lose $79.4K → the week's lows break, and the $79.2K climax low from Oct 24 is the last line before the $75K to $78K demand zone.
The trap right now: calling a crash on one candle, or buying the dip on one wick. Let the next few closes speak.
Double tops whisper. Breakdowns shout.
Not financial advice.
$BTC
$ETH
$SOL
1
1.3k
·
--
Падение
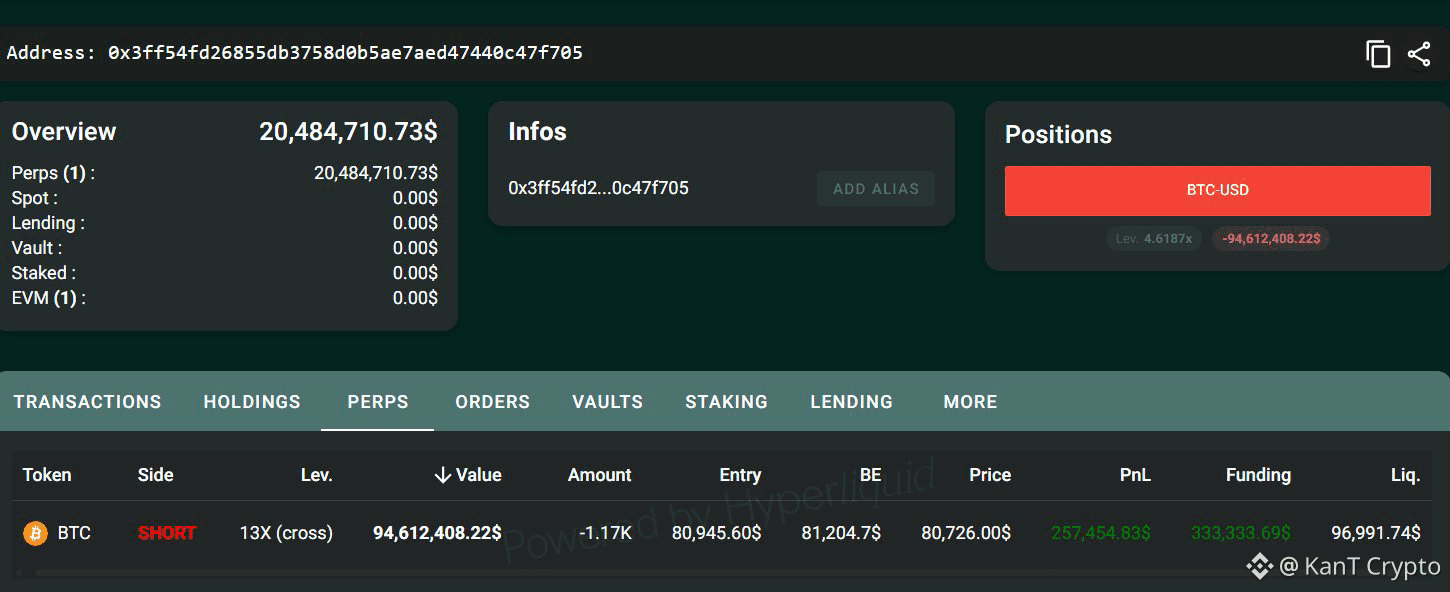
BREAKING:
A whale has opened a $94.6 Million BTC short right before today's FOMC meeting.
Does he know something?
$BTC
{future}(BTCUSDT)
$ETH
{future}(ETHUSDT)
$SOL
{future}(SOLUSDT)
BREAKING:
A whale has opened a $94.6 Million BTC short right before today's FOMC meeting.
Does he know something?
$BTC
$ETH
$SOL
A whale has opened a $94.6 Million BTC short right before today's FOMC meeting.
Does he know something?
$BTC
$ETH
$SOL
1
142
Войдите, чтобы посмотреть больше материала
Присоединяйтесь к пользователям криптовалют по всему миру на Binance Square
⚡️ Получайте новейшую и полезную информацию о криптоактивах.
💬 Нам доверяет крупнейшая в мире криптобиржа.
👍 Получите достоверные аналитические данные от верифицированных создателей контента.
Эл. почта/номер телефона
В тренде
BinanceReports80%Recoveryof$6.3BillioninLossesfromHackIncident
Просмотров: 268
22 обсуждают
Binance News Update | Binance Co-CEOs Say 80% of the $6.3 Billion Loss Is Already Covered, With Withdrawals Restarting in Phases and Proof of Reserves Due Monday
Binance News
·Лайков: 181
·Просмотров: 159k
HeYiSaysWithdrawalsExpectedtoResumeWithin42Hours
Просмотров: 0
15 обсуждают
CZSaysCompensationIsinPlaceUsersAreProtected
Просмотров: 0
2 обсуждают