

AJJUBHAI GJ13
459 Публикации

AJJUBHAI GJ13
Отправить жалобу
Заблокировать пользователя
Трейдер с регулярными сделками
3.8 г
492 подписок(и/а)
10.7K+ подписчиков(а)
291 понравилось
Посты
Все
Цитирования
Видео
Активно
·
--
Рост
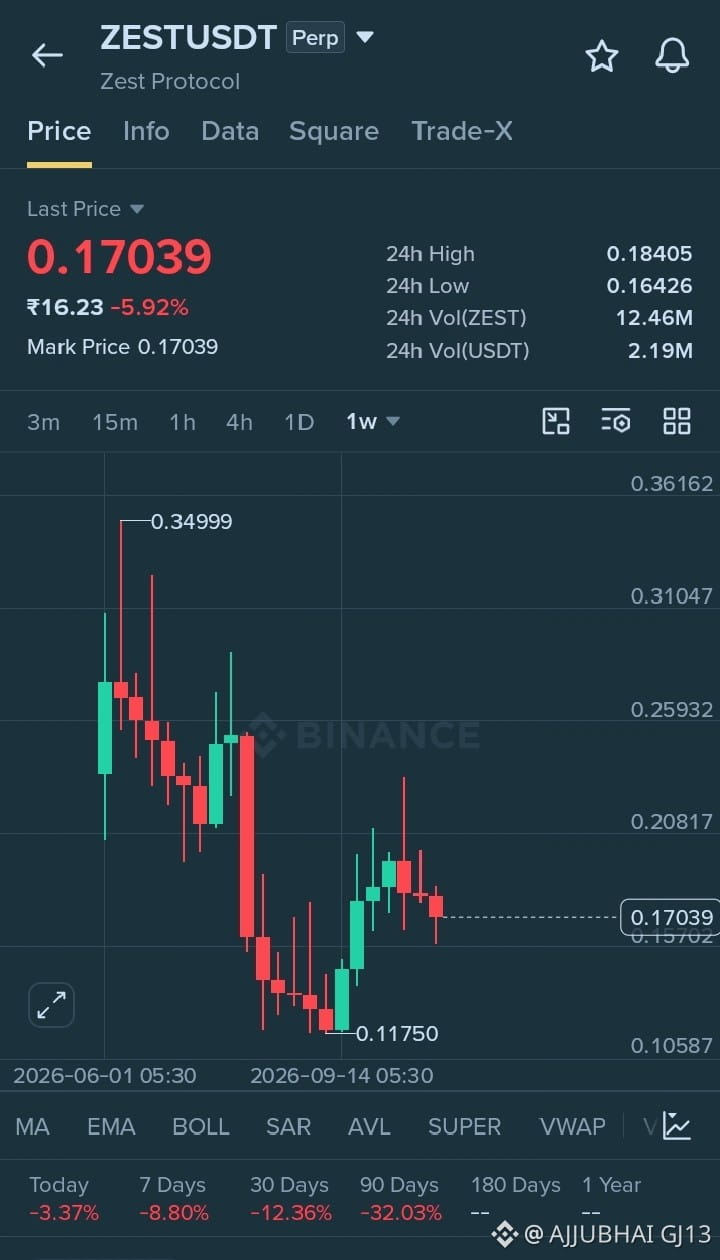
🚀 $ZEST Protocol ($ZEST): A Strong Recovery Could Be Ahead – Is This a Long-Term Opportunity?
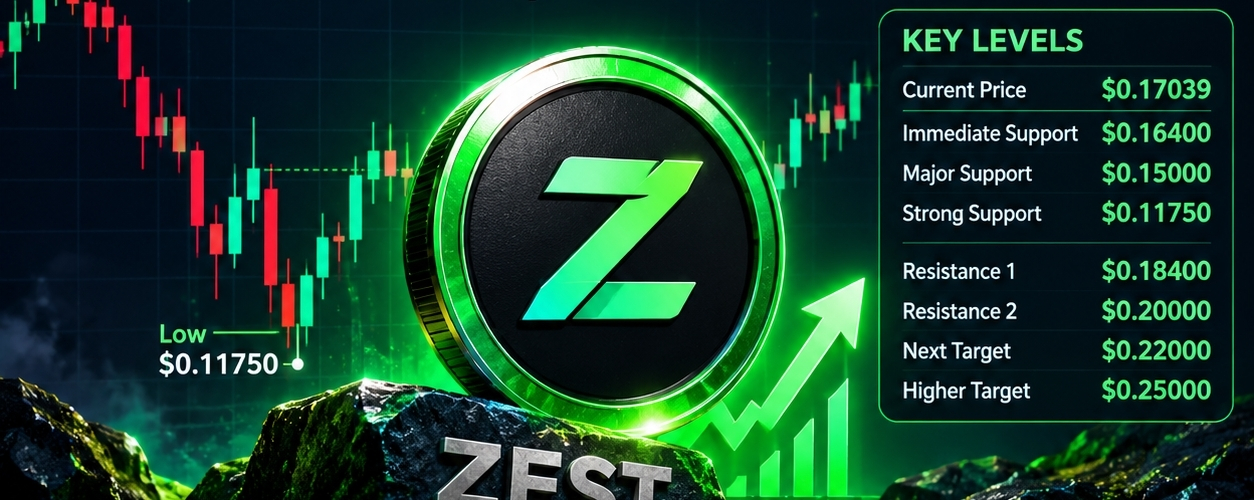
📊 Important Technical Levels
Current Price: $0.17039
Immediate Support: $0.16400
Major Support: $0.15000
Strong Support: $0.11750
Resistance 1: $0.18400
Resistance 2: $0.20000
Next Target: $0.22000
Higher Target: $0.25000
#zest #ZestProtocol
{future}(ZESTUSDT)
🚀 $ZEST Protocol ($ZEST ): A Strong Recovery Could Be Ahead – Is This a Long-Term Opportunity?
📊 Important Technical Levels
Current Price: $0.17039
Immediate Support: $0.16400
Major Support: $0.15000
Strong Support: $0.11750
Resistance 1: $0.18400
Resistance 2: $0.20000
Next Target: $0.22000
Higher Target: $0.25000
#zest #ZestProtocol
📊 Important Technical Levels
Current Price: $0.17039
Immediate Support: $0.16400
Major Support: $0.15000
Strong Support: $0.11750
Resistance 1: $0.18400
Resistance 2: $0.20000
Next Target: $0.22000
Higher Target: $0.25000
#zest #ZestProtocol
1
41
Статья
🚀 ZEST Protocol ($ZEST): A Strong Recovery Could Be Ahead – Is This a Long-Term Opportunity?$ZEST is currently trading around $0.17039, showing some short-term weakness after its recent recovery. However, looking at the weekly chart, ZEST Protocol is showing an interesting price structure that traders and investors should keep watching.
The token previously reached a high near $0.34999 before experiencing a significant correction. It later found a strong support area around $0.11750 and started recovering. This recovery indicates that buyers have shown interest at lower price levels.
📊 Important Technical Levels
Current Price: $0.17039
Immediate Support: $0.16400
Major Support: $0.15000
Strong Support: $0.11750
Resistance 1: $0.18400
Resistance 2: $0.20000
Next Target: $0.22000
Higher Target: $0.25000
🔥 Bullish Outlook
If ZEST maintains its support above $0.16400 and buying volume increases, we could see another attempt to break the $0.18400 resistance. A strong weekly close above $0.20000 could improve market sentiment and potentially open the door toward $0.22000 and $0.25000.
However, if the price loses its important support levels, further downside cannot be ruled out.
💎 My Perspective
I believe ZEST Protocol deserves attention because its recovery from $0.11750 has created an interesting opportunity to watch. Instead of chasing sudden price movements, traders should monitor volume, support zones, and weekly candle confirmations.
The next major move will depend on buyer strength and overall market conditions.
Stay patient, manage risk, and always do your own research (DYOR).
🚀 Can $ZEST reclaim $0.20 and move toward $0.25?
#zest #ZestProtocol #crypto #altcoins #bullish
🚀 ZEST Protocol ($ZEST): A Strong Recovery Could Be Ahead – Is This a Long-Term Opportunity?
$ZEST is currently trading around $0.17039, showing some short-term weakness after its recent recovery. However, looking at the weekly chart, ZEST Protocol is showing an interesting price structure that traders and investors should keep watching.
The token previously reached a high near $0.34999 before experiencing a significant correction. It later found a strong support area around $0.11750 and started recovering. This recovery indicates that buyers have shown interest at lower price levels.
📊 Important Technical Levels
Current Price: $0.17039
Immediate Support: $0.16400
Major Support: $0.15000
Strong Support: $0.11750
Resistance 1: $0.18400
Resistance 2: $0.20000
Next Target: $0.22000
Higher Target: $0.25000
🔥 Bullish Outlook
If ZEST maintains its support above $0.16400 and buying volume increases, we could see another attempt to break the $0.18400 resistance. A strong weekly close above $0.20000 could improve market sentiment and potentially open the door toward $0.22000 and $0.25000.
However, if the price loses its important support levels, further downside cannot be ruled out.
💎 My Perspective
I believe ZEST Protocol deserves attention because its recovery from $0.11750 has created an interesting opportunity to watch. Instead of chasing sudden price movements, traders should monitor volume, support zones, and weekly candle confirmations.
The next major move will depend on buyer strength and overall market conditions.
Stay patient, manage risk, and always do your own research (DYOR).
🚀 Can $ZEST reclaim $0.20 and move toward $0.25?
#zest #ZestProtocol #crypto #altcoins #bullish
47
·
--
Падение
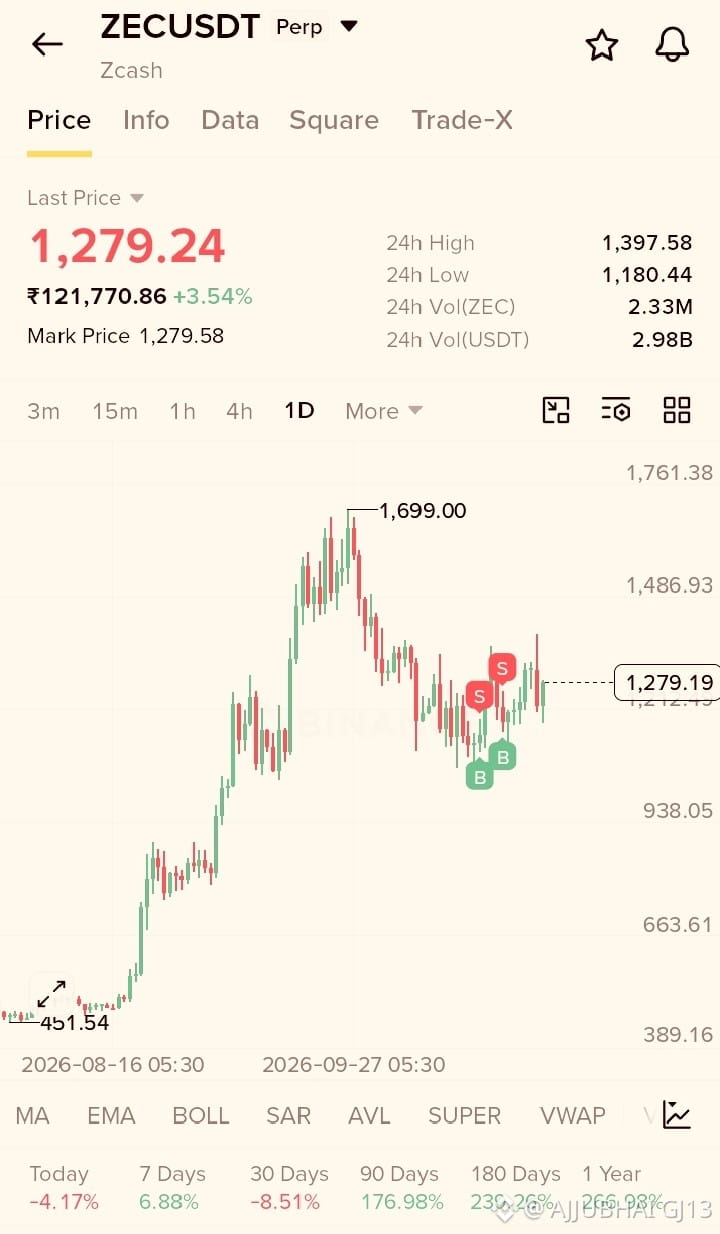
🔴 $ZEC USDT – SELLERS ARE TAKING CONTROL!
Zcash (ZEC) is showing signs of weakness after failing to maintain its strong bullish momentum near the $1,699 high.
Currently trading around $1,279, ZEC is facing selling pressure and struggling to break above the $1,300 resistance zone.
📉 Bearish Trading Setup
🔻 Entry Zone: $1,275 – $1,300
🎯 TP1: $1,240
🎯 TP2: $1,210
🎯 TP3: $1,180
🛑 Stop Loss: $1,330
Market Outlook: If ZEC fails to hold the $1,250 support level, further downside toward $1,210 and $1,180 could be possible. Sellers may remain active unless buyers reclaim the $1,300–$1,330 resistance zone.
#ZECUSDT #FedWatch
1
332
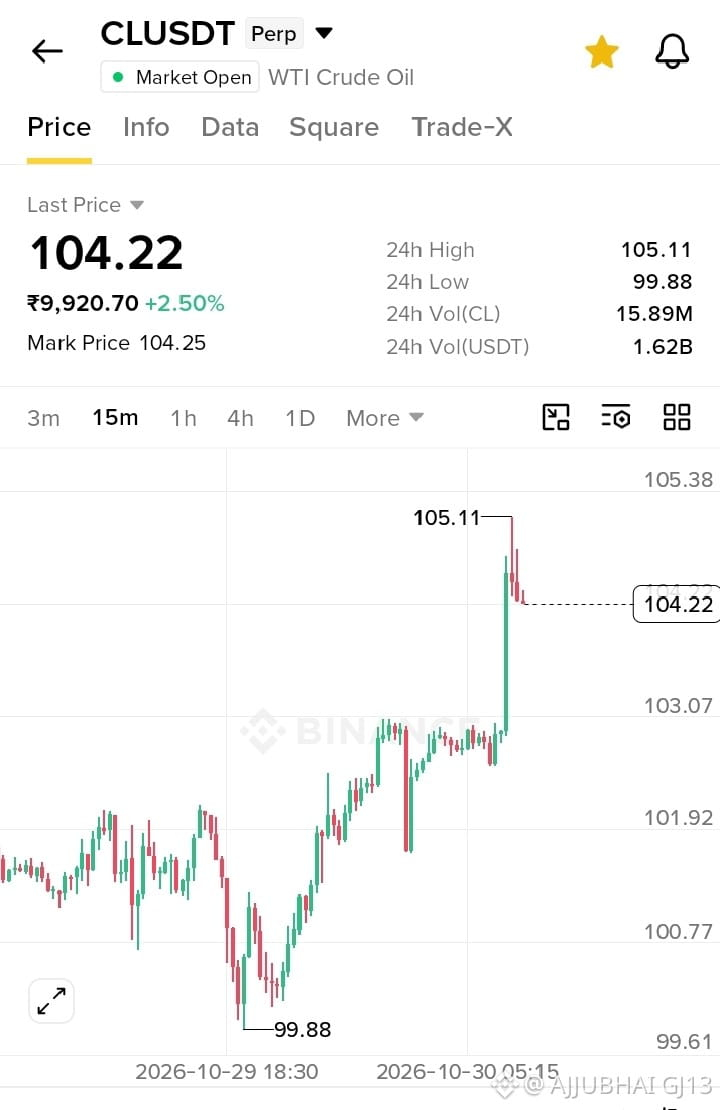
🔴 $CL (WTI CRUDE OIL) – SELL / SHORT IDEA
📉 SELL ENTRY: $104.00 – $104.30
🎯 TP1: $103.70
🎯 TP2: $103.10
🎯 TP3: $102.50
🛑 STOP LOSS: $105.25
WTI Crude Oil has experienced a strong bullish move, pushing the price toward the $105.11 resistance zone. However, price is now showing signs of rejection near the highs, which could lead to a short-term correction.
The $105.00–$105.11 zone is an important resistance area. If sellers take control and CLUSDT breaks below $104.00, further downside could follow.
#CLUSDT
1
326
·
--
Рост
MARKET UPDATE — DIP BUY ZONE
BTC is hovering around $80,754.01, down ~0.3% in the last hour, while ETH sits near $2,334.08, slipping about 0.7%. The market shows modest weakness but still retains liquidity on both sides.
Among altcoins, LSK, HYPE, NEWT, PEPE and HUMA posted notable gains, whereas HIGH, BMT, REZ, KORUB and AST are the most pronounced dip candidates. These moves reflect short‑term risk‑on/off swings rather than a clear directional bias.
In the next 12‑24 h watch for: broader risk sentiment (e.g., US CPI, Fed minutes), on‑chain activity such as BTC net inflows/outflows, order‑book depth on major exchanges, and any surprise news on regulatory fronts. Technical watchers may keep an eye on key support/resistance zones without naming exact levels.
$BTC $ETH
{future}(ETHUSDT)
{future}(BTCUSDT)
⚠️ NFA | DYOR
#Crypto #BTC #Binance #CryptoSignals
MARKET UPDATE — DIP BUY ZONE
BTC is hovering around $80,754.01, down ~0.3% in the last hour, while ETH sits near $2,334.08, slipping about 0.7%. The market shows modest weakness but still retains liquidity on both sides.
Among altcoins, LSK, HYPE, NEWT, PEPE and HUMA posted notable gains, whereas HIGH, BMT, REZ, KORUB and AST are the most pronounced dip candidates. These moves reflect short‑term risk‑on/off swings rather than a clear directional bias.
In the next 12‑24 h watch for: broader risk sentiment (e.g., US CPI, Fed minutes), on‑chain activity such as BTC net inflows/outflows, order‑book depth on major exchanges, and any surprise news on regulatory fronts. Technical watchers may keep an eye on key support/resistance zones without naming exact levels.
$BTC $ETH
⚠️ NFA | DYOR
#Crypto #BTC #Binance #CryptoSignals
1
41
#FedWatch #FedWatch: A Key Indicator for Crypto Market Direction 📊
The CME FedWatch Tool is an important resource for understanding market expectations about the US Federal Reserve's interest rate decisions.
Interest rates play a major role in global financial markets, including Bitcoin ($BTC), Ethereum ($ETH), and other cryptocurrencies. When traders expect interest rate cuts, risk assets may benefit from improved liquidity and investor sentiment. However, higher interest rates or a hawkish Fed outlook can create pressure on crypto markets.
FedWatch estimates the probability of different interest rate outcomes based on market data. Traders can use this information alongside Bitcoin price action, trading volume, support and resistance levels, and macroeconomic news.
Remember, FedWatch does not predict Bitcoin's price directly. Even when the market expects a rate cut, crypto prices can move in either direction depending on how the decision compares with expectations.
Smart traders follow the data, manage risk, and avoid emotional decisions.
#FedWatch #BTC #Ethereum #CryptoMarket
$BTC $ETH $SOL
{future}(SOLUSDT)
{future}(ETHUSDT)
{future}(BTCUSDT)
#FedWatch #FedWatch: A Key Indicator for Crypto Market Direction 📊
The CME FedWatch Tool is an important resource for understanding market expectations about the US Federal Reserve's interest rate decisions.
Interest rates play a major role in global financial markets, including Bitcoin ($BTC ), Ethereum ($ETH ), and other cryptocurrencies. When traders expect interest rate cuts, risk assets may benefit from improved liquidity and investor sentiment. However, higher interest rates or a hawkish Fed outlook can create pressure on crypto markets.
FedWatch estimates the probability of different interest rate outcomes based on market data. Traders can use this information alongside Bitcoin price action, trading volume, support and resistance levels, and macroeconomic news.
Remember, FedWatch does not predict Bitcoin's price directly. Even when the market expects a rate cut, crypto prices can move in either direction depending on how the decision compares with expectations.
Smart traders follow the data, manage risk, and avoid emotional decisions.
#FedWatch #BTC #Ethereum #CryptoMarket
$BTC $ETH $SOL

129
·
--
Падение
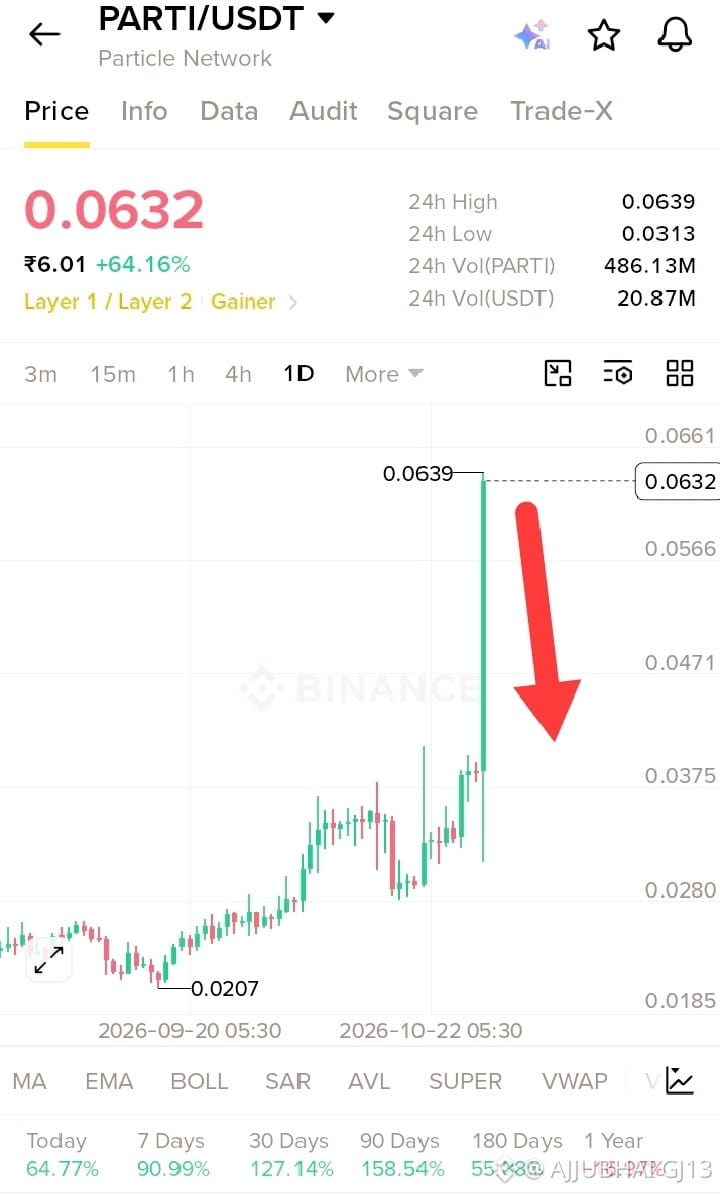
📉 $PARTI /USDT SELL ALERT — BE CAREFUL AFTER A MASSIVE PUMP!
🔴 Key Resistance: 0.0639–0.0660 USDT
📉 Potential Sell Targets:
TP1: 0.0566
TP2: 0.0471
TP3: 0.0375
🛑 Stop-Loss: Above 0.0665, depending on your entry and risk tolerance.
#Particle $PARTI
{future}(PARTIUSDT)
📉 $PARTI /USDT SELL ALERT — BE CAREFUL AFTER A MASSIVE PUMP!
🔴 Key Resistance: 0.0639–0.0660 USDT
📉 Potential Sell Targets:
TP1: 0.0566
TP2: 0.0471
TP3: 0.0375
🛑 Stop-Loss: Above 0.0665, depending on your entry and risk tolerance.
#Particle $PARTI
🔴 Key Resistance: 0.0639–0.0660 USDT
📉 Potential Sell Targets:
TP1: 0.0566
TP2: 0.0471
TP3: 0.0375
🛑 Stop-Loss: Above 0.0665, depending on your entry and risk tolerance.
#Particle $PARTI
1
472
·
--
Рост
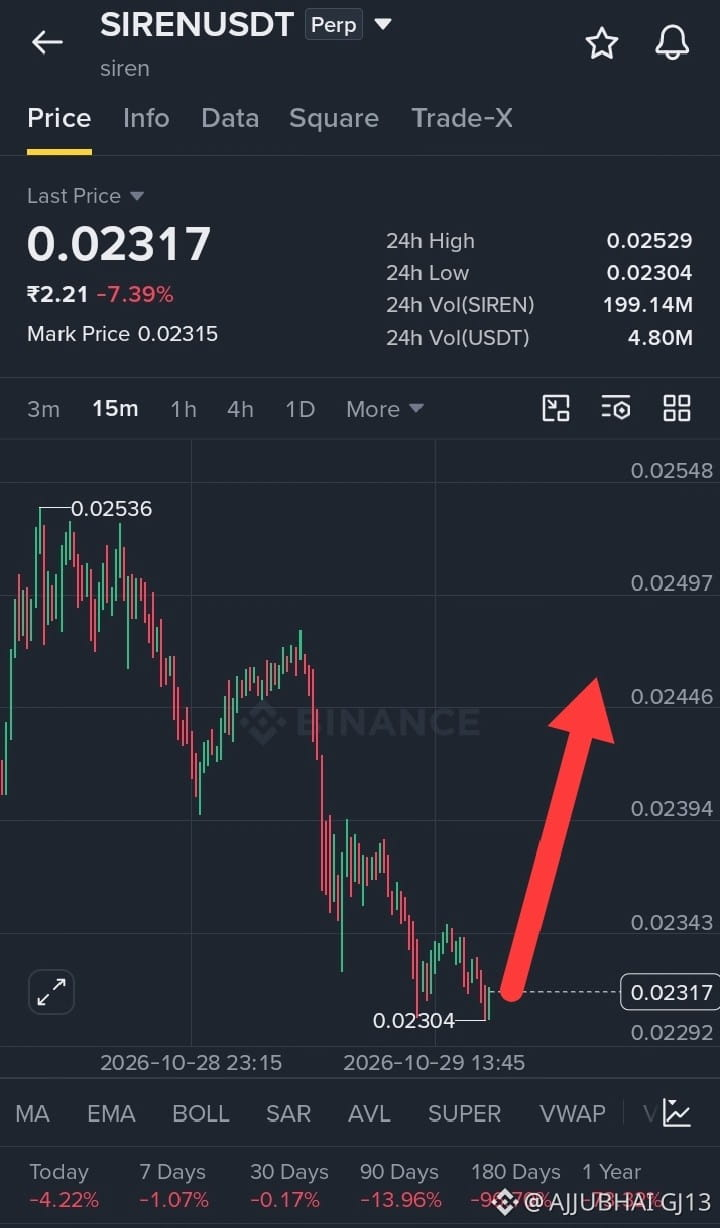
🚀 $SIREN /USDT — Potential LONG Opportunity! 🟢
🟢 Entry Zone: 0.02300–0.02320
🎯 TP1: 0.02343
🎯 TP2: 0.02394
🎯 TP3: 0.02446
🛑 Stop Loss: 0.02285
#siren
{future}(SIRENUSDT)
🚀 $SIREN /USDT — Potential LONG Opportunity! 🟢
🟢 Entry Zone: 0.02300–0.02320
🎯 TP1: 0.02343
🎯 TP2: 0.02394
🎯 TP3: 0.02446
🛑 Stop Loss: 0.02285
#siren
🟢 Entry Zone: 0.02300–0.02320
🎯 TP1: 0.02343
🎯 TP2: 0.02394
🎯 TP3: 0.02446
🛑 Stop Loss: 0.02285
#siren
1
452
How did you like my joke?
🙄🙄
How did you like my joke?
🙄🙄
🙄🙄
AJJUBHAI GJ13
·
--
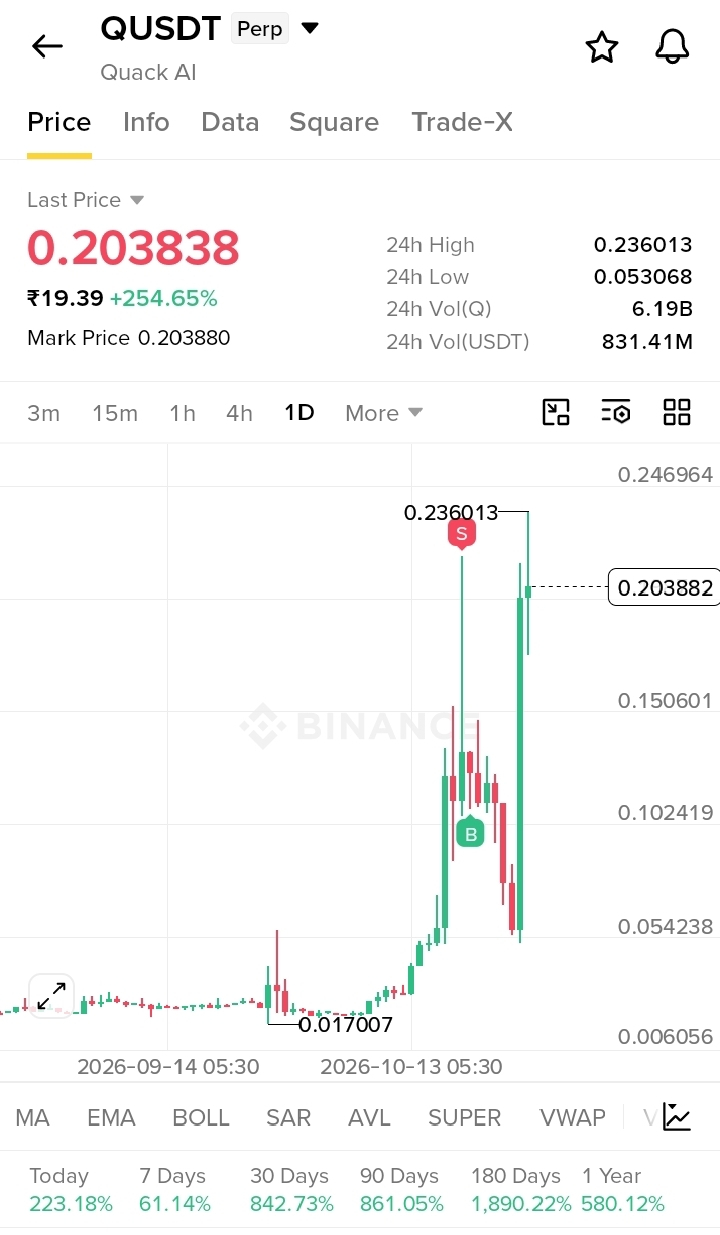
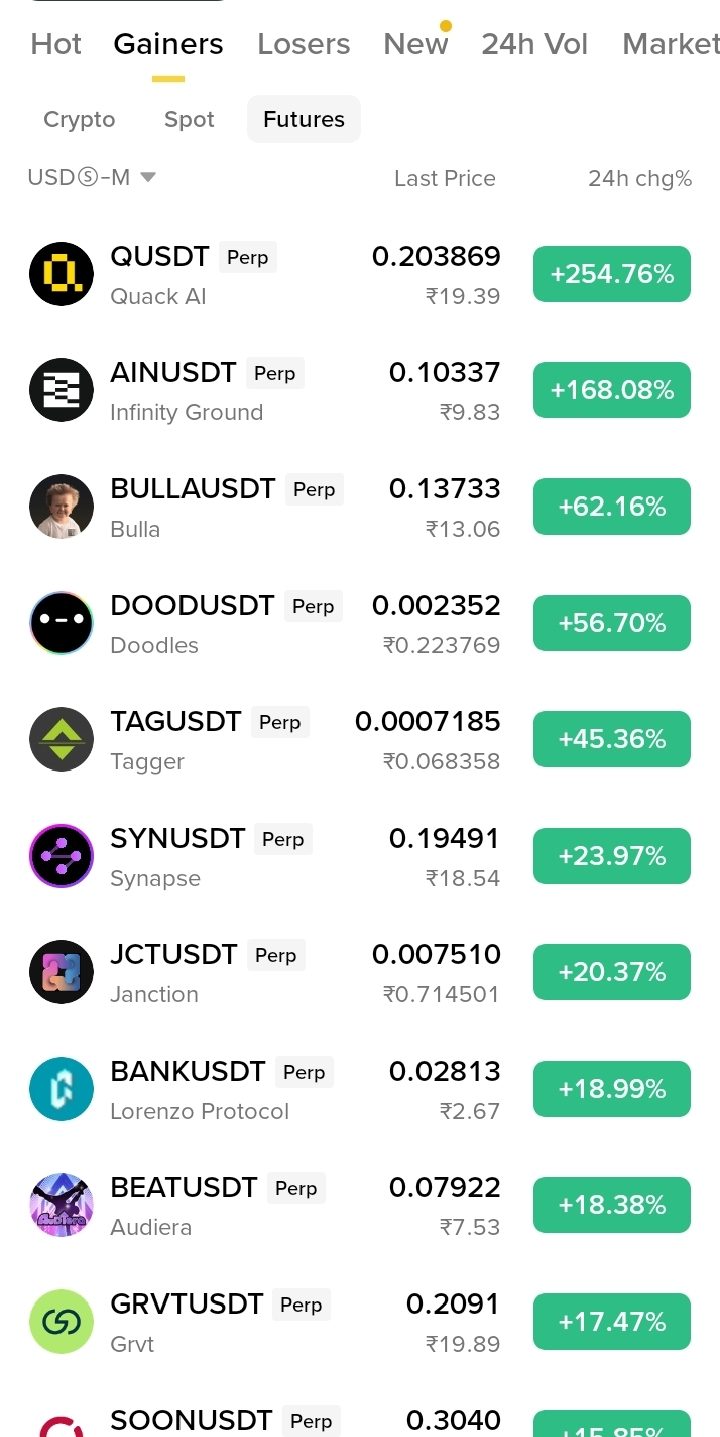
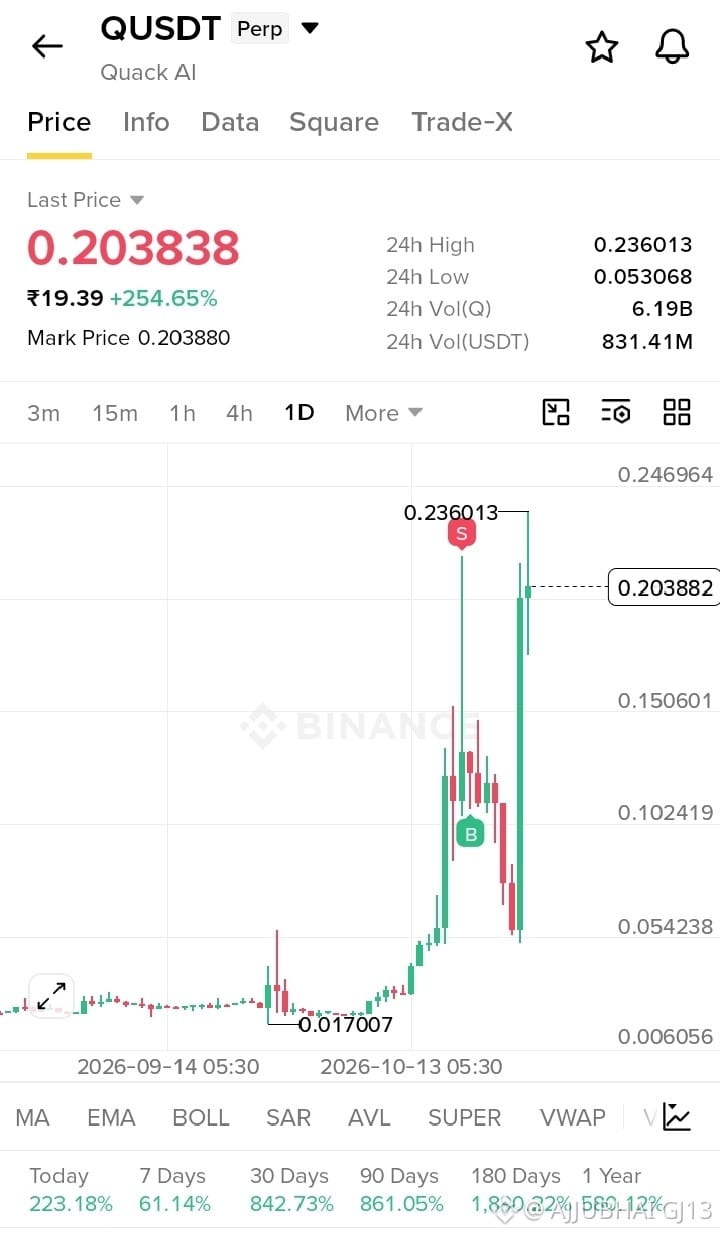
Падение🔴 QUSDT PERP — SELL
Entry Zone: 0.2100–0.2200
TP1: 0.1900
TP2: 0.1700
TP3: 0.1500
Stop Loss: 0.2370
#QUSDT
$Q
Entry Zone: 0.2100–0.2200
TP1: 0.1900
TP2: 0.1700
TP3: 0.1500
Stop Loss: 0.2370
#QUSDT
$Q
1
7
·
--
Падение
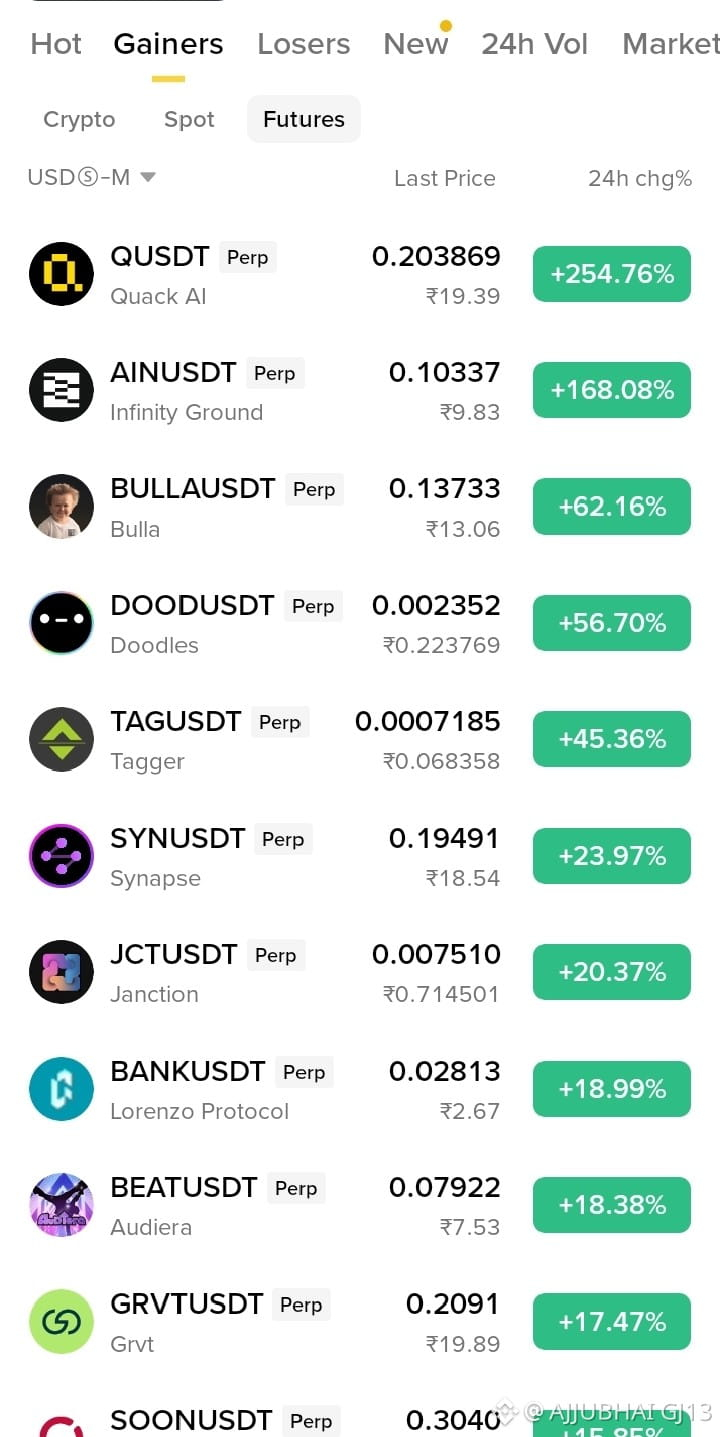
Торговля за 30 дней $Q 16.2 USDT
🔴 QUSDT PERP — SELL
Entry Zone: 0.2100–0.2200
TP1: 0.1900
TP2: 0.1700
TP3: 0.1500
Stop Loss: 0.2370
#QUSDT
$Q
🔴 QUSDT PERP — SELL
Entry Zone: 0.2100–0.2200
TP1: 0.1900
TP2: 0.1700
TP3: 0.1500
Stop Loss: 0.2370
#QUSDT
$Q
Entry Zone: 0.2100–0.2200
TP1: 0.1900
TP2: 0.1700
TP3: 0.1500
Stop Loss: 0.2370
#QUSDT
$Q
1
1
336
Статья
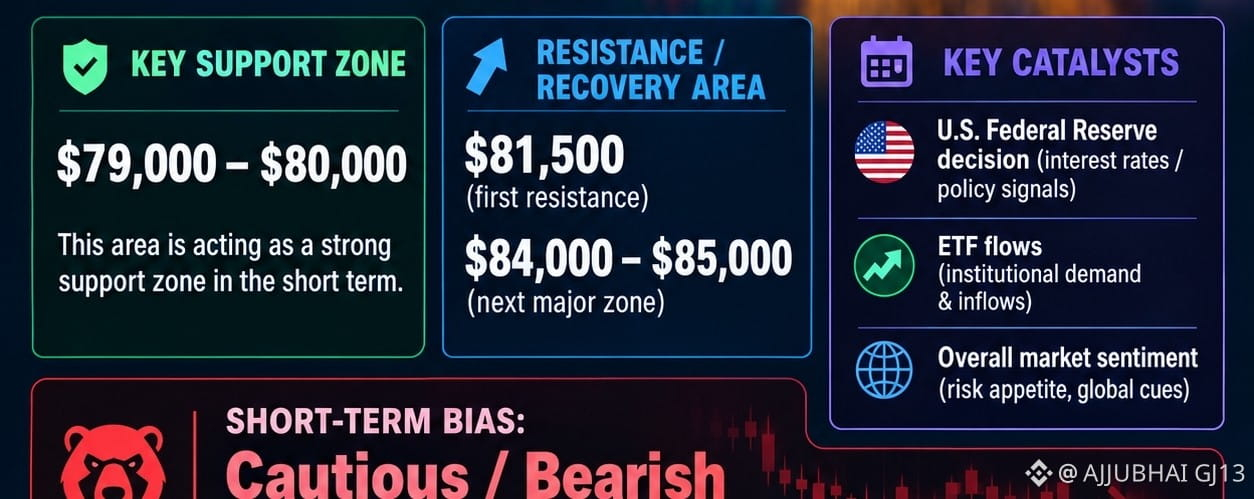
📊 Bitcoin (BTC) Latest Analysis — 27 October 2026Bitcoin is trading near $80,000, with recent selling pressure keeping the short-term outlook cautious. BTC recently dipped toward $79,000 before finding buyers. The market is watching U.S. Federal Reserve signals and ETF flows. $BTC
Key levels to watch
Support: $79,000–$80,000Resistance: $81,500Major resistance: $84,000–$85,000Bullish signal: A sustained breakout above $81,500 could improve momentum.Bearish signal: A clear breakdown below $79,000 could lead to further downside.
Market bias: Cautious / short-term bearish until BTC shows a stronger recovery.
$BTC
{future}(BTCUSDT)
📊 Bitcoin (BTC) Latest Analysis — 27 October 2026
Bitcoin is trading near $80,000, with recent selling pressure keeping the short-term outlook cautious. BTC recently dipped toward $79,000 before finding buyers. The market is watching U.S. Federal Reserve signals and ETF flows. $BTC
Key levels to watch
Support: $79,000–$80,000Resistance: $81,500Major resistance: $84,000–$85,000Bullish signal: A sustained breakout above $81,500 could improve momentum.Bearish signal: A clear breakdown below $79,000 could lead to further downside.
Market bias: Cautious / short-term bearish until BTC shows a stronger recovery.
$BTC
1
66


#nil $NIL @nillionnetwork
🚀 $NIL – The Future of Privacy Technology
The future of Web3 is not just about decentralization; it is also about privacy and secure data sharing. @nillionnetwork is building innovative technology designed to protect sensitive information while enabling powerful decentralized applications.
With its focus on privacy-preserving computation, Nillion aims to unlock new possibilities for AI, Web3, and data security. The $NIL token is an important part of its ecosystem.
As blockchain technology evolves, projects focused on privacy and secure computation could attract more attention. However, crypto markets are volatile, so always do your own research before investing.
#nil $NIL @Nillion
🚀 $NIL – The Future of Privacy Technology
The future of Web3 is not just about decentralization; it is also about privacy and secure data sharing. @Nillion is building innovative technology designed to protect sensitive information while enabling powerful decentralized applications.
With its focus on privacy-preserving computation, Nillion aims to unlock new possibilities for AI, Web3, and data security. The $NIL token is an important part of its ecosystem.
As blockchain technology evolves, projects focused on privacy and secure computation could attract more attention. However, crypto markets are volatile, so always do your own research before investing.
2
73
🎙️ 🎁 Send Gifts ❤️ Show Love 💎 Support Each Other 🚀 Binance Family 🔥

Завершено
02 ч 34 мин 10 сек
160
3
0
·
--
Рост
🛢️ WTI CRUDE OIL (CLUSDT) — Bulls Are in Control! 🚀
WTI Crude Oil Price Analysis | Bullish Momentum or a Possible Pullback?
WTI Crude Oil (CLUSDT) is showing strong bullish momentum on the Binance chart. 📈
According to the shared screenshot, the current price is $93.67, up 2.11% over the displayed 24-hour period. The price recently climbed from a low of $91.06 to a high of $94.43, demonstrating strong buying pressure.
🔥 Key Market Levels
Current Price: $93.67
Resistance 1: $93.86
Resistance 2: $94.43
Support 1: $93.12
Support 2: $92.37
📊 Bullish Scenario: If CLUSDT breaks above $93.86 and holds that level, the price could move toward $94.00–$94.43. A confirmed breakout above $94.43 could open the door to further upside.
⚠️ Bearish Scenario: If the price fails to hold above $93.12, selling pressure could push it toward $92.37. A deeper correction is possible if buyers lose control.
💡 Trading Strategy: Watch for a breakout above resistance or a bounce from support before entering a trade. Avoid chasing the price after a strong rally. Always use a stop-loss and manage leverage carefully.
Conclusion: WTI Crude Oil is showing bullish momentum, but the $93.86–$94.43 resistance zone is critical. The next move depends on whether buyers can break through this zone or sellers push the price lower.
#CLUSDT $CL
1
137
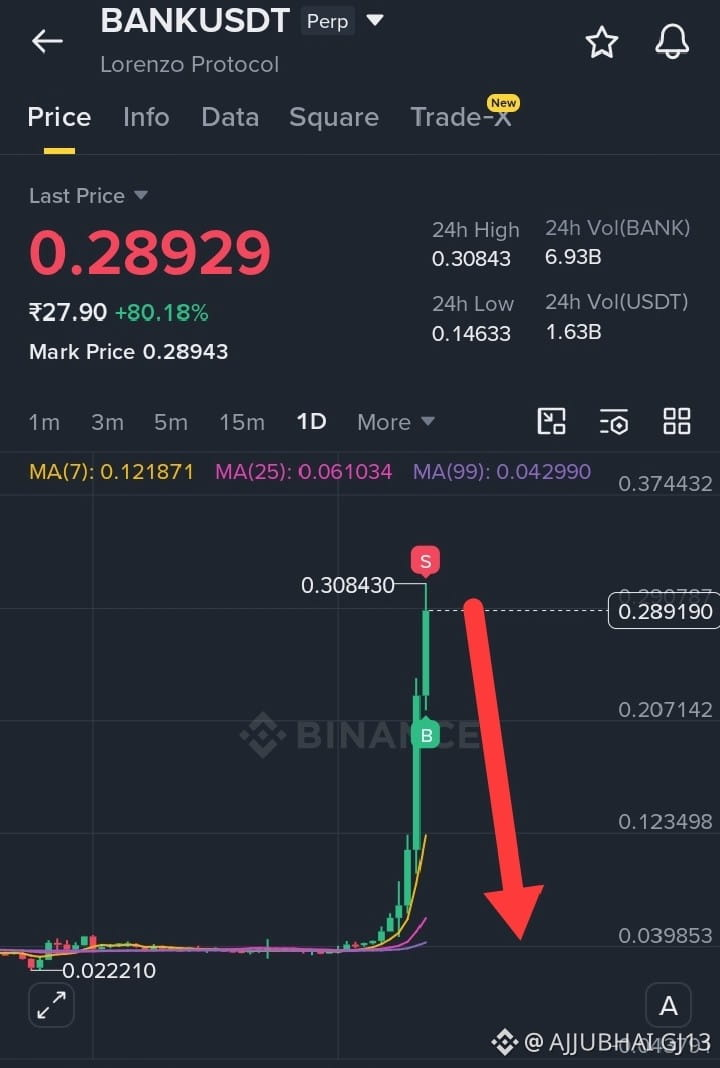
$BANK has experienced a massive parabolic rally, surging more than 80% in a single day. Such explosive moves are often followed by profit-taking and increased volatility.
📉 Trade Plan Sell Idea:
Entry: $0.288 – $0.300
Stop Loss: $0.315
Target 1: $0.260
Target 2: $0.230
Target 3: $0.200
$BANK has experienced a massive parabolic rally, surging more than 80% in a single day. Such explosive moves are often followed by profit-taking and increased volatility.
📉 Trade Plan Sell Idea:
Entry: $0.288 – $0.300
Stop Loss: $0.315
Target 1: $0.260
Target 2: $0.230
Target 3: $0.200
📉 Trade Plan Sell Idea:
Entry: $0.288 – $0.300
Stop Loss: $0.315
Target 1: $0.260
Target 2: $0.230
Target 3: $0.200
1
354
·
--
Падение
Short $BANK now
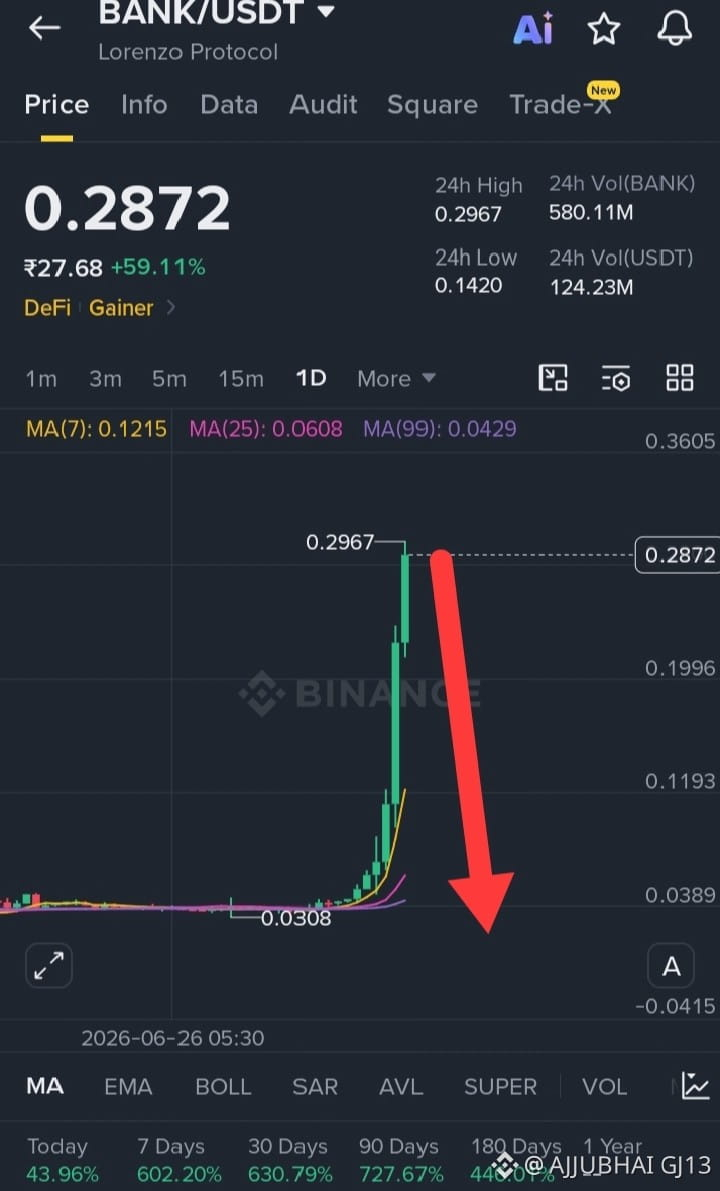
#BANK has delivered an explosive rally, gaining nearly 600%+ in just 7 days. After such a vertical move, the price is approaching a strong resistance zone where profit-taking can trigger a sharp correction.
📉 Sell Entry Zone: 0.2850 – 0.2950 USDT
🛑 Stop Loss: 0.3050 USDT
🎯 Targets:
TP1: 0.2500
TP2: 0.2200
TP3: 0.1800
TP4: 0.1400
Why bearish?
Massive overextended rally with little consolidation.
Price is testing a key resistance area near recent highs.
Early buyers may begin booking profits.
A pullback after such a steep rise is common before any continuation.
$BANK
{future}(BANKUSDT)
Short $BANK now
#BANK has delivered an explosive rally, gaining nearly 600%+ in just 7 days. After such a vertical move, the price is approaching a strong resistance zone where profit-taking can trigger a sharp correction.
📉 Sell Entry Zone: 0.2850 – 0.2950 USDT
🛑 Stop Loss: 0.3050 USDT
🎯 Targets:
TP1: 0.2500
TP2: 0.2200
TP3: 0.1800
TP4: 0.1400
Why bearish?
Massive overextended rally with little consolidation.
Price is testing a key resistance area near recent highs.
Early buyers may begin booking profits.
A pullback after such a steep rise is common before any continuation.
$BANK
1
226
🚨 $BANK USDT Sell Setup 🚨
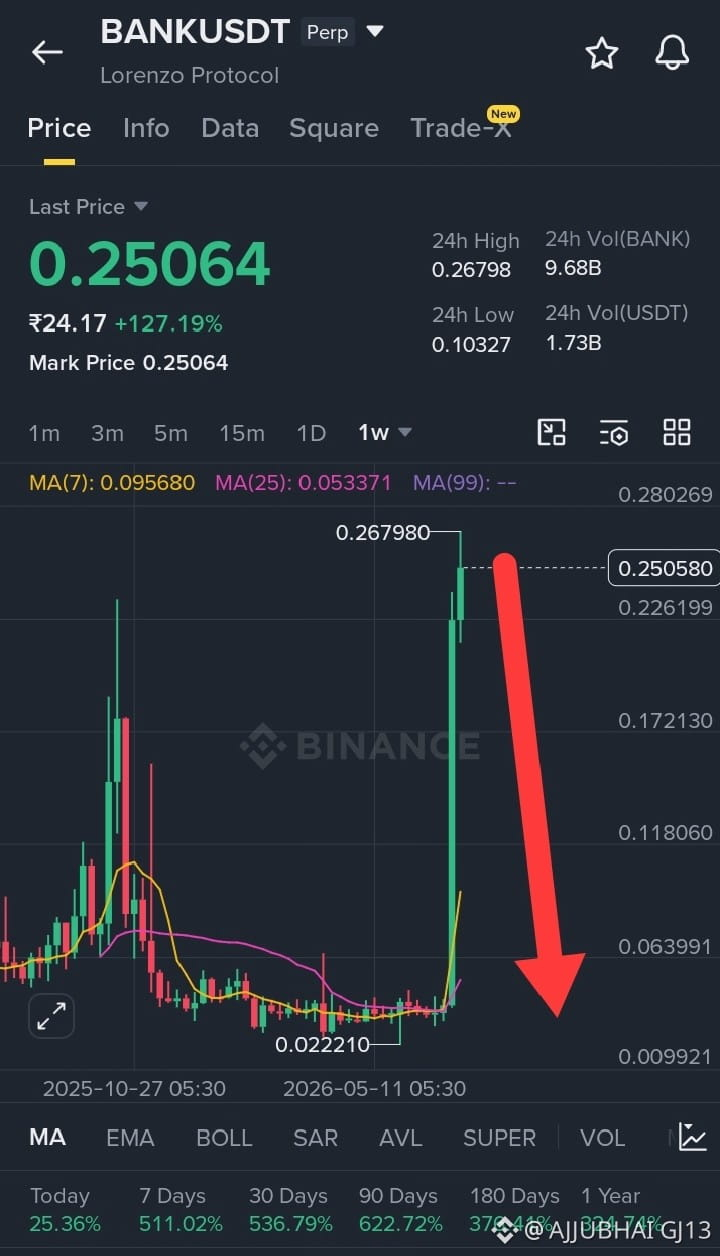
BANK has delivered a massive parabolic rally, gaining over 127% in a very short time. After such an explosive move, the price is approaching a zone where profit-taking and a sharp correction become more likely.
📉 Bearish View:
Strong rejection near 0.2680
Price looks overextended after a vertical pump
A breakdown below 0.2450 could trigger further downside
🎯 Sell Entry: 0.2480 – 0.2550
🛑 Stop Loss: 0.2720
🎯 Target 1: 0.2200
🎯 Target 2: 0.1850
🎯 Target 3: 0.1450
⚠️ This setup is based on technical analysis. If buyers reclaim and hold above 0.2720, the bearish idea becomes invalid. Use proper risk management and never risk more than you can afford to lose.
#BANKUSDT #BANK #Crypto #Binance #Futures
4
1
654
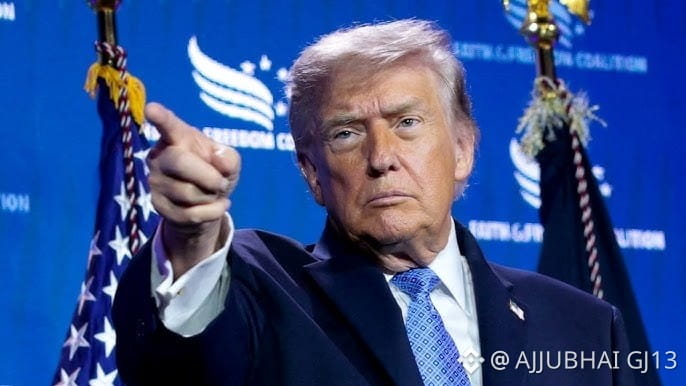
$TRUMP invested his crypto profits into stocks and bonds - report
President Trump’s financial disclosures reveal that while he and his two eldest sons promoted crypto ventures that left many retail investors with steep losses, his own money managers moved much of the proceeds into more conventional assets, according to Reuters.
After analyzing disclosures filed with the U.S. Office of Government Ethics, Reuters reported that Trump earned more than $1.4 billion last year from family crypto ventures, including World Liberty Financial and his namesake meme coin.
A Reuters review of his holdings found that his stock and bond portfolio grew at least fourfold over two years as crypto earnings poured in. By the end of 2025, Trump held between $703 million and $2.6 billion in traditional securities, up from $225 million to $608 million a year earlier. Because the disclosures list holdings in ranges rather than exact amounts, Reuters could not pinpoint precisely how the crypto proceeds were allocated.
Trump’s filing shows he still holds a large stake in World Liberty Financial’s tokens, and his overall exposure to digital assets has grown, the report said.
#TRUMP
301
Войдите, чтобы посмотреть больше материала
Присоединяйтесь к пользователям криптовалют по всему миру на Binance Square
⚡️ Получайте новейшую и полезную информацию о криптоактивах.
💬 Нам доверяет крупнейшая в мире криптобиржа.
👍 Получите достоверные аналитические данные от верифицированных создателей контента.
Эл. почта/номер телефона
В тренде
EarningsSeason
Просмотров: 6.6M
32,976 обсуждают
Earnings Season Session 3: Will Google & Microsoft Beat Earnings Expectations?
Binance Square Official
·Лайков: 184
·Просмотров: 109.6k
USMidtermElections
Просмотров: 80,468
1,059 обсуждают
StrategySTRCReaches$99.95ForFirstTimeIn165Days
Просмотров: 391
29 обсуждают