

Haris Chhipa
113 Публикации

Haris Chhipa
Отправить жалобу
Заблокировать пользователя
Открытая сделка
Случайный трейдер
5.7 г
19 подписок(и/а)
23 подписчиков(а)
76 понравилось
Посты
Портфель
·
--
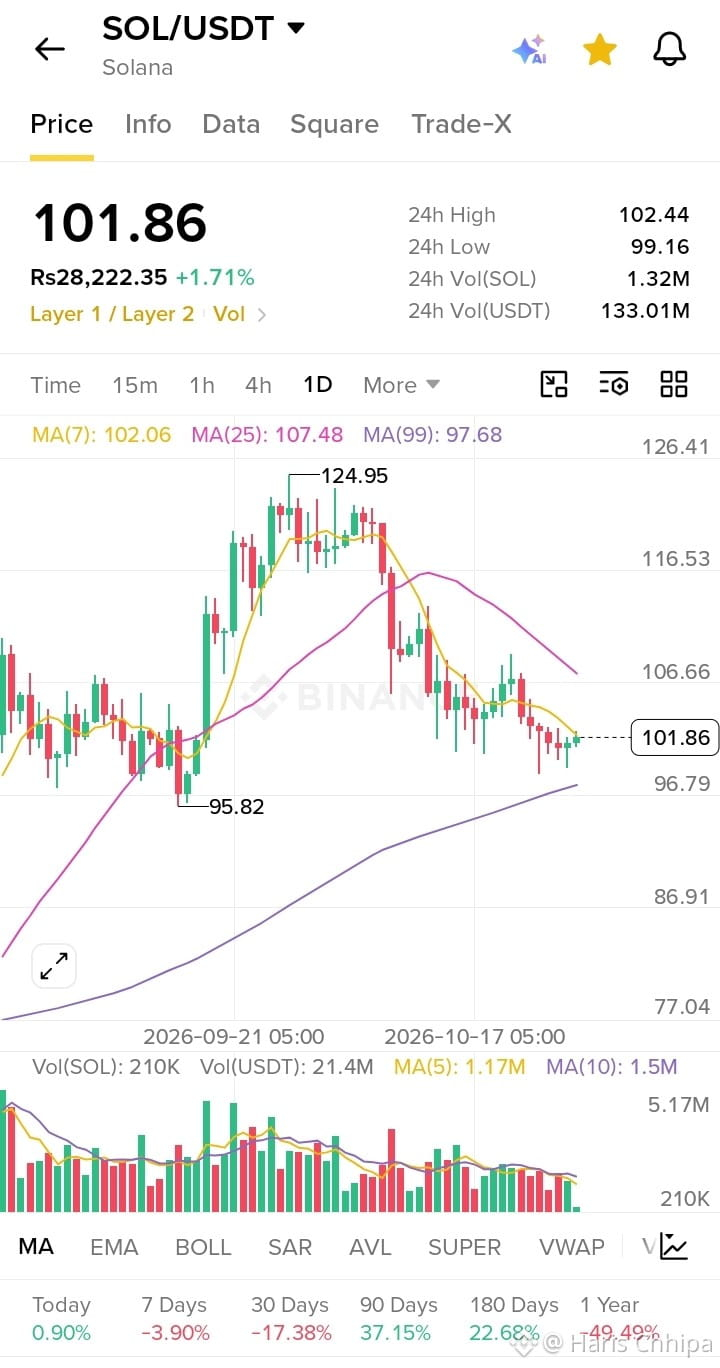
Spot SOL Insights 2026-10-28 03:00 UTC
TLDR
1. SOL gained 1.49% over 24 hours to $101.66, buoyed by ecosystem migration news despite lingering ETF outflow risks.
Key Drivers
1. - **Ecosystem expansion (High)**: Akash Network's proposed migration to Solana alongside reaching 20% market share in tokenized equities boosted on-chain sentiment → sustained network adoption.
- **Technical breakout (Medium)**: Price crossed above EMA-7, EMA-25, and EMA-99 → bullish MACD crossover triggered continuous upside momentum toward $101.66.
- **Retail utility growth (Low)**: New short-term prediction contract integrations widened speculative and utility use cases.
Risk Assessment
1. - **Overbought momentum (High)**: Hourly RSI-6 reached 73.0, entering overbought territory near upper Bollinger Bands ($101.95) → elevated short-term pullback risk.
- **Exchange sell pressure (Medium)**: Over 832,000 SOL deposited to CEX and custody addresses, alongside $8.23M spot ETF outflows, increases overhead resistance.
75
·
--
🚨 **GOLD JUST MADE A MASSIVE MOVE! 🔥 XAUUSDT — WHAT COMES NEXT?**
Gold traders are witnessing extreme volatility! 📉📈
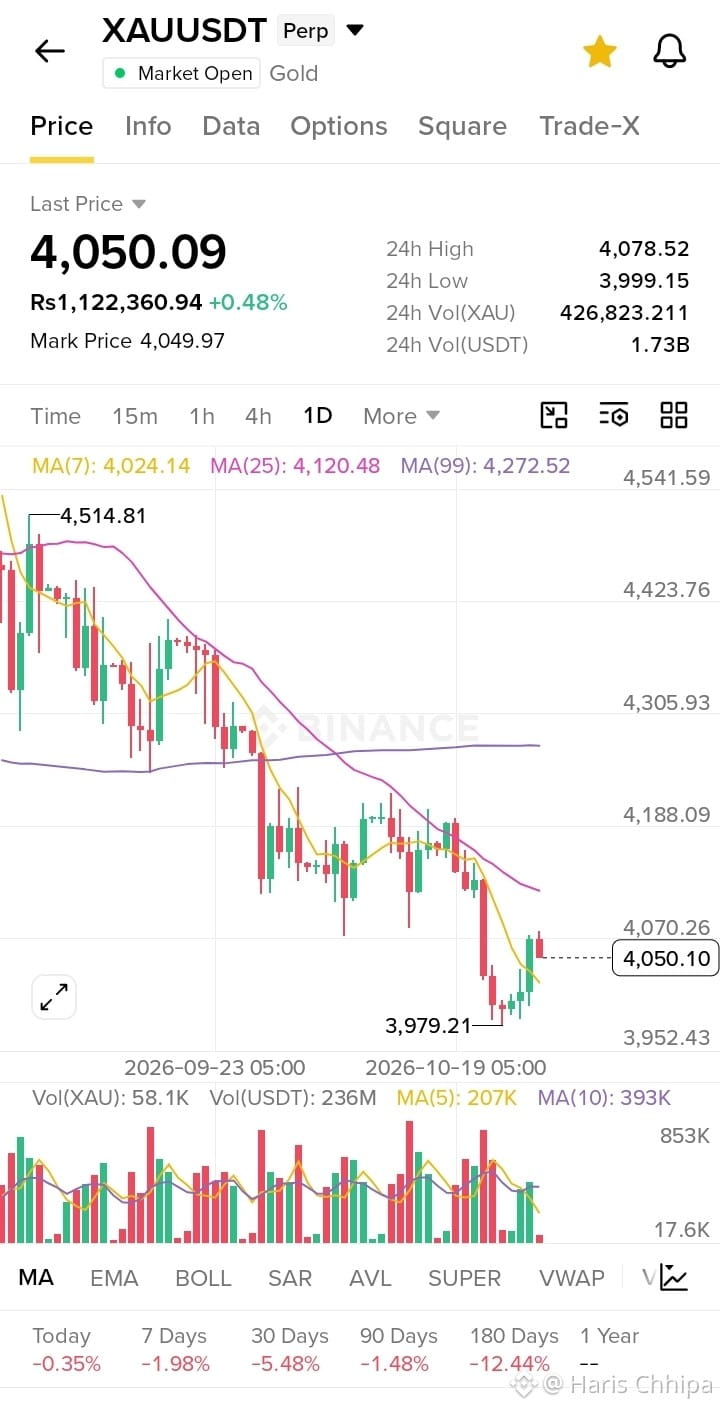
According to the Binance chart, XAUUSDT is trading near **$4,050**, after dropping to **$3,979.21** and making a sharp recovery.
⚠️ **KEY TECHNICAL OBSERVATIONS**
🔴 **Trend:** Bearish on the daily timeframe
🟢 **Recent low:** $3,979.21
📍 **Current price:** Around $4,050
📉 **MA(7):** $4,024 — short-term recovery level
🚧 **MA(25):** $4,120 — major resistance zone
🔻 **MA(99):** $4,272 — long-term trend resistance
🎯 **GOLD PRICE PREDICTION — NEXT 24–48 HOURS**
🟢 **Bullish Scenario:** If Gold breaks above $4,070–$4,100 and holds, the next potential targets are **$4,120–$4,150**.
🔴 **Bearish Scenario:** If price faces rejection near $4,070 and breaks below $4,000, Gold could retest **$3,979**, followed by the $3,950 area.
⚡ **My Market View:** A relief bounce is possible, but the daily trend remains under pressure until buyers reclaim important resistance levels.
🔥 The big question: Is this the beginning of a strong recovery, or just a temporary bounce before another drop?
💬 **What do you think? $4,150 next or $3,950 first? Comment below!**
📌 Follow for more Gold market analysis and price predictions.
#XAUUSDT #Gold #GoldTrading #BinanceSquare #GoldPrice #TradingSignals #TechnicalAnalysis #CryptoTrading #ForexTrading #MarketAnalysis #PricePrediction #TradingView
### My prediction from your chart
Current reference price
### $4,050.09
Bullish confirmation
### $4,100 → $4,120–$4,150
Possible if price breaks resistance and sustains upward momentum.
Bearish continuation
### $4,000 → $3,979 → $3,950
Possible if support breaks and selling pressure returns.
200
·
--
Binance Meme Coin Update | October 27, 2026
The meme coin market remains mixed, with broader crypto sentiment and liquidity continuing to drive short-term moves. Over the next week, Bitcoin’s stability, overall risk appetite, and Solana ecosystem activity are likely to be key factors.
🐶 DOGE
DOGE often benefits from its deep liquidity and broad retail attention. If overall market conditions stabilize, activity may remain relatively resilient; if risk appetite weakens, volatility can still increase quickly.
🐕 SHIB
SHIB remains highly community- and sentiment-driven. A recovery in meme-coin trading volumes could support renewed interest, while softer market conditions may keep price action range-bound or volatile.
🐸 PEPE
PEPE tends to react strongly to changes in trading volume and social momentum. Higher liquidity can support active trading, but it also means sharp moves in either direction are possible.
🟠 BONK
BONK is closely connected to sentiment around the Solana ecosystem. Stronger Solana activity and meme-coin flows could improve attention, while weaker ecosystem momentum may weigh on demand.
🛡️ FLOKI
FLOKI can be influenced by community updates and narrative-driven interest, including ecosystem and gaming-related developments. Its short-term direction will still largely depend on broader market sentiment.
🎩 WIF
WIF is also sensitive to Solana-led meme-coin momentum and can experience rapid price swings. Market liquidity and Solana ecosystem activity may play an important role over the coming week.
Next-week outlook:
If Bitcoin holds steady and meme-coin trading volumes rise, higher-liquidity names such as DOGE and PEPE may see stronger market participation, while BONK and WIF could be especially responsive to Solana ecosystem momentum. If the broader market stays risk-off, meme coins may remain highly volatile and could face sharper intraday swings.
Post caption:
“DOGE, SHIB, PEPE, BONK, FLOKI, and WIF remain in focus as meme-coin liquidity and market sentiment shape short-term momentum.
96
·
--
📌 Gold Update | 27 October 2026
Gold (XAU/USD) is trading near $4,000 per ounce, down roughly 0.4% today. The market is under pressure from a firmer US dollar and caution ahead of the Fed meeting, while safe-haven demand is still providing underlying support.
Prediction / outlook:
Gold’s next move depends heavily on the Fed’s message, US yields, and dollar strength. If yields cool and the dollar weakens after the meeting, gold may regain upward momentum. But if the Fed remains hawkish and yields stay elevated, short-term volatility and further downside pressure can continue.
Key takeaway:
Gold is currently in a high-volatility phase—not a one-way trend. The $4,000 area is psychologically important, and price action around it may shape near-term sentiment.
#btc70k #GOLD_UPDATE
80
·
--
BTC latest news — 2026-10-27
BTC briefly traded below $80,000 as broader risk appetite weakened ahead of the Federal Reserve decision. The latest daily market brief also highlighted pressure from an AI/technology-led market sell-off. Public market reports have pointed to recent ETF outflows and derivatives liquidations as additional short-term headwinds. (morningstar.com)
On Binance Spot, BTCUSDT is $79,693.86 as of 2026-10-27, versus a 24h open of $80,526.81 — approximately -1.0%. Its 24h high is $80,844.70 and low is $79,451.35.
Next-week scenario map
If macro risk sentiment improves: A less-risk-averse reaction to the Fed, steadier equity markets, and renewed ETF demand could support a recovery attempt above the current $80K area.
If risk-off conditions persist: Further weakness in tech equities, renewed ETF outflows, or leveraged-position unwinds could keep BTC volatile and expose the recent low near $79.5K to another test.
What to monitor: the Fed statement and market reaction, US spot Bitcoin ETF flow data, equity-market volatility, and whether BTC can reclaim and remain above its 24h opening price near $80.5K. These are conditions to watch, not price predictions.
The above is market analysis and does not constitute investment advice.
24
·
--
MemeCoins — latest snapshot
Broader market pressure: The latest market brief shows risk-off conditions across crypto, with BTC and ETH slightly lower over the prior 24 hours. Meme coins often amplify this broader volatility, so sharp moves can happen even without project-specific news.
DOGE: Attention remains on the DogeOS development narrative and its public testnet, which could expand developer interest. Adoption and actual user activity remain the key factors to watch.
SHIB: Recent discussion has focused on wider multichain access, including Solana availability, alongside the ongoing Shibarium ecosystem narrative. Cross-chain activity can add liquidity but also adds operational and bridge-related risks.
PEPE: No major scheduled protocol catalyst stands out; its moves remain closely tied to social attention, liquidity, and general risk appetite.
BONK / WIF: Solana-based meme coins continue to be highly sensitive to Solana ecosystem activity and retail sentiment. They can move quickly in either direction when volume changes.
New launches: Public reporting continues to flag very high failure rates among newly issued meme tokens—many see short-lived trading activity and thin liquidity. Contract risk, holder concentration, and exit liquidity deserve extra scrutiny.
What matters most: social-media momentum, on-chain volume, large-holder concentration, token unlocks, liquidity depth, and whether a headline reflects a real product update versus pure promotion.
Meme coins are highly speculative: historical momentum does not indicate future performance, and losses can be substantial.
#newscrypto #meme板块关注热点
391
·
--
Deep Dive
Quack AI (+276.52% 24h, +68.65% 7d, market Cap $946.95M)
Overview: Quack AI is an AI-focused crypto project. Its price surged 276.52% in 24 hours on a massive $253.56M volume, which is up 208.38%. This aligns with a noted 22.65% 7-day gain for the broader AI applications sector.
What it means: This is a high-conviction, high-capital move into the AI narrative, diverging from a stagnant broader market.
Watch for: Sustainability of volume; a drop could signal a sharp pullback.
Infinity Ground (+117.36% 24h, +127.12% 7d, market Cap $26.31M)
Overview: Infinity Ground (AIN) is a low-market-cap asset. It has rallied 271.4% over 30 days, with 24-hour volume exploding by 2925.5% to $30.12M.
What it means: This is a classic low-float pump with extreme volatility, attractive for momentum traders but risky for holders.
Watch for: Volume exhaustion, which often precedes a steep correction in micro-caps.
Audiera (+19.77% 24h, +5.98% 7d, market Cap $27.7M)
Overview: Audiera (BEAT) saw its 24-hour volume jump 285.64% to $9.01M. The move is heavily promoted across social media by accounts sharing identical leveraged long setups.
What it means: Momentum is driven by coordinated retail trading calls, not fundamental developments, indicating a higher risk of a swift reversal.
Watch for: A break below the cited stop-loss levels (e.g., $0.06172), which could trigger cascading liquidations.
Conclusion
Current bullish momentum is highly selective, concentrated in AI narratives and low-cap coins, while Bitcoin dominance holds near 60%. This signals a risk-on rotation within a still-cautious total market. The key question is: Can Quack AI's volume sustain to validate this as a sector-wide shift, or will capital retreat to Bitcoin?
328
·
--
🚀 SHIBA INU (SHIB) PRICE PREDICTION: IS A BIG BREAKOUT COMING? 🐕🔥
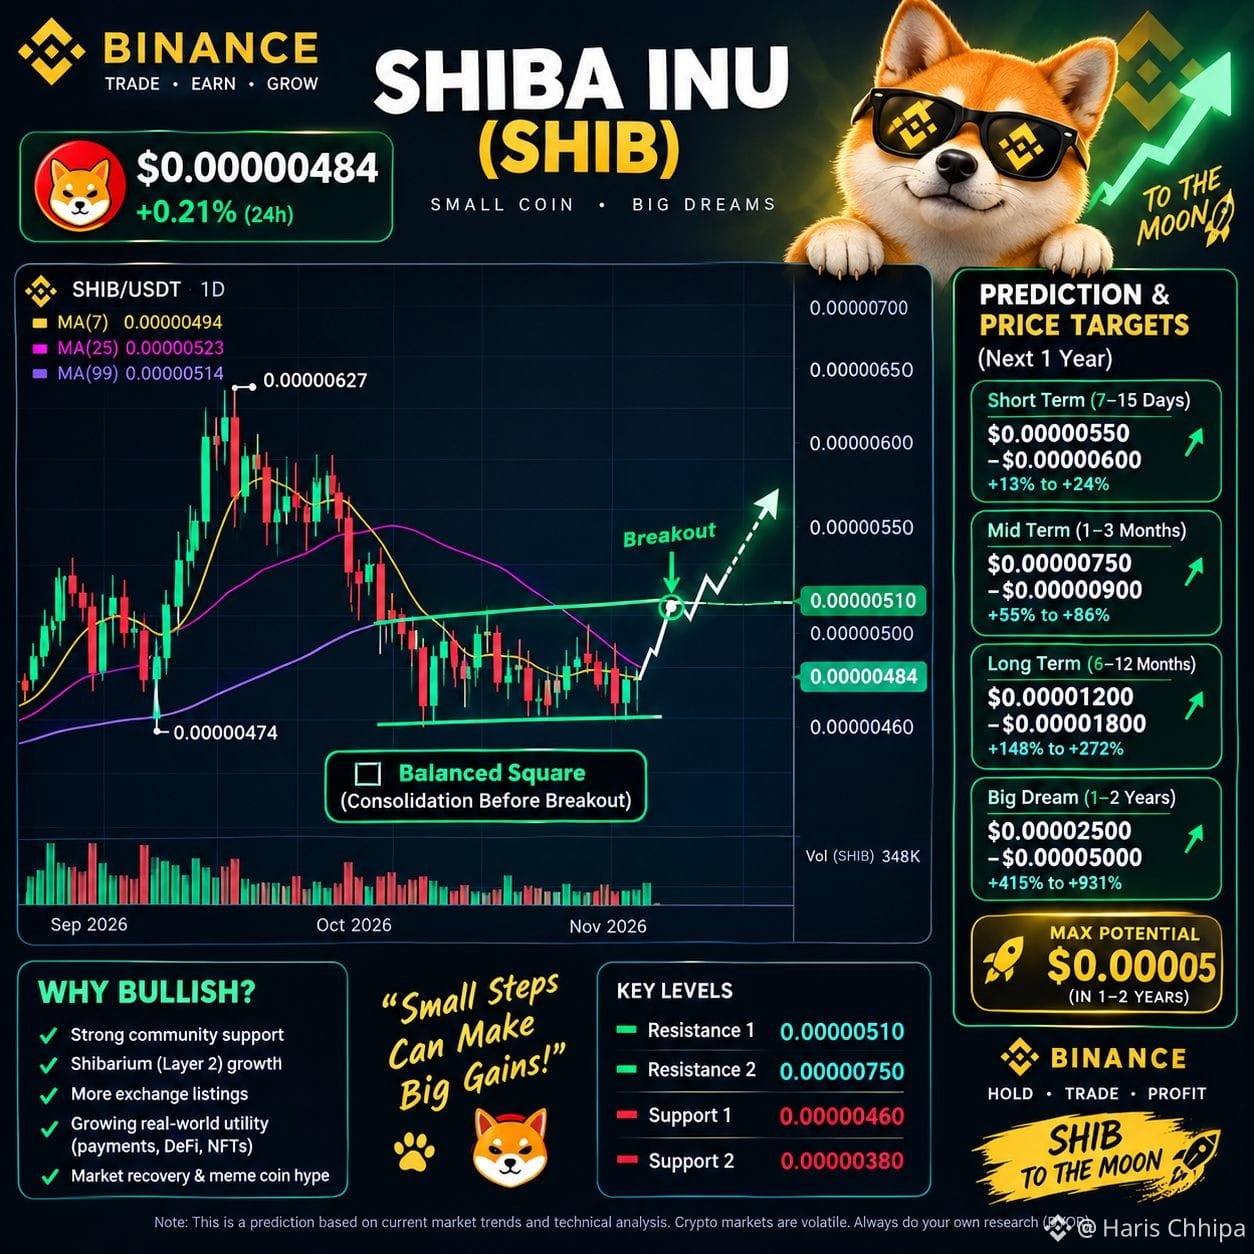
📊 Current Price: $0.00000484
🟢 24H Change: +0.21%
SHIB is currently trading near a key support zone after a significant pullback. The daily chart shows that the price is below the MA(7), MA(25), and MA(99), indicating that bearish pressure remains in control.
However, if buyers defend support and trading volume increases, SHIB could attempt a recovery! 📈
🎯 SHIB Price Targets
🔹 Short-Term: $0.00000550–$0.00000600
🔹 Mid-Term: $0.00000750–$0.00000900
🔹 Bullish Long-Term Scenario: $0.00001200–$0.00001800
🔥 Speculative 1–2 Year Target: $0.00002500–$0.00005000
📍 Key Levels to Watch
🟢 Support: $0.00000460
🟢 Stronger Support: $0.00000380
🔴 Resistance: $0.00000510
🚀 Major Resistance: $0.00000550–$0.00000600
What could drive SHIB higher?
✅ Growing Shiba Inu community
✅ Shibarium ecosystem development
✅ Increased market liquidity
✅ A broader crypto market recovery
✅ Stronger buying volume and a confirmed breakout
⚠️ My Trading View: SHIB needs to reclaim $0.00000510 and break above nearby resistance with strong volume to improve its bullish outlook. A drop below support could trigger further downside.
💬 What do you think? Can SHIB reach $0.00001 in the next bull run, or will the bears push it lower?
🐕 SHIB Army, share your prediction below! 🚀
#SHIB #ShibaInu #SHIBArmy #Crypto #CryptoPrediction #BinanceSquare #Altcoins #MemeCoins #TechnicalAnalysis #CryptoTrading #BullRun #CryptoMarket
Disclaimer: These are speculative scenarios based on the chart provided, not guaranteed price targets or financial advice. Crypto markets are highly volatile. Always DYOR.
1
143
·
--
🚨 CRYPTO MARKET ROTATION: XRP, BTC, SOL OR AI TOKENS — WHAT'S NEXT? 🚀
🔥 The crypto market may be entering a new phase where regulatory clarity, blockchain infrastructure, and AI-powered payments compete for investor attention.
👀 3 NARRATIVES I'M WATCHING:
🏛️ 1. XRP & INJ — REGULATORY MOMENTUM Greater regulatory clarity could improve institutional confidence. Watch developments around RLUSD adoption and U.S. crypto legislation. Could XRP benefit from the next wave of institutional interest? 💎
₿ 2. BTC & SOL — THE MARKET'S FOUNDATION Bitcoin remains a key market benchmark, while Solana's ecosystem continues to attract attention. If market sentiment improves, established Layer 1 projects could regain momentum. 📈
🤖 3. x402 & AI CRYPTO — THE WILDCARD AI agents making autonomous payments could open a new crypto use case. The x402 ecosystem is a narrative worth watching, but explosive growth can also bring extreme volatility. ⚡
🎯 MY MARKET TAKE The biggest opportunity may come from identifying where capital flows next — not simply chasing tokens that have already pumped.
But remember: narratives are not guarantees, and reported growth figures should be independently verified.
🔥 YOUR TURN — LET'S DISCUSS!
If you had to choose ONE narrative for the next 48 hours, which would it be?
🅰️ XRP / INJ — Regulatory momentum
🅱️ BTC / SOL — Established leaders
🅲 AI / x402 — High-growth opportunity
👇 Comment A, B, or C — and tell us WHY!
♻️ Share this with a crypto trader who needs to watch these narratives.
#BinanceSquare #Crypto #XRP #Bitcoin #Solana #Injective #AIcrypto #x402 #Altcoins #CryptoNarratives #CryptoMarket

101
·
--
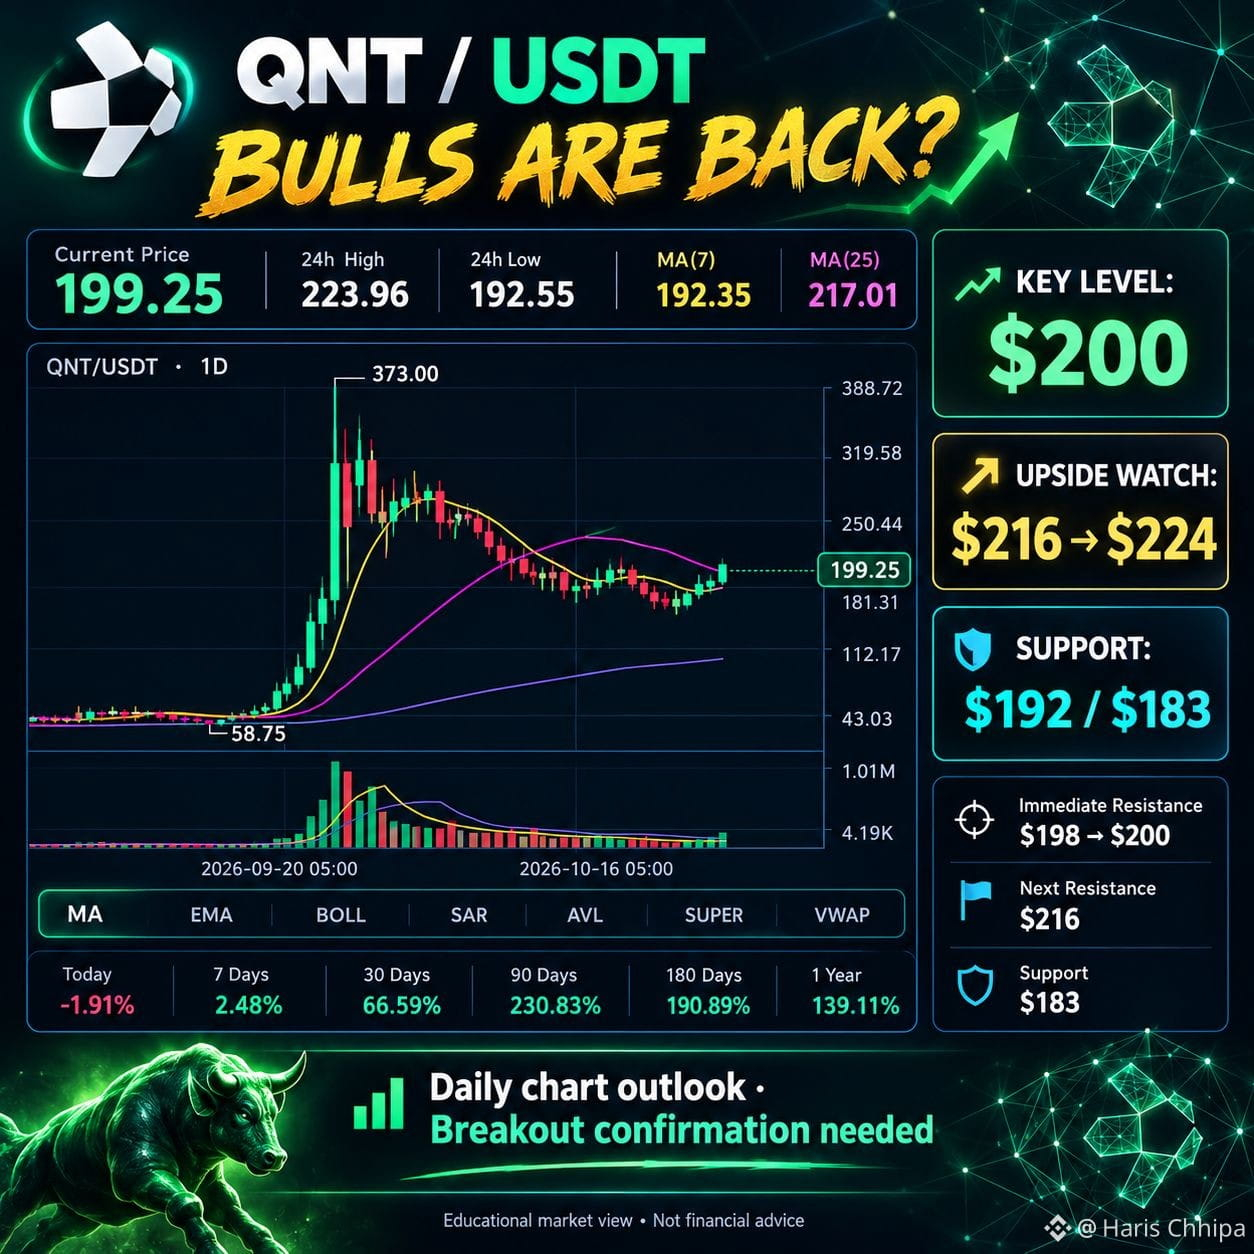
🚨🔥 QNT HOLDERS, ARE YOU READY FOR THE NEXT MOVE? 🚀
💥 Quant (QNT) is back in the spotlight!
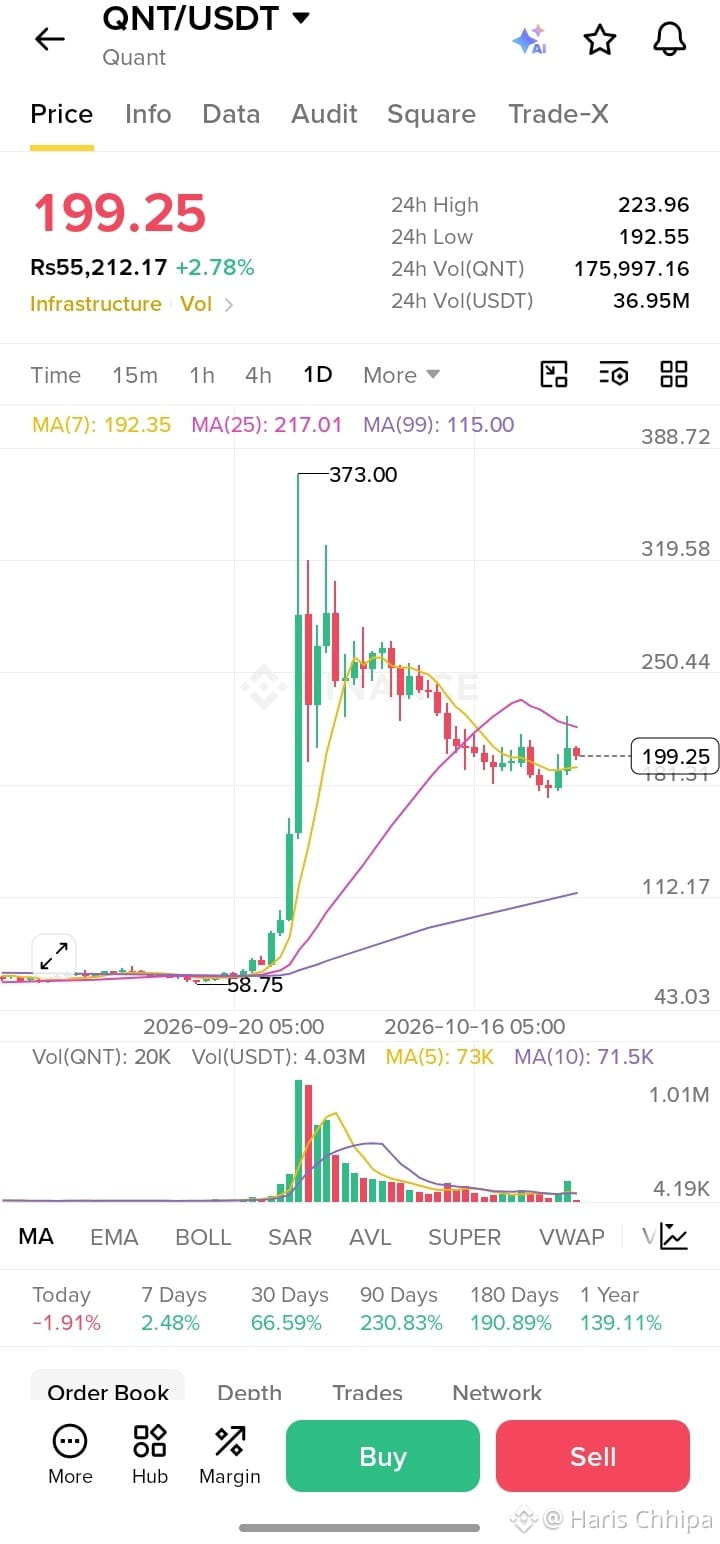
QNT is trading around $199.25, and all eyes are on the crucial $200 resistance zone. 👀📈
🐂 BULLISH SCENARIO
If QNT breaks above $200 with strong volume, could we see:
🎯 $216
🎯 $224
🚀 $250 if momentum accelerates!
🐻 BEARISH SCENARIO
If bulls fail to hold momentum, watch these support levels:
🛡️ $192
🛡️ $183
🔥 LET'S MAKE THIS INTERESTING!
👇 Answer these 3 questions in the comments:
1️⃣ Your QNT target?
A) $216
B) $224
C) $250+
D) Back to $183 😱
2️⃣ Are you BUYING, HOLDING, or SELLING QNT right now?
3️⃣ Can QNT break $224 in the next 7 days? YES or NO? 👇
💬 Drop your prediction below and reply to another trader's target. Let's see who gets it right! 🚀
🔔 Follow for more crypto chart analysis and market updates.
#QNT #Quant #QNTUSDT #BinanceSquare #CryptoCommunity #Altcoins #CryptoPrediction #Bitcoin #CryptoTrading #PricePrediction
⚠️ Chart-based scenarios only, not financial advice. Crypto is volatile, so manage your risk.
1
136
·
--
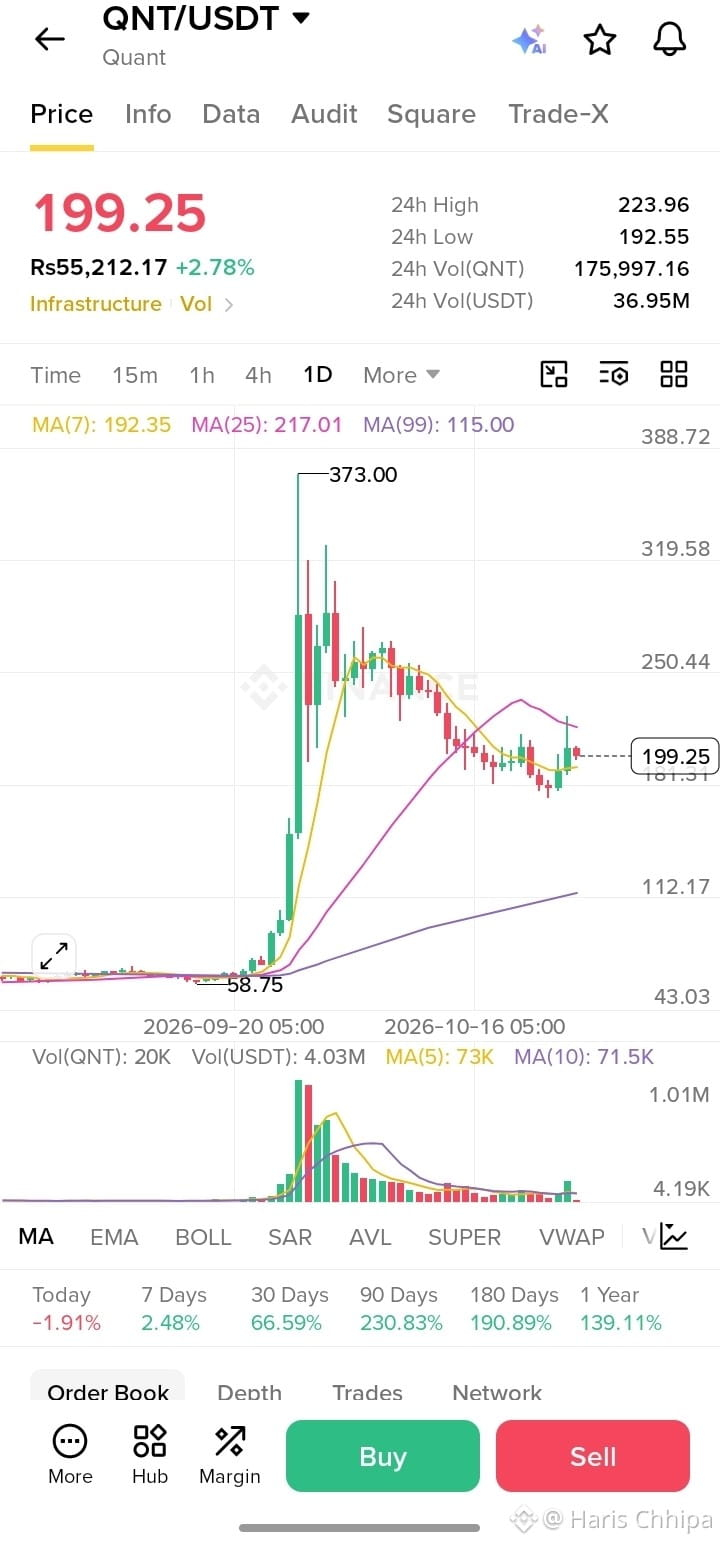
🚀 QNT IS WAKING UP! IS ANOTHER MASSIVE MOVE COMING? 🔥
Quant (QNT) is showing impressive momentum after a powerful rally! 💥
📊 QNT/USDT Technical Analysis
Based on the chart:
💰 Current Price: $199.25
📈 24H High: $223.96
🟢 7-Day Performance: +2.48%
🔥 30-Day Performance: +66.59%
🎯 What's Next for QNT?
🐂 Bullish Scenario:
If QNT breaks and holds above the $200 resistance zone, the next targets could be:
🎯 Target 1: $216
🎯 Target 2: $224
🚀 Target 3: $240–$250 if bullish momentum continues.
🛡️ Important Support Levels:
• $192 — Immediate support
• $183 — Key support zone
• $171 — Deeper support if selling pressure increases
⚠️ My Outlook: QNT has shown strong recovery potential, but after such a powerful move, profit-taking and volatility are possible. A confirmed breakout above $200, supported by strong volume, would strengthen the bullish case.
🔥 Can QNT reclaim $250 next, or will the bears push it lower?
👇 Share your QNT price prediction in the comments!
#QNT #Quant #QNTUSDT #BinanceSquare #CryptoAnalysis #Altcoins #CryptoTrading #TechnicalAnalysis #Bullish #CryptoMarket
⚠️ This is a technical outlook, not financial advice. Always manage your risk.
373
·
--
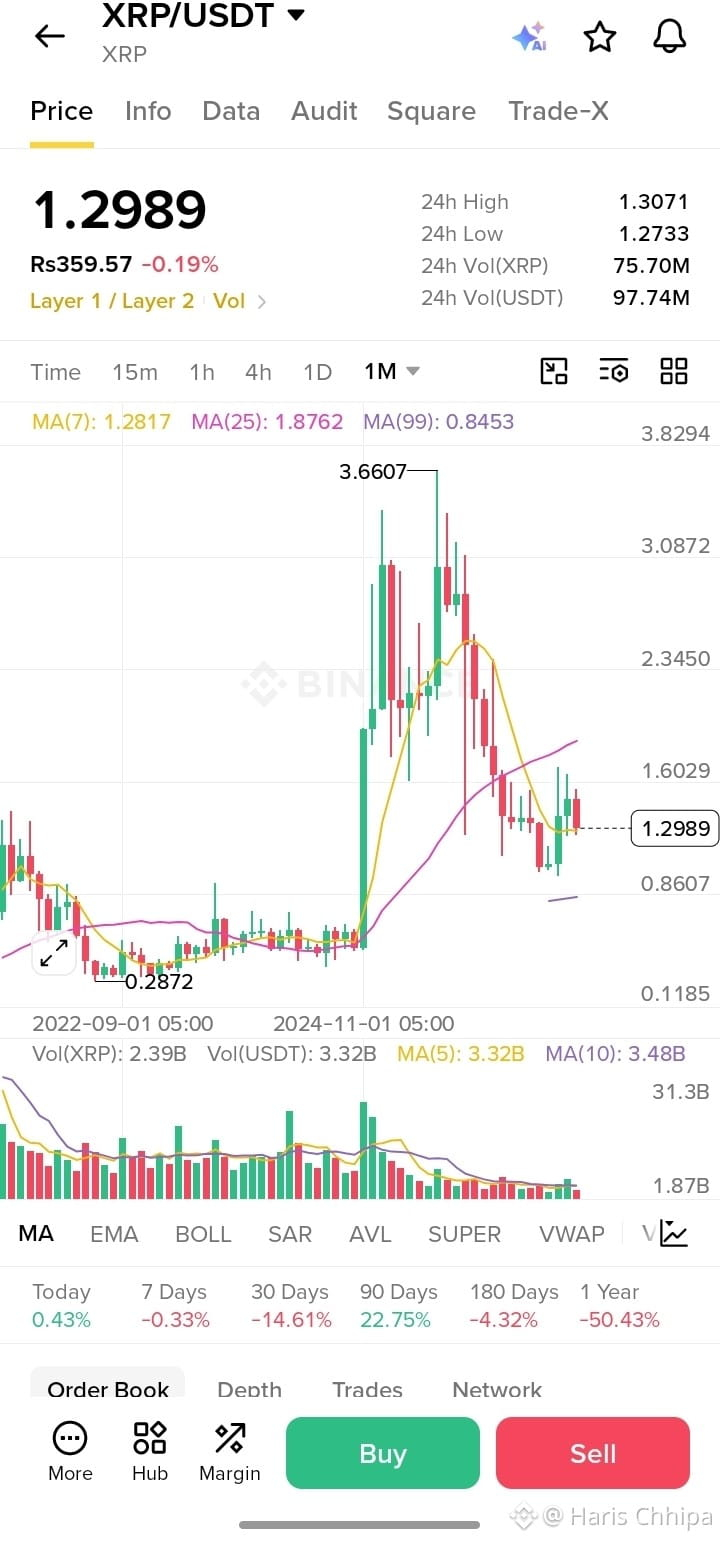
🚀 XRP PRICE PREDICTION: WHERE COULD XRP GO NEXT? 📈
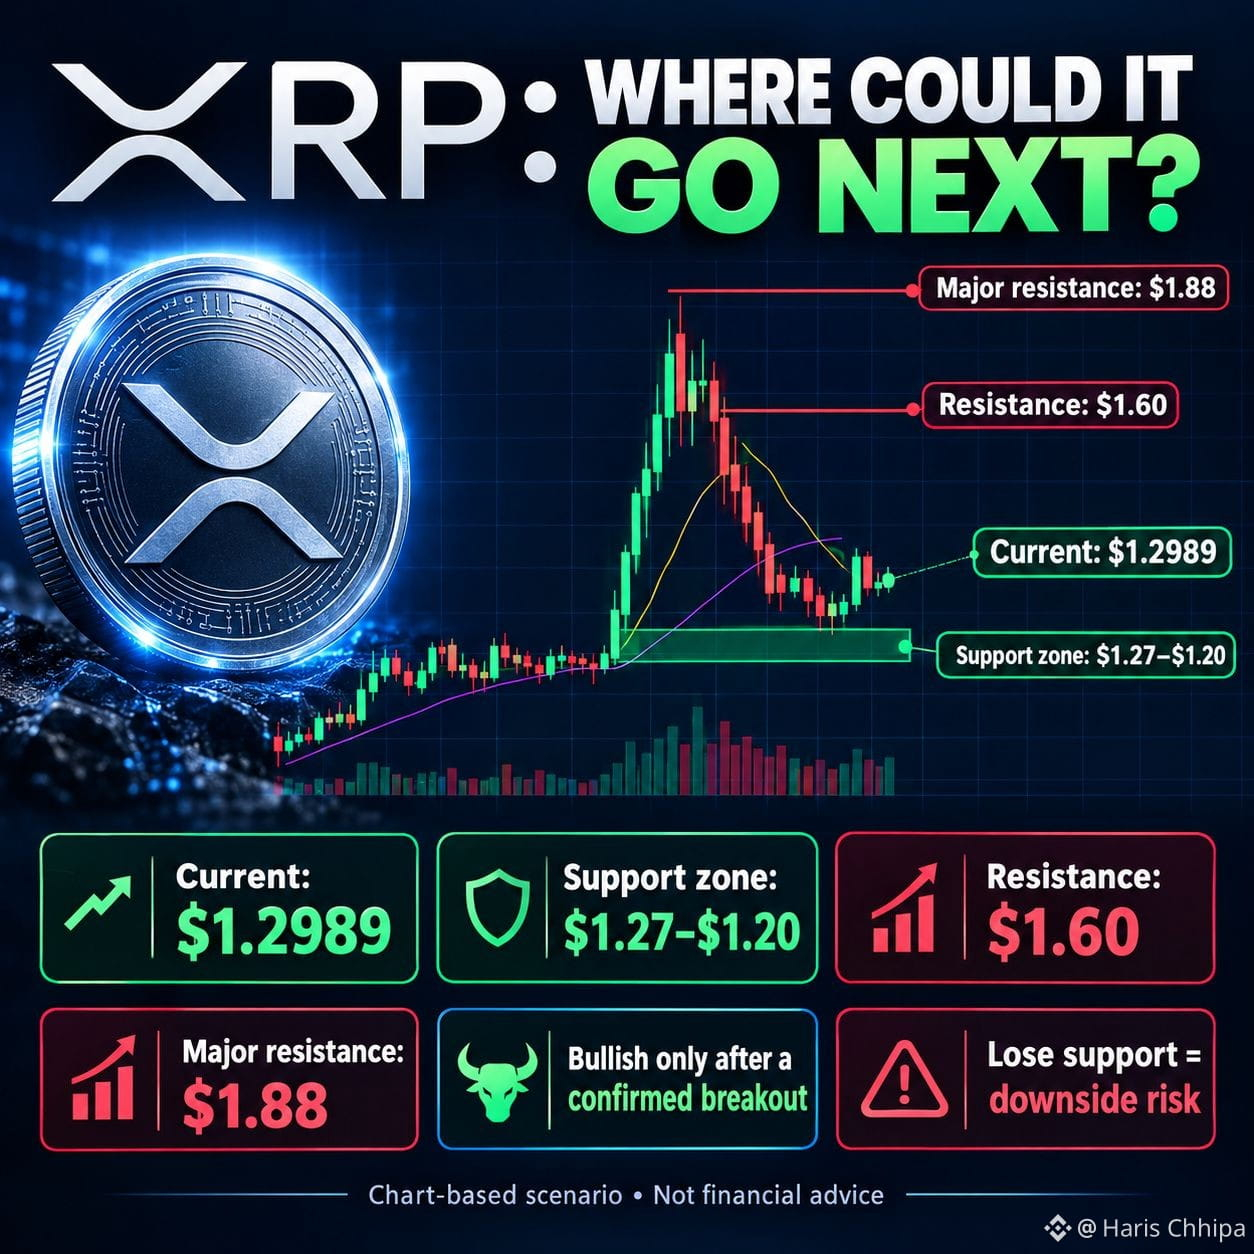
XRP is trading around $1.2989. After its massive rally to $3.6607, the chart shows a significant correction. Can XRP make a strong comeback? 👀
📊 XRP/USDT Technical Analysis
💰 Current Price: $1.2989
🟢 Support Zone: $1.27–$1.20
If buyers defend this area, XRP could attempt another recovery.
🎯 Resistance Levels:
- $1.60 — First major resistance
- $1.88 — Important breakout level
- $2.00+ — Possible upside target if bullish momentum strengthens
🐂 Bullish Scenario: A strong breakout above $1.60 could open the door toward $1.88 and potentially higher levels.
🐻 Bearish Scenario: If XRP loses the $1.20 support zone, further downside may follow.
🔥 My Outlook: XRP is at an important technical area. Watch volume and monthly candle confirmation before assuming a major rally. A breakout is not guaranteed!
💬 What do you think? Can XRP reach $2 again, or will it fall below $1.20 first?
👇 Comment your XRP price target!
#XRP #Ripple #XRPUSDT #Crypto #BinanceSquare #CryptoAnalysis #PricePrediction #Altcoins #Trading #Bullish
231
·
--
Here's the latest on Binance (October 2026):
- **Delistings:** Binance will delist EPIC and QUICK on October 28, 2026. The announcement came on October 14, with no reason given. This month it also restricted access to 22 tokens for users in Brazil as part of regional regulatory measures.
- **USDT outflow:** On October 24, Binance saw a net outflow of about 49.96 million USDT in a single hour, its largest hourly total for October. This came as Bitcoin slid toward $80,000 and spot ETFs posted a second day of outflows. The report frames it as part of a market-wide deleveraging rather than a Binance-specific problem.
- **BNB price:** As of October 21, BNB was trading around $745, with resistance near $753. That's from a single source, so check a live price before acting on it.
- **Legal:** Per Wikipedia, the Wall Street Journal reported in 2026 that Binance is under US DOJ investigation for allegedly evading sanctions on Iran-backed groups such as the Houthis. This is an investigation and allegation, not a verdict.
- **Leadership:** Yi He has been co-CEO since December 2025, alongside Richard Teng.
I can dig deeper into any of these, such as BNB price, listings, or the DOJ probe.
#BinancePick #EarningsSeason #DelistingAlert #DelistingDrama
42
·
--
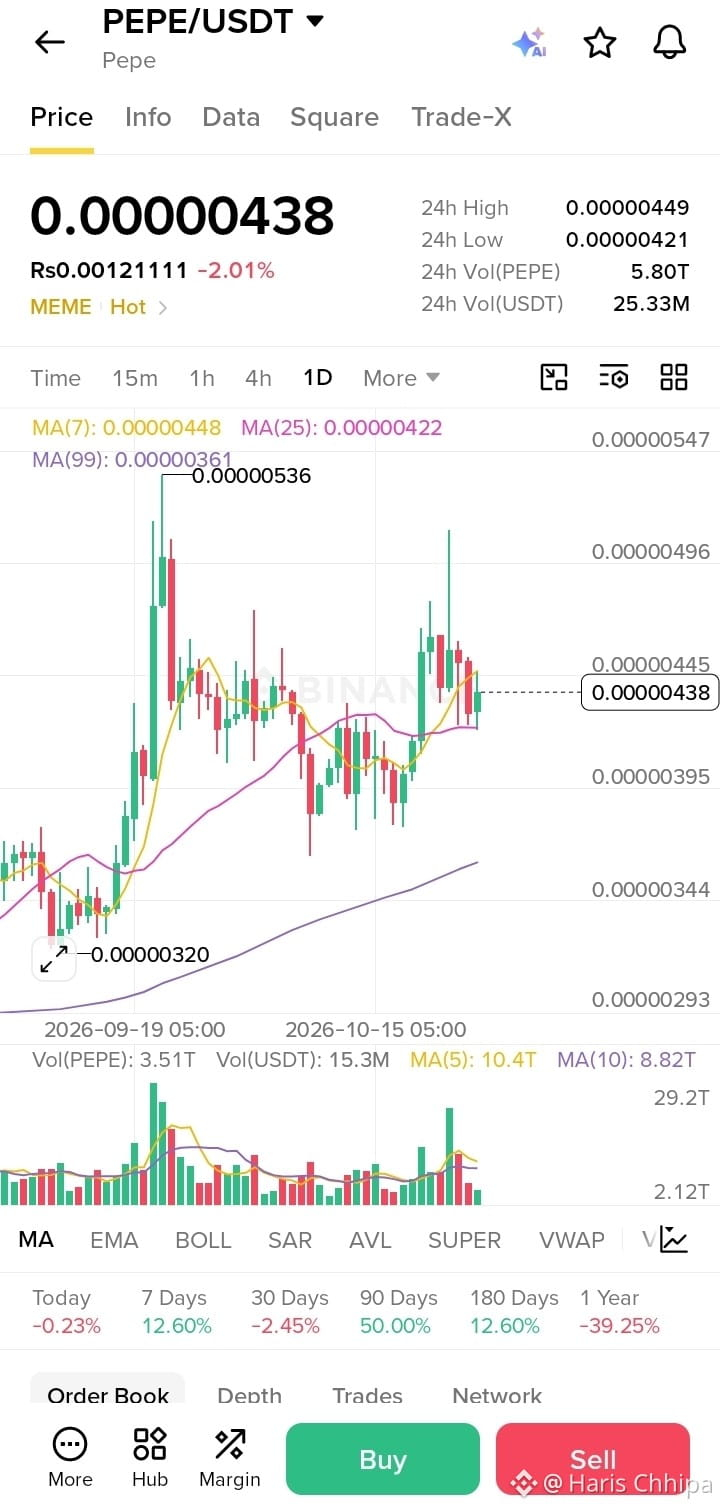
**Short answer: neutral to slightly bearish bias, best treated as a wait-and-see range trade.** This is technical analysis only, not financial advice, and nobody can reliably predict 24h crypto moves.
**What the chart shows (PEPE/USDT, 1D):**
- Price 0.00000438, sitting just under MA(7) at 0.00000448 and just above MA(25) at 0.00000422. It's squeezed between them.
- A long upper wick near 0.00000496 on Oct 21 shows sellers rejected the higher prices.
- Recent candles are lower highs, and volume is fading versus the big September spike, so momentum is weakening.
- MA(99) at 0.00000361 is well below, so the larger trend is still up.
**Key levels:**
- Resistance: 0.00000448 (MA7), then 0.00000449 (24h high), then 0.00000496
- Support: 0.00000422 (MA25 / 24h low), then 0.00000395, then 0.00000361
**Likely 24h scenarios:**
- **Most likely (~50%):** chop between 0.00000421 and 0.00000449.
- **Bearish (~30%):** daily close below 0.00000422 opens a drop toward 0.00000395.
- **Bullish (~20%):** a close above 0.00000449 with rising volume targets 0.00000470 to 0.00000496.
**Position idea:** With price in the middle of the range, the risk/reward is poor for a fresh entry. Safer approaches are waiting for a break and close beyond either 0.00000422 or 0.00000449, or buying near support with a tight stop below 0.00000415. Memecoins like PEPE can move 10%+ on news or Bitcoin swings, so keep size small.
85
·
--
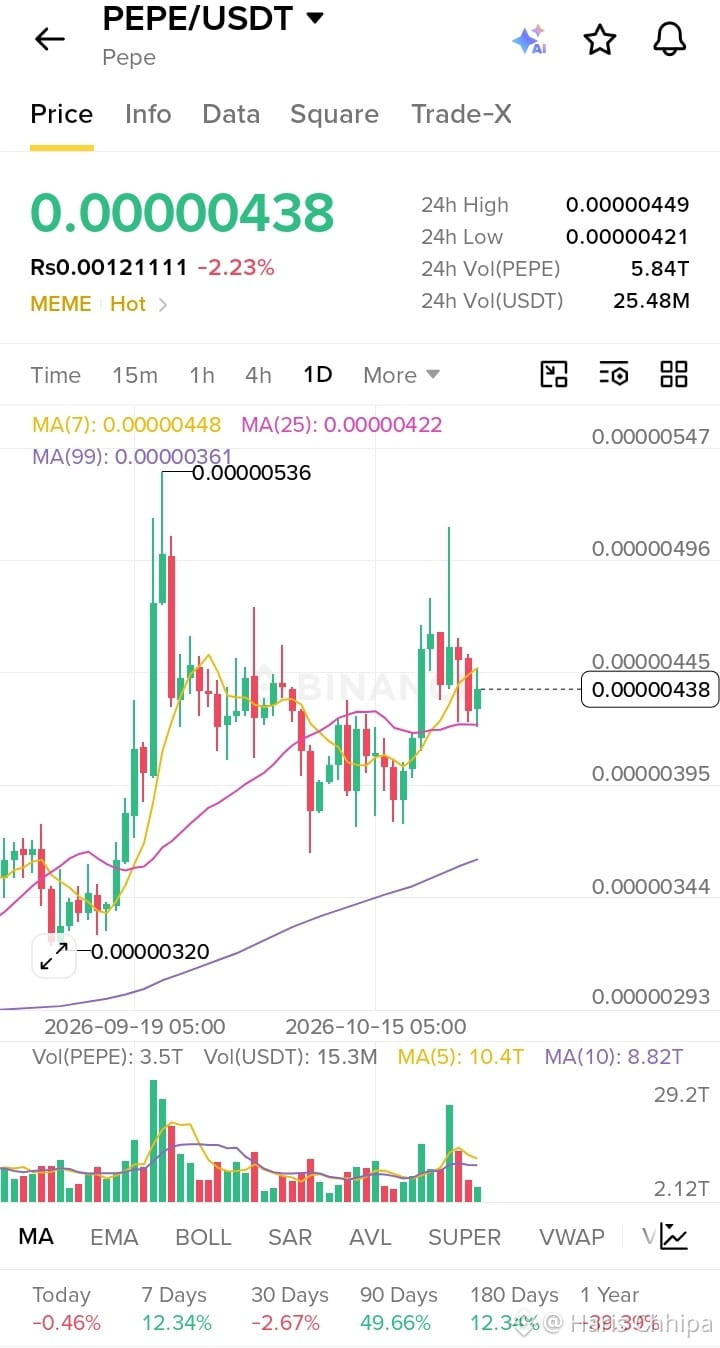
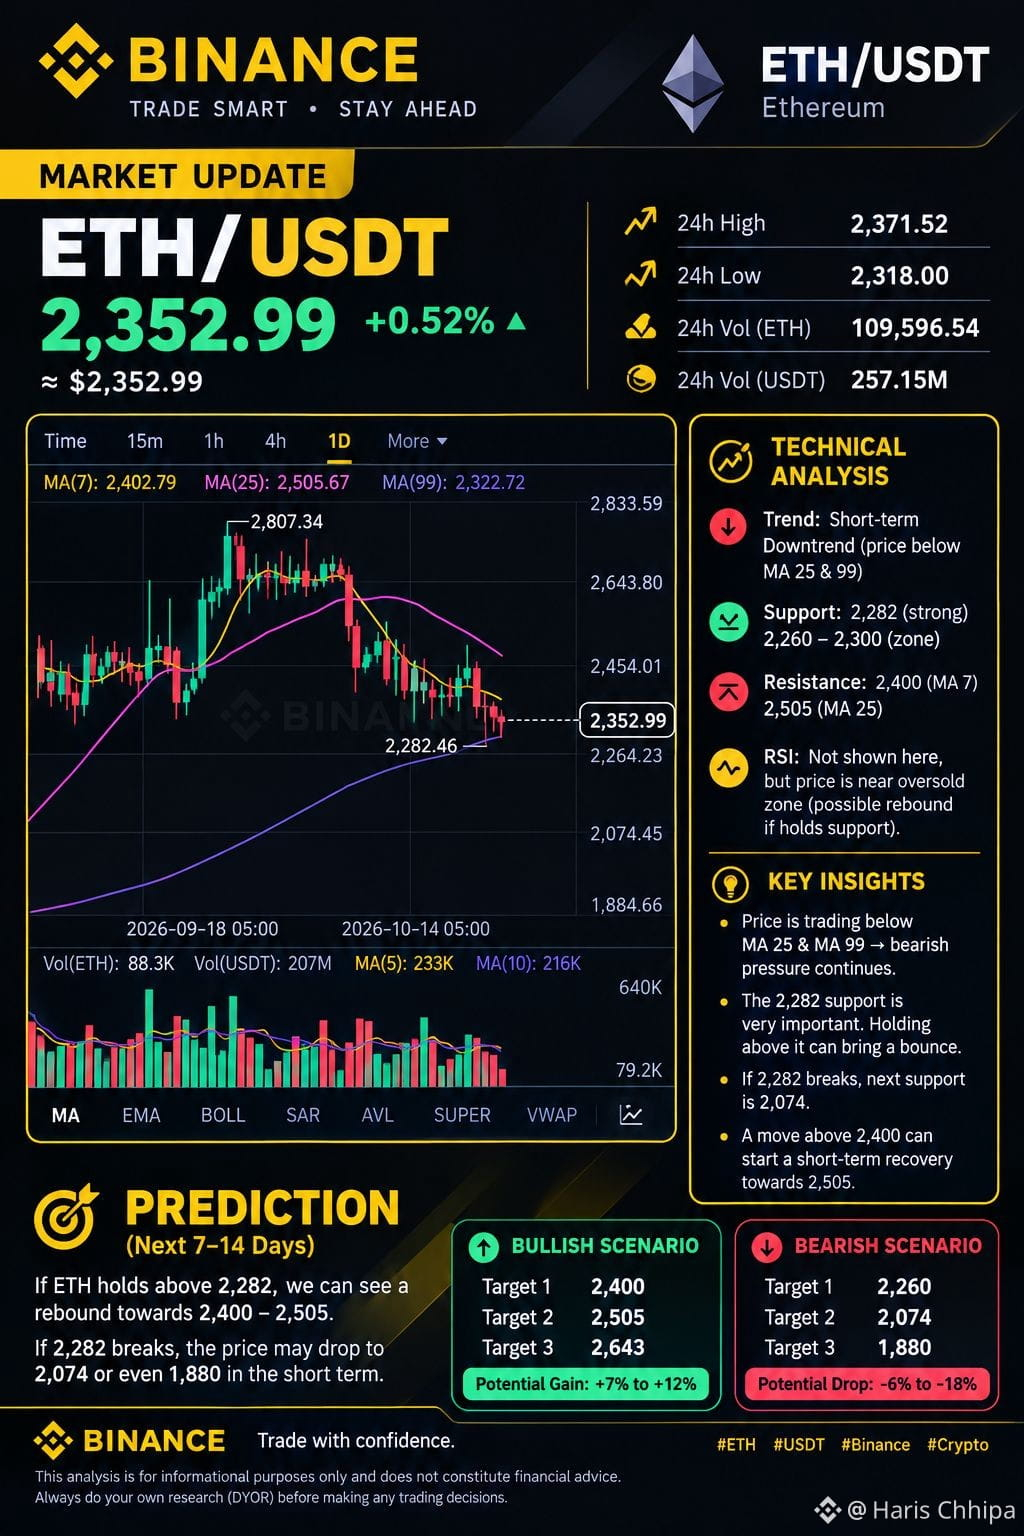
### PEPE/USDT — Next 24 Hours Prediction
Based on your Binance 1D chart · October 26, 2026
Current price
0.00000438 USDT
-2.23% (24h)
Expected direction
Neutral to slightly bearish
Potential 24h range
0.00000421–0.00000455
1. Technical analysis
* MA(7): 0.00000448 — Price is below the short-term moving average, suggesting near-term selling pressure.
* MA(25): 0.00000422 — Price remains above this average, which may act as support.
* MA(99): 0.00000361 — The longer-term trend shown on the chart remains constructive relative to this average.
* Resistance: 0.00000445–0.00000449.
* Support: 0.00000421–0.00000422.
The chart shows a recent bounce toward 0.0000049 followed by a pullback. Price is now consolidating, and the next move will likely depend on whether buyers can reclaim the 0.00000445–0.00000449 area.
Possible for the next 24 hours
Bullish
Target: 0.00000449–0.00000460
If PEPE breaks above 0.00000449 with strong buying volume, it could move toward 0.00000460. A stronger rally would need further confirmation.
Neutral
Range: 0.00000430–0.00000448
Price may continue moving sideways while buyers and sellers compete around the current level.
Bearish
Target: 0.00000421–0.00000410
If support at 0.00000421 breaks, selling pressure could push the price lower.
These are conditional technical scenarios, not guaranteed targets. Recent market data also shows trading around the 0.0000044 area, with the day's low near 0.00000421 and high near 0.00000449.
3. My trading view
* Bias: Neutral to slightly bearish until resistance breaks.
* Bullish confirmation: A sustained move above 0.00000449 with increasing volume.
* Bearish confirmation: A breakdown below 0.00000421.
* Risk management: Avoid entering solely on a prediction; use a stop-loss appropriate to your risk tolerance.
Final prediction: PEPE may consolidate or attempt a small recovery over the next 24 hours, but a break below 0.00000421 would increase downside risk.
This is a technical estimate based on your chart and available market data, not financial advice.
1
326
·
--
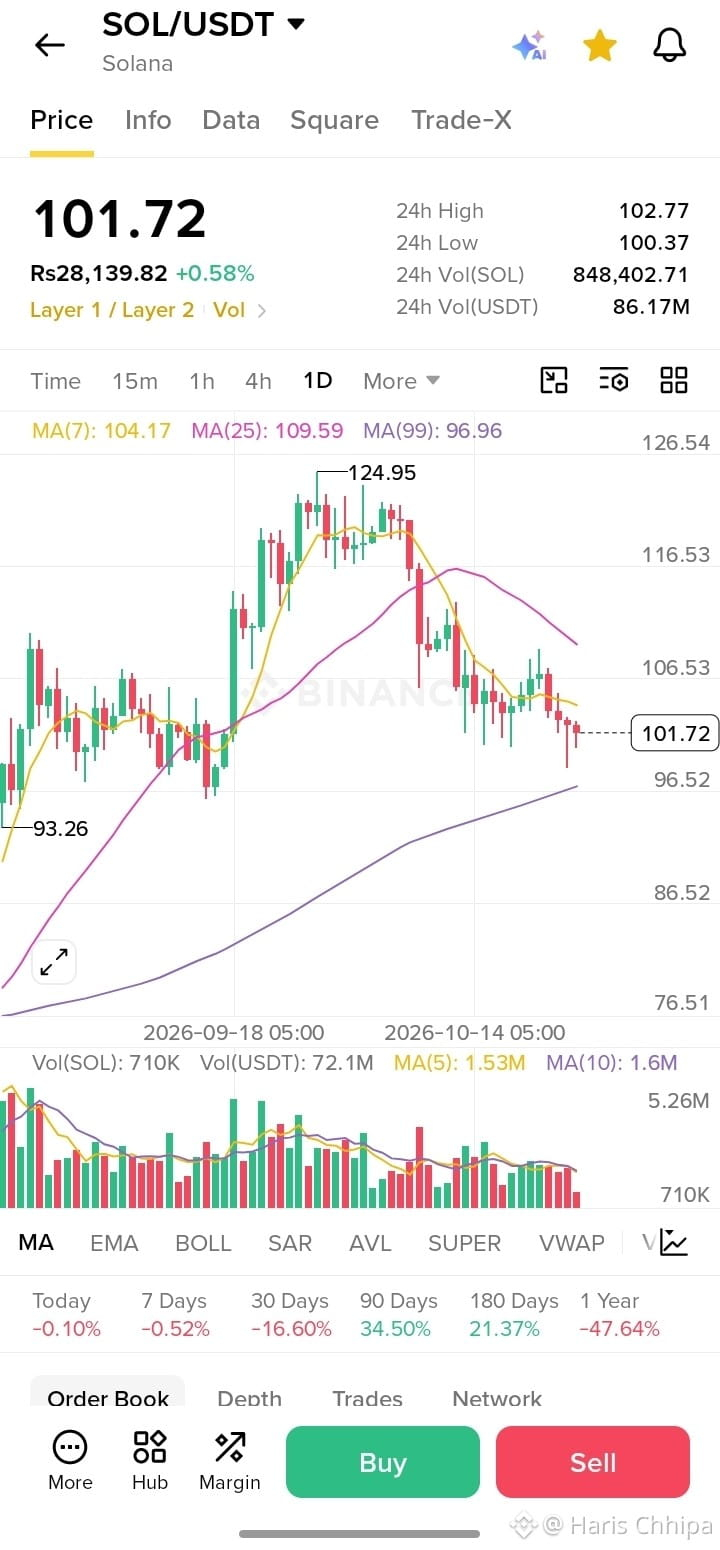
📉 SOLANA (SOL) PRICE ANALYSIS — BEARS IN CONTROL?
🔥 SOL/USDT: $101.72
Solana is showing short-term bearish momentum after dropping from its recent high of $124.95. Sellers appear to be maintaining pressure, but will buyers defend the key support zone? 👀
📊 Technical Breakdown:
🔴 Current Price: $101.72
🔴 MA(7): $104.17
🔴 MA(25): $109.59
🟢 MA(99): $96.96
📍 Key Levels to Watch:
🛡️ Support 1: $100.37
🛡️ Support 2: $96.96
🚀 Resistance 1: $104.17
🚀 Resistance 2: $106.53–$109.59
🐻 Bearish Scenario: If SOL breaks below $100.37, the price could test the $97 area.
🐂 Bullish Scenario: If buyers reclaim $104–$106 with strong volume, a short-term recovery could develop.
⚠️ My Take: SOL is trading below its 7-day and 25-day moving averages, suggesting continued short-term weakness. However, the 99-day moving average near $96.96 could act as an important support area.
💬 What do you think?
Will SOL bounce back above $105, or drop toward $97 first?
👇 Share your analysis in the comments!
#SOL #Solana #SOLUSDT #CryptoAnalysis #BinanceSquare #CryptoTrading #TechnicalAnalysis #Bitcoin #Altcoins #CryptoMarket
66
·
--
📊 **$BTC/USDT 1-Min Update**
BTC is trading at **80,454** right now (24h: -0.41%).
📌 Price is above MA(7) and MA(25), showing slightly bullish short-term momentum
📌 MA(99) at **80,461** is acting as resistance
📌 Support: **80,446 / 80,425**, with the recent low at **80,313**
📌 Volume is low, so waiting for volume confirmation on any breakout
🔑 A close above **80,461 with volume** could open the way to 80,475. Otherwise, expect sideways action.
24h range: 79,220 – 81,033
⚠️ This is just my personal analysis, not financial advice. Do your own research (DYOR) and manage your risk.
#BTC #Bitcoin #BTCUSDT #Binance #BinanceSquare #CryptoTrading #TechnicalAnalysis #DYOR #cryptouniverseofficial
81
·
--
🚀 MEME COINS: THE NEXT BIG MOVE? 🐶🐸
Meme coins are driven by community power, market sentiment, and viral trends! 🔥
👀 Coins to Watch:
🐕 DOGE — Dogecoin
🐕 SHIB — Shiba Inu
🐸 PEPE — Pepe
⚔️ FLOKI — Floki
🐶 BONK — Bonk
📊 My Market View:
Meme coins can experience massive price swings in both directions. Watch trading volume, market momentum, Bitcoin’s direction, and important support and resistance levels before entering a trade.
💡 Smart Trading Rules:
✅ Do your own research (DYOR).
✅ Avoid FOMO buying.
✅ Set a stop-loss where appropriate.
✅ Never invest more than you can afford to lose.
🌕 Which meme coin do you think will perform best in the next bull run? Comment below! 👇
#MemeCoins #DOGE #SHIB #PEPE #FLOKI #BONK #Crypto #BinanceSquare #CryptoTrading #Altcoins #DYOR #CryptoCommunity
1
4
358


Войдите, чтобы посмотреть больше материала
Присоединяйтесь к пользователям криптовалют по всему миру на Binance Square
⚡️ Получайте новейшую и полезную информацию о криптоактивах.
💬 Нам доверяет крупнейшая в мире криптобиржа.
👍 Получите достоверные аналитические данные от верифицированных создателей контента.
Эл. почта/номер телефона
В тренде
CanMicrosoftDeliverOnAI
Просмотров: 190,815
1,545 обсуждают
Earnings Season Session 3: Will Google & Microsoft Beat Earnings Expectations?
Binance Square Official
·Лайков: 95
·Просмотров: 28.7k
CanGoogleDefindItsCore
Просмотров: 97,869
1,116 обсуждают
EarningsSeason
Просмотров: 5.7M
27,474 обсуждают