

EquityPlainTalk
1.4k Публикации

EquityPlainTalk
Отправить жалобу
Заблокировать пользователя
Clear, common-sense market notes for U.S. stock investors navigating noise, data, and human behavior.
0 подписок(и/а)
159 подписчиков(а)
386 понравилось
Посты
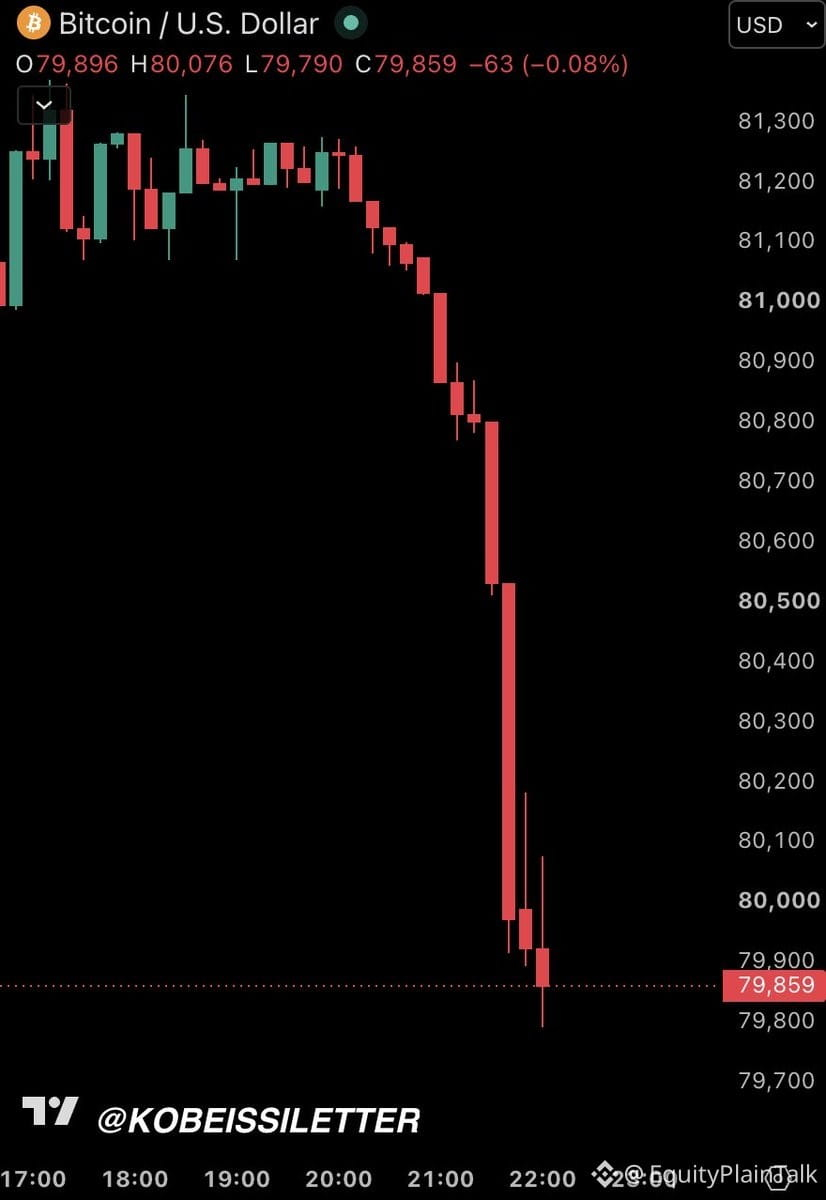
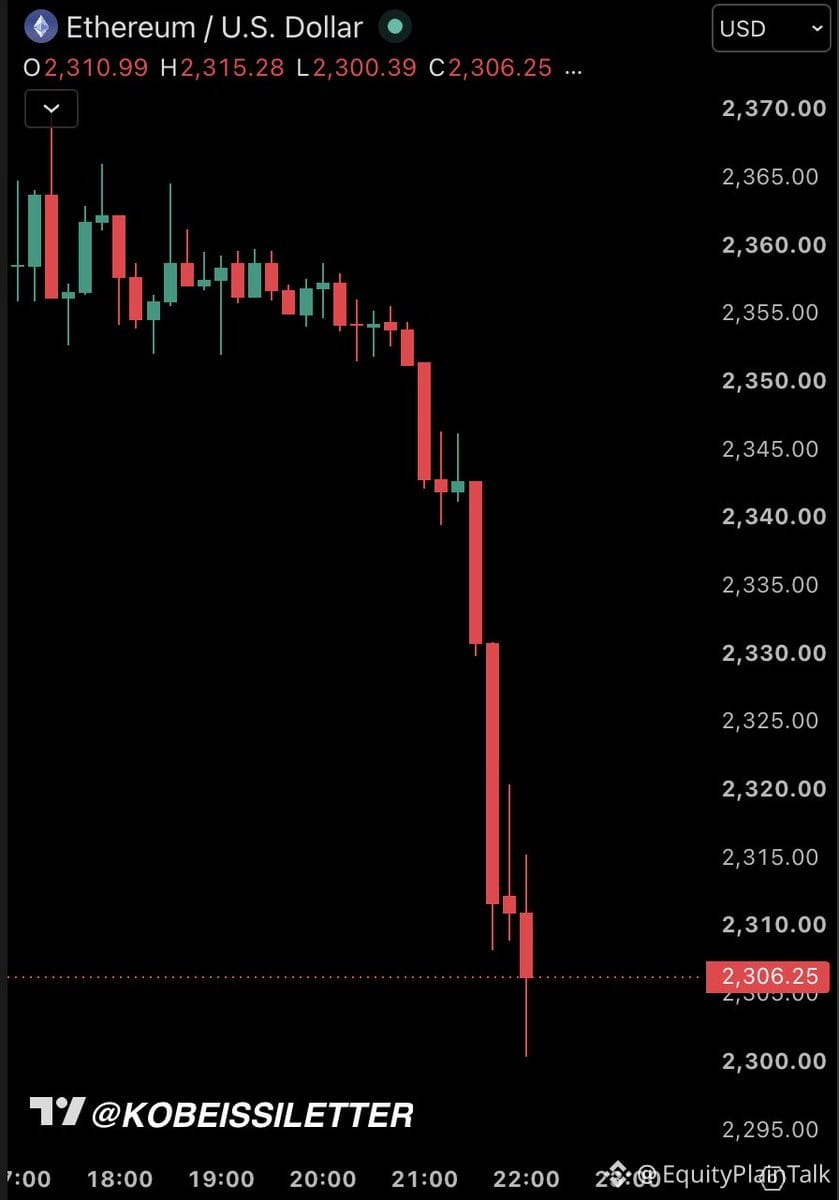
$BTC just dropped below $80k as crypto liquidations hit $335M in 24 hours. Tech stocks selling off at the same time.
When risk assets move together like this, it's usually not about crypto fundamentals—it's about broader market sentiment and liquidity conditions. Watch how tech closes today.
$BTC just dropped below $80k as crypto liquidations hit $335M in 24 hours. Tech stocks selling off at the same time.
When risk assets move together like this, it's usually not about crypto fundamentals—it's about broader market sentiment and liquidity conditions. Watch how tech closes today.
When risk assets move together like this, it's usually not about crypto fundamentals—it's about broader market sentiment and liquidity conditions. Watch how tech closes today.
2
Частичная правда
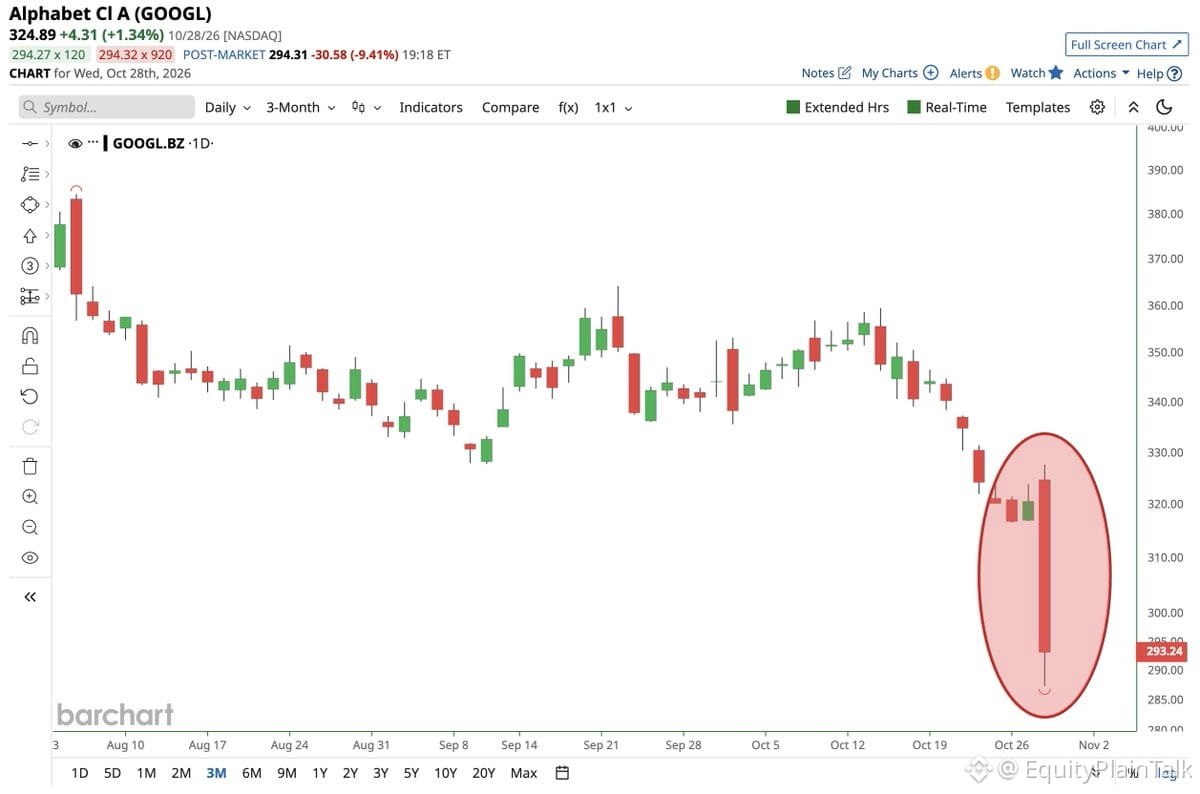
$GOOGL getting absolutely hammered today.
No real analysis here, just watching a mega-cap tech name take a serious hit. When one of the market's anchors starts moving like this, it usually means something shifted—either in sentiment, positioning, or actual fundamentals.
Keep an eye on whether this is isolated or if it spreads to the rest of big tech. Single-name moves can stay contained, but they can also be the first domino.
2
1.1k
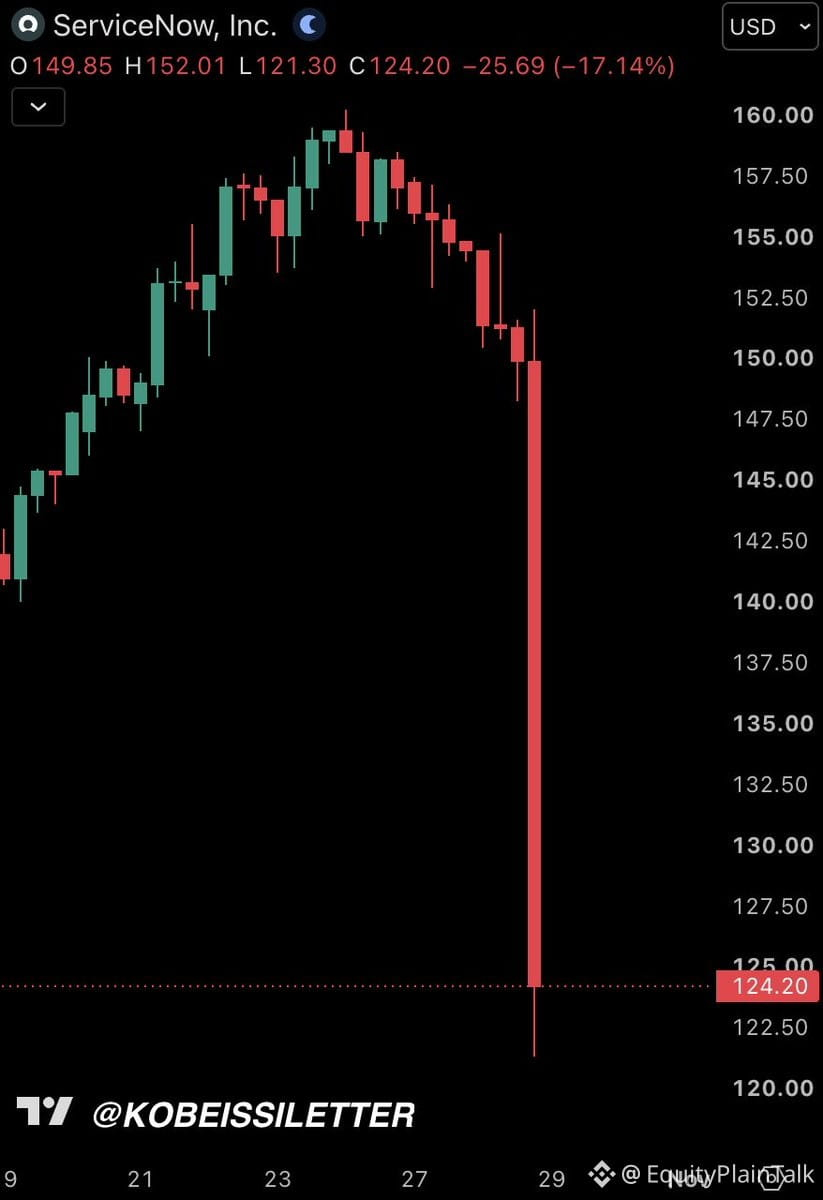
ServiceNow $NOW just got absolutely hammered — down nearly 20% after earnings. Q3 numbers came in softer than the street expected.
This is the kind of move that reminds you earnings season isn't just about beating or missing by a few cents. It's about the forward guidance, the spending outlook, and whether enterprise software budgets are holding up.
When a high-multiple SaaS name drops this hard, it's usually telling you something about demand or margin pressure that caught people off guard. Worth watching if this is an isolated miss or part of a broader slowdown in corporate IT spend.
218
Home prices in America's 20 biggest cities just hit another all-time high. Up 0.3% in August alone—that's 5 months straight of gains.
Year-over-year? +2.7%. The index now sits at 346.6, a record.
Since early 2019, prices are up 56.5%. That's not a typo.
Chicago's been the hottest market for 6 months running, up 6.7% YoY. New York (+6.2%) and Cleveland (+4.3%) aren't far behind.
Meanwhile, affordability keeps getting worse. Prices keep climbing, rates are still elevated, and buyers are getting squeezed harder every month.
This isn't sustainable, but here we are.
56
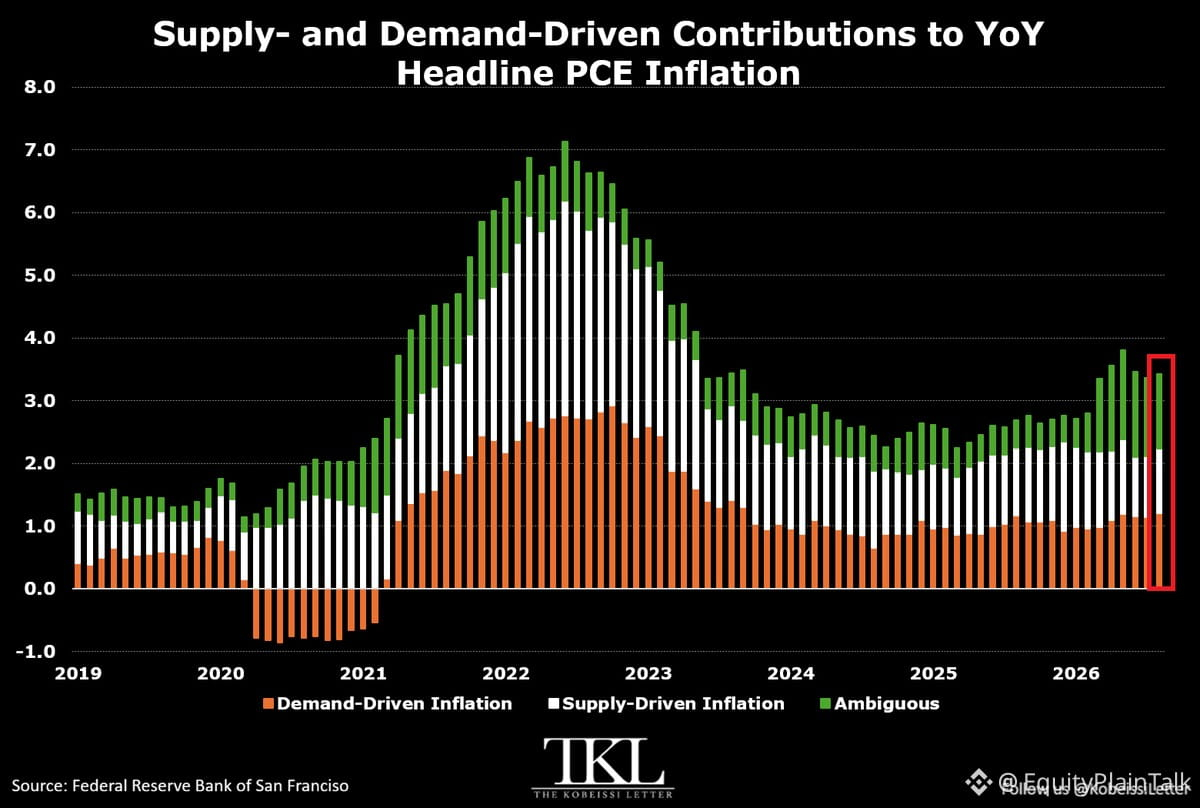
Inflation's character is changing. Demand is now driving price pressures more than supply shocks.
In August, demand-side factors added +1.2 points to the +3.4% YoY PCE inflation reading—the biggest contribution since last September. Supply issues added +1.0 point.
Compare that to 2022, when supply disruptions dominated. Back then, supply factors contributed +3.1 points per month on average vs. +2.6 from demand.
Why this matters: The Fed's rate hikes work on demand, not supply. If inflation is now demand-driven, higher rates should have more traction. But if it stays sticky, it means consumers and businesses are still spending despite tighter financial conditions.
The inflation we're dealing with today isn't the same animal it was two years ago. Policy tools that worked then may work differently now.
16
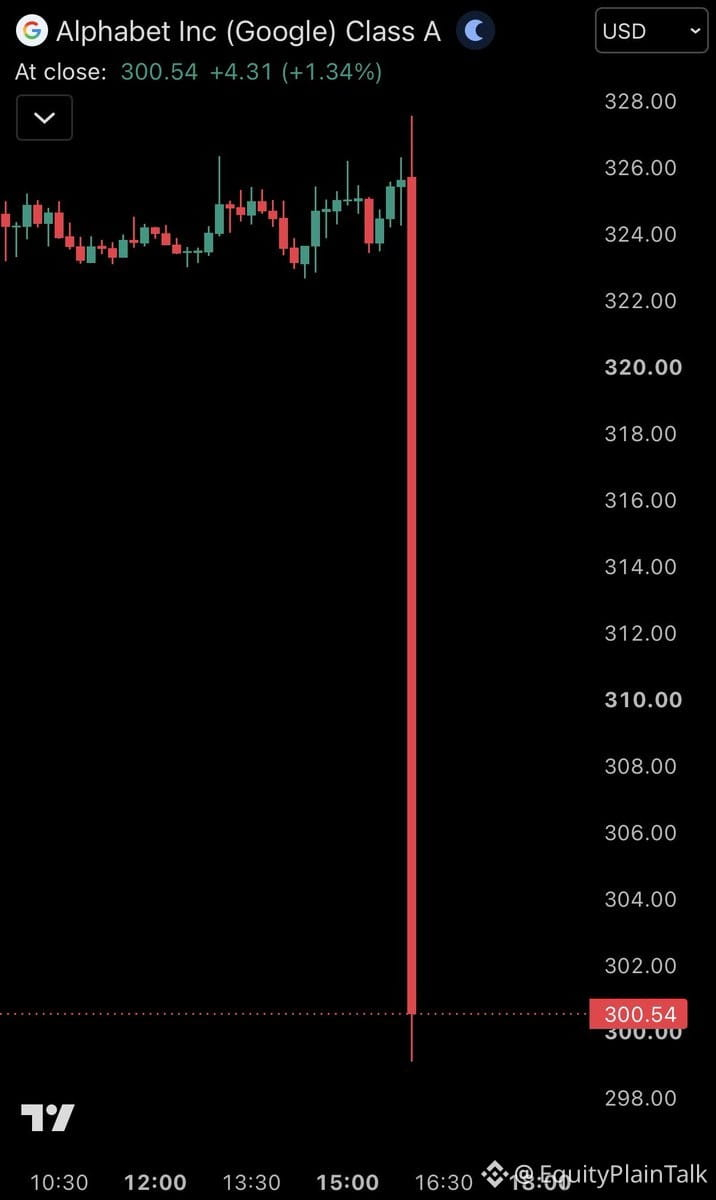
Alphabet just dropped over 8% after hours on disappointing earnings.
When mega-cap tech misses expectations, it doesn't just hurt $GOOGL holders—it rattles confidence across the entire market. These stocks have been carrying indices for months.
The real question: Is this a one-off stumble, or are we seeing the first cracks in Big Tech's dominance? Cloud growth slowing, ad revenue under pressure, AI spending not yet paying off—all red flags investors are watching closely.
If more FAANG names follow this pattern in upcoming earnings, we could see serious rotation out of tech and into defensive sectors or value plays.
Watch how the broader market reacts tomorrow. Single-stock moves can become sector-wide problems fast.
GOOGL-9,91%
GOOGUS-8,14%
1
860
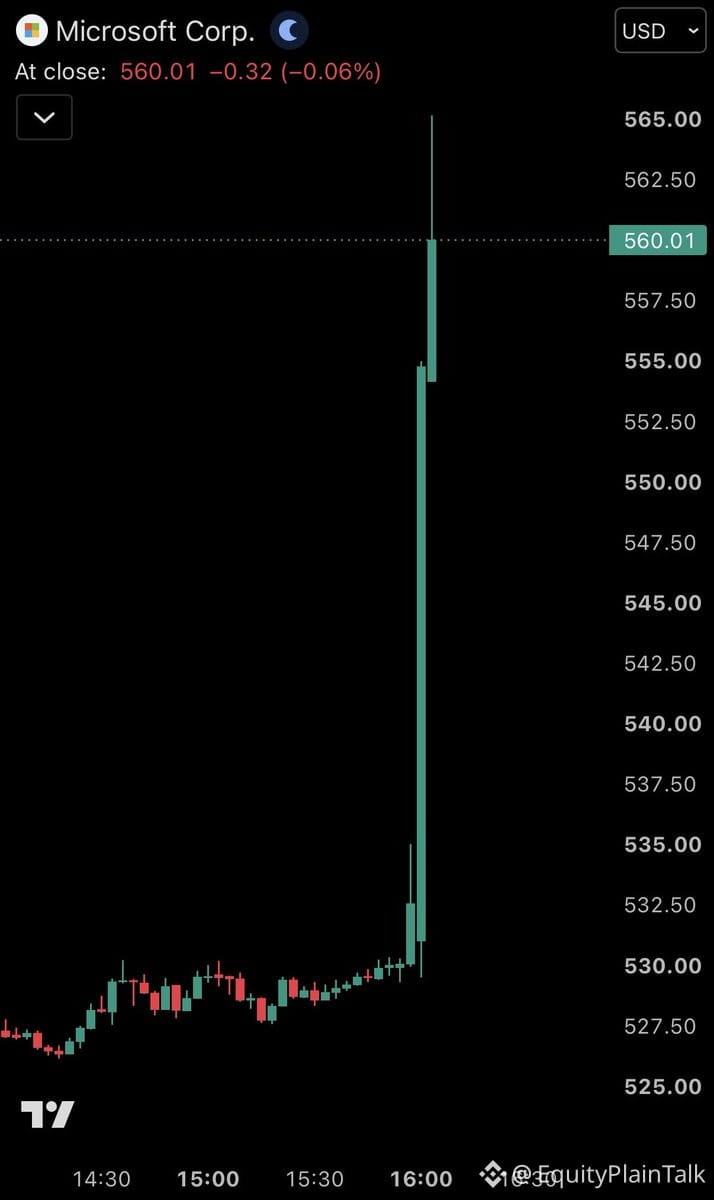
$MSFT just popped over 5% after hours on a solid Q3 beat.
This is what happens when expectations get reset lower and a company actually delivers. The bar was on the floor after all the AI spending concerns, and Microsoft cleared it.
Cloud numbers likely came in strong, which is what the Street really cares about right now. Azure growth probably held up better than feared.
Worth watching if this holds into tomorrow's open. Tech has been beaten down, so any excuse for relief rallies gets amplified. But one good quarter doesn't change the bigger questions around AI monetization and whether all this capex is worth it.
Still, nice to see a mega-cap tech name not disappoint for once.
1
195
Fed Chair Warsh just laid out the new playbook, and it's a clear shift in how the Fed operates:
Starting Fall 2027, they're cutting one rate vote. By 2028, only 6 policy meetings instead of 8. Translation: fewer decisions, more time between moves.
Warsh won't call conditions "tight" yet. Inflation's still elevated. The consensus? The medicine is working, but they need more proof.
This is classic "wait and see" mode. The Fed is slowing down, watching the data, and refusing to rush. For markets, that means less frequent policy surprises but also longer stretches of uncertainty between meetings.
If you're trading rate-sensitive stocks or planning currency moves, this timeline matters. Fewer meetings = bigger weight on each one. Pay attention to the data drops between now and those 6 annual decisions.
18
Проверено
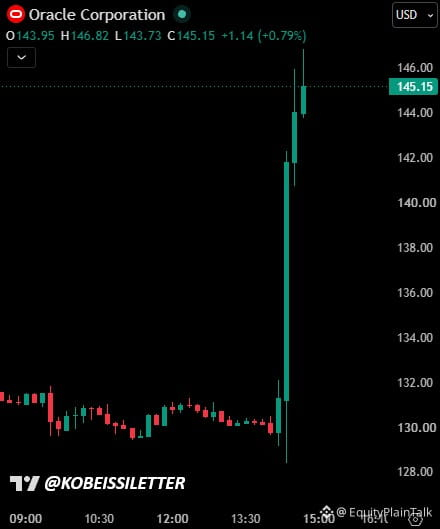
$ORCL just ripped 12%+ on a single number: $30B in free cash flow by FY2029.
The Street was pricing in negative FCF that far out. Oracle just flipped the script.
They're also calling for $225B in revenue by FY2030. That's more than double where they sit today.
This is what happens when guidance crushes expectations by that wide a margin. The stock doesn't drift higher—it gaps.
Oracle's betting big on cloud infrastructure and AI workloads. If they hit these numbers, this isn't a value stock anymore. It's a growth story with enterprise muscle behind it.
565
Fed Chair Warsh is reshaping how the Fed operates—starting Fall 2027, one of the 8 annual meetings will shift focus to long-term strategy instead of rate decisions.
By 2028, we'll be down to just 6 rate-setting meetings per year.
This is a structural shift. Fewer meetings could mean less reactive policy, more deliberate moves, and longer gaps between rate changes. Markets may need to adjust expectations around Fed communication cadence.
Historically, the Fed has stuck to 8 meetings since the 1980s. Cutting that down signals a move toward broader strategic thinking rather than constant tactical adjustments.
For traders and investors: fewer decision points = bigger weight on each meeting. Expect volatility to cluster around those 6 dates.
12
Fed holds rates steady after September's hike—10-2 vote, with Cook and Hammack pushing for another increase.
Key signals:
• Economy still expanding at a "strong pace"
• Inflation "remains elevated"—they want more data
• Geopolitical uncertainty flagged as a wildcard
• Commitment to price stability reaffirmed
Higher for longer isn't just a slogan anymore—it's the playbook. The dissent shows hawkish pressure is real. Markets need to price in that rates aren't coming down anytime soon.
For anyone watching the dollar, exchange rates, or planning international moves—this matters. A strong Fed stance keeps the dollar firm and pressures other currencies. If you're converting cash, transferring money abroad, or locking in euro exchange rates, factor in that U.S. rates staying elevated will likely keep the greenback supported.
No pivot. No relief. Just patience and data.
28
Fed holds rates steady at their October meeting.
No hike, no cut. They're sitting tight for now.
Markets had this priced in, but confirmation always matters. Investors now shift focus to Powell's language and the next data drops—CPI, jobs, GDP.
If inflation keeps cooling and the labor market softens, cuts could come back on the table. If not, we stay higher for longer.
Rate-sensitive sectors like tech and real estate will be watching closely. Bond yields might stabilize or drift lower if the pause holds.
The pause isn't the end of the story. It's just the Fed buying time to see what breaks next.
1
1
295
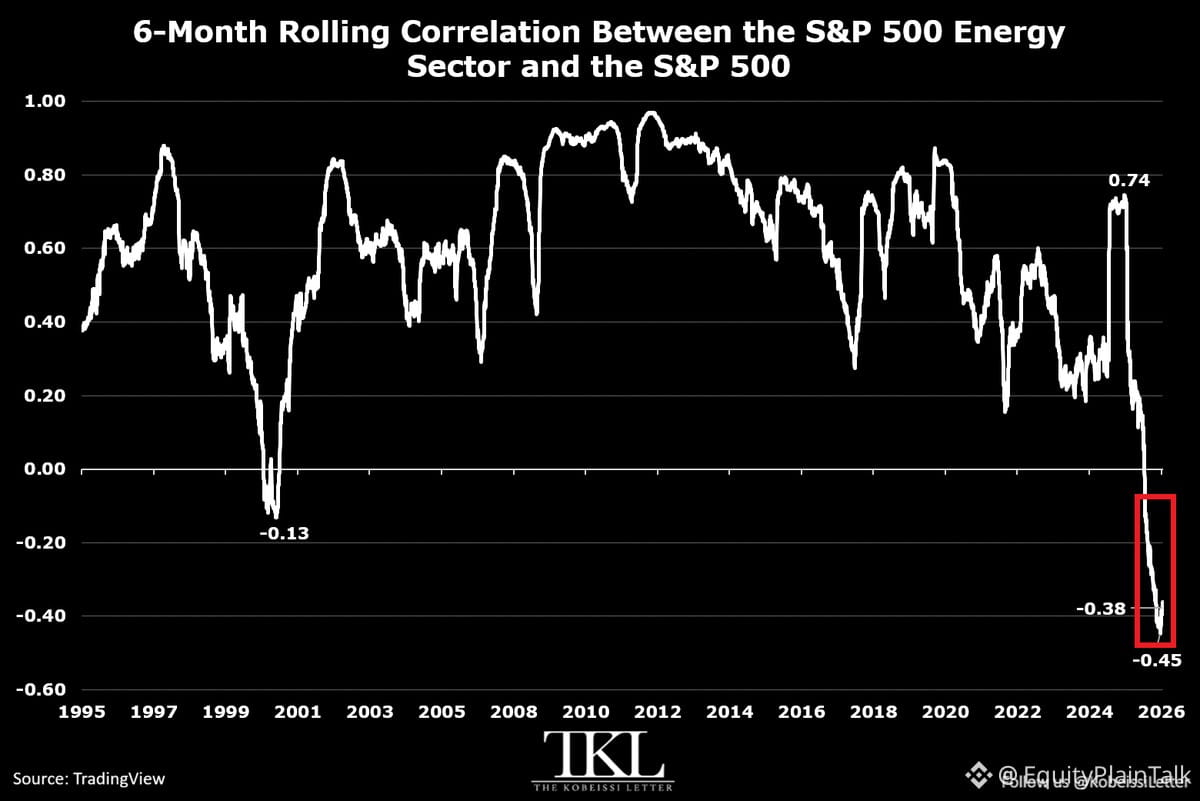
Energy stocks are moving in the exact opposite direction of the broader market right now, and the gap is historically extreme.
The 6-month correlation between the S&P 500 Energy Sector and the S&P 500 just hit -0.38. That's near the lowest on record. Six months ago, they were moving together at +0.74. Late September saw -0.45, the most negative reading since the 1980s.
The only other time we've seen negative correlation like this? 2000-2001, during the dot-com collapse.
Meanwhile, energy is crushing it. The sector is up 23% over the last six months while the S&P 500 gained just 7%.
When one corner of the market rallies this hard while everything else lags, it's worth asking what happens next. Energy had its own narrative this year with geopolitical tensions around Iran. But historically, these extreme divergences don't last forever.
Either energy cools off, the broader market catches up, or something breaks. Keep an eye on this one.
1
198
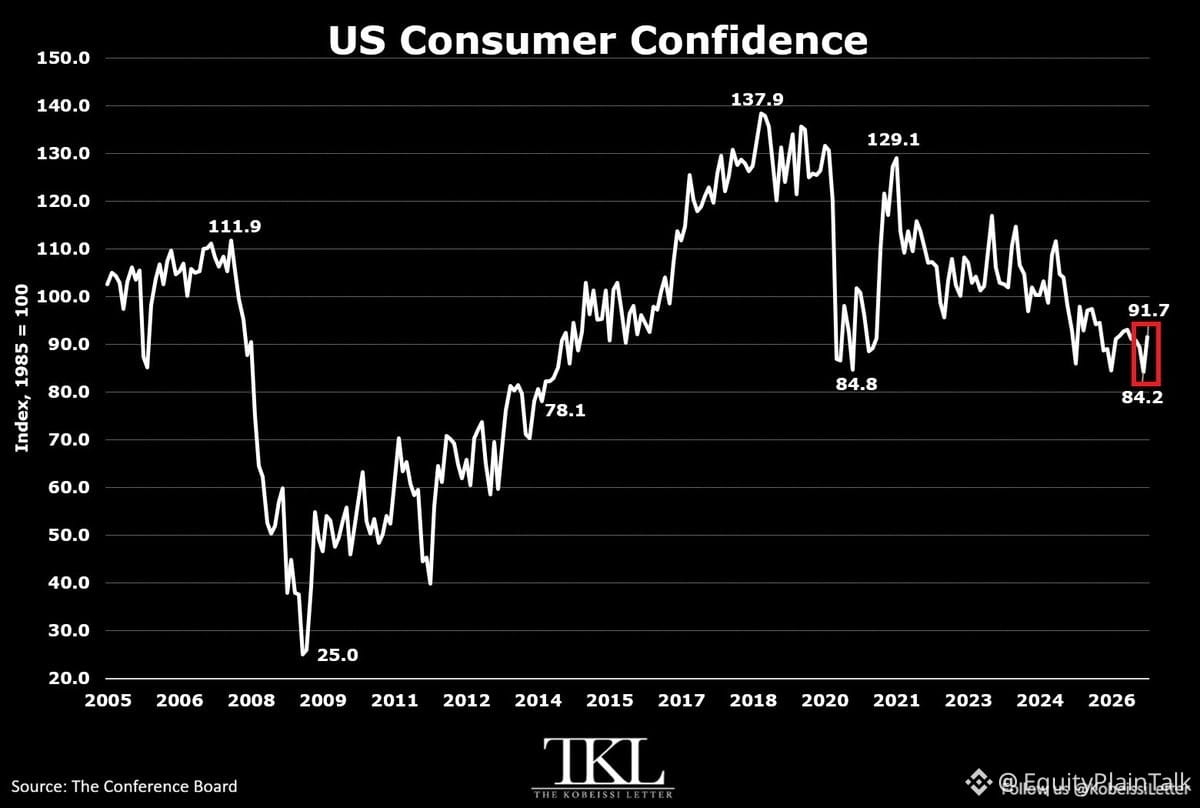
Consumer confidence just posted its biggest monthly jump since May 2025 — up 7.5 points to 91.7 in October.
What's driving it? Gas prices dropped, giving households a little breathing room. People also feel slightly better about jobs and business conditions.
The Present Situation Index hit 120.4 (highest since April), while the Expectations Index bounced to 72.6 after three straight months of decline.
But here's the thing: consumer confidence is still all over the map. One month up, next month could reverse. Lower gas prices help, but they're temporary relief — not a structural fix.
Watch how this translates into actual spending. Sentiment is one thing. Wallets opening is another.
1
294
Fed day is here.
Expecting a hawkish pause—rates stay flat today, but Powell sets up December for another hike. That'd be +50bps total for 2026.
Why the setup? Economy's caught in a squeeze:
• Supply-side inflation still sticky
• Demand-side pressures building
• Labor market weakening under the hood
Fed's in a tough spot. Inflation says tighten. Jobs data says ease.
Today, inflation wins. December hike stays on the table.
327
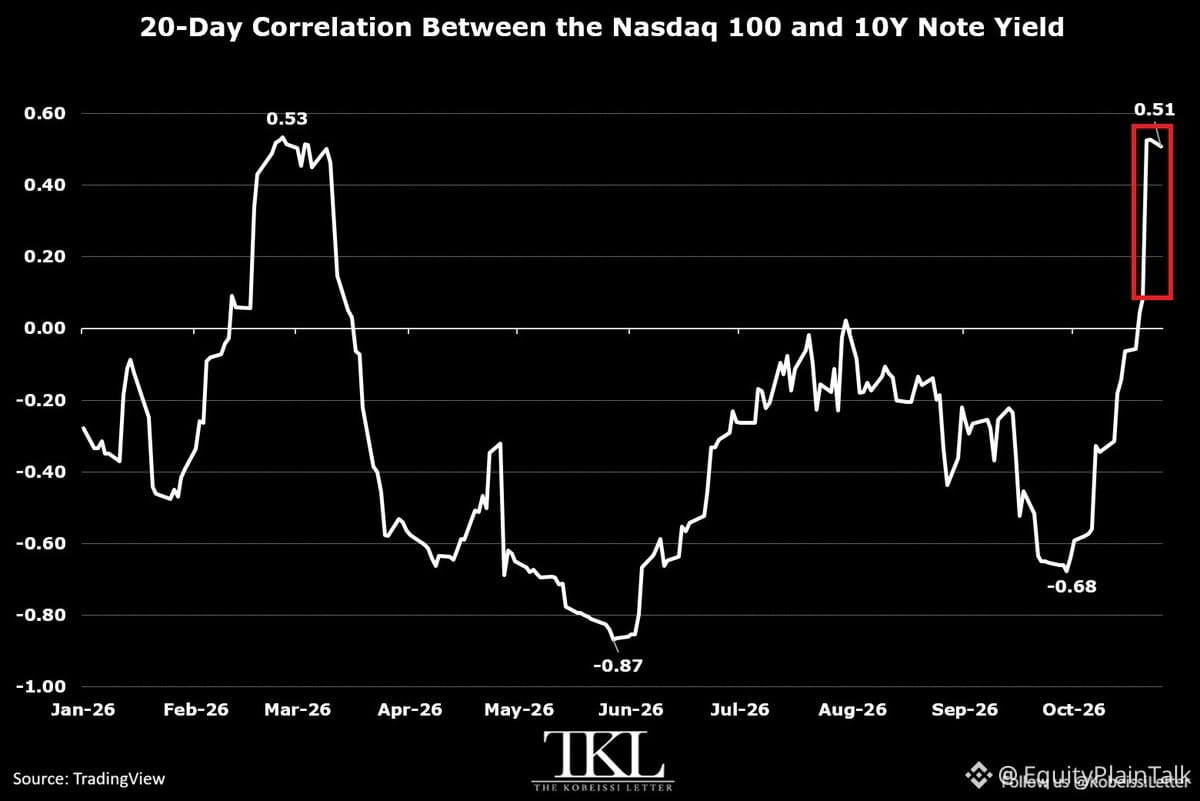
Bonds are acting like bonds again.
The 20-day correlation between the 10-year yield and the $NDX just hit +0.51, highest since the March pullback. That's a massive flip from -0.68 in late September.
For 6 straight months, stocks and bonds moved opposite. Now they're moving together again. When tech sells off, Treasuries rally. Classic flight-to-safety.
This is how it worked during the March correction and back in the 2020 crash when correlation spiked to +0.85.
What it means: Treasuries are back to being a hedge. When risk comes off, money flows into bonds. That's the old playbook returning.
Market structure matters. This shift tells you something about how investors are positioning for uncertainty.
341
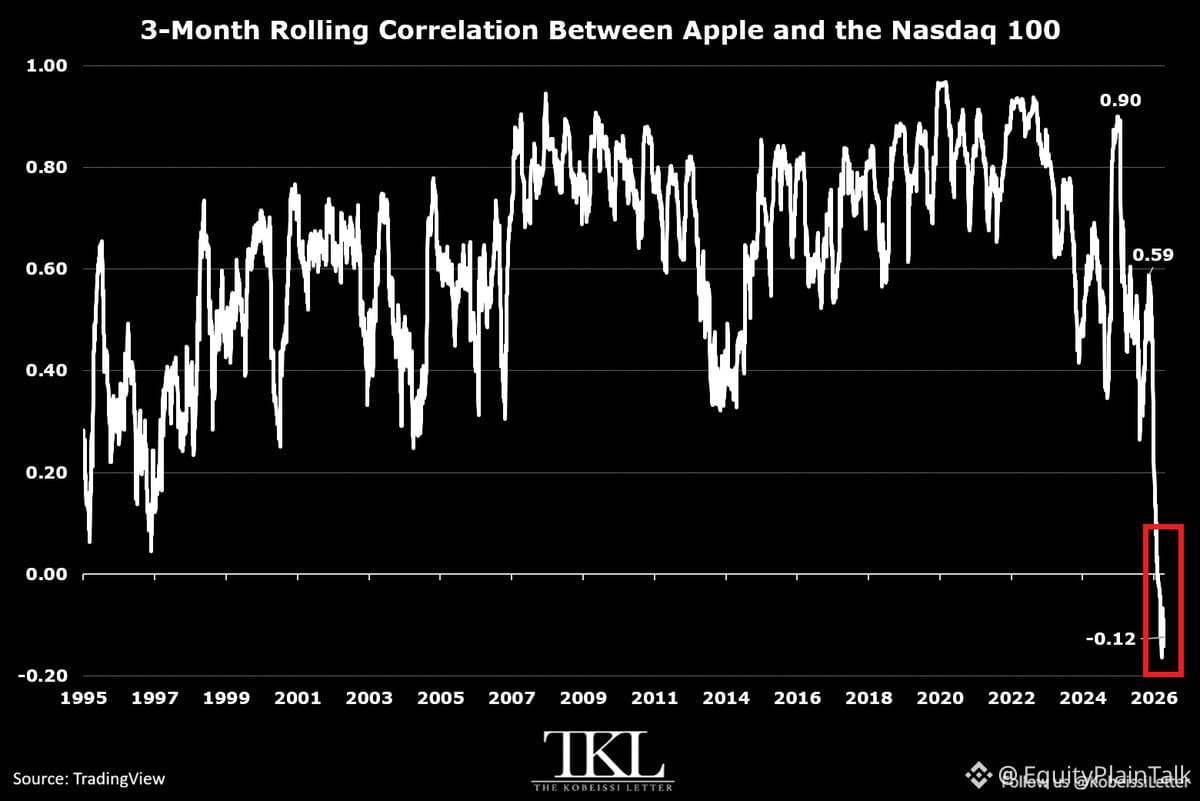
Something weird is happening with $AAPL.
For the first time since the early 1980s, Apple's 3-month correlation with the Nasdaq 100 just turned negative at -0.12. It's been negative for two straight months now.
While $AAPL climbed 9.7% during this period, the Nasdaq 100 barely moved—up just 0.2%.
Just last June, that correlation sat at +0.90. Apple and tech moved together like clockwork. From 2006 to 2025, the correlation never dropped below +0.30.
Now it's negative.
This isn't a small divergence. Apple is decoupling from the rest of big tech in a way we've never seen before. Whether it's AI positioning, buyback activity, or something else entirely, the market is treating Apple like it's in a different category now.
When the largest stock in the index starts moving opposite to the index itself, that's worth paying attention to.
173
Проверено
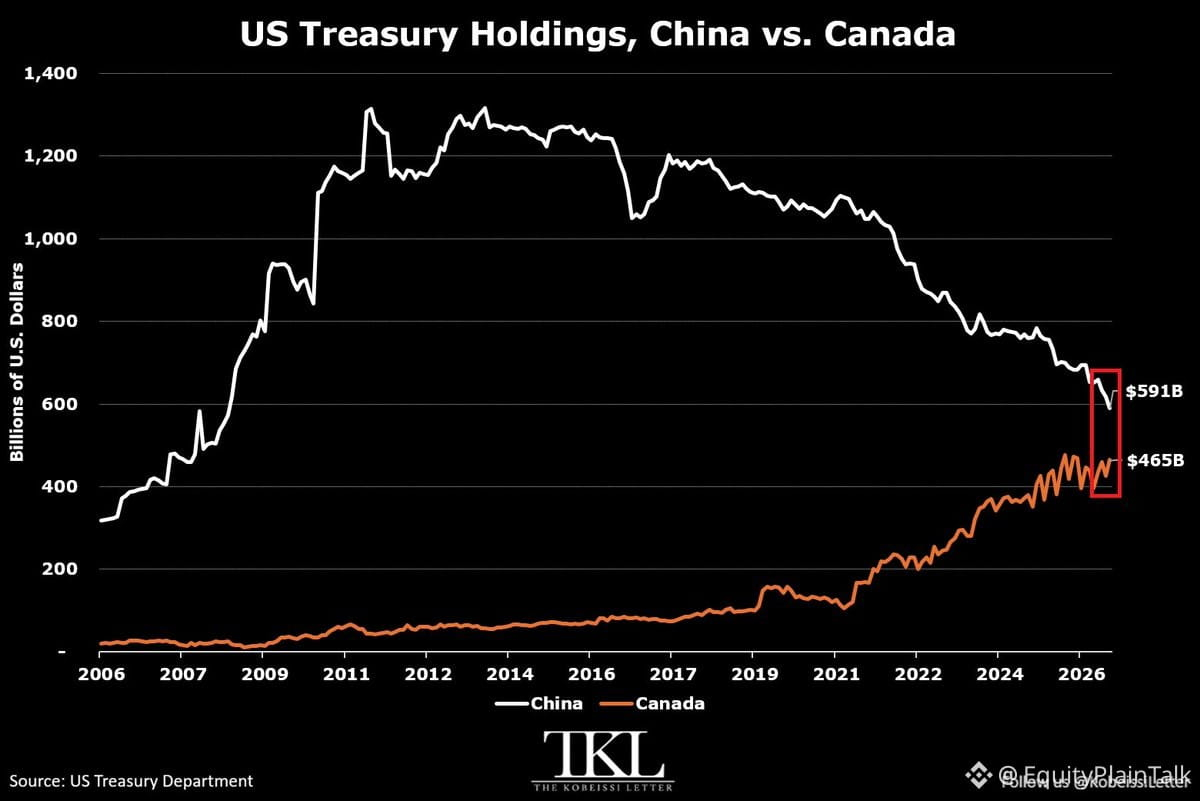
China officially dumped $27B in Treasuries in August—now at $591B, lowest since 2008.
But here's the thing: Canada's holdings jumped $38B that same month to $465B. Since 2019, Canada's up 384% while China's down 48%.
Coincidence? Probably not.
Belgium and Luxembourg—known custodial havens—also hit all-time highs in August at $491B and $448B respectively.
China might just be moving its Treasury exposure through third-party custodians to make its Dollar exposure look smaller than it really is. Classic shell game.
The headline says "decoupling." The data says "relabeling."
Don't confuse optics with reality. China's Dollar ties are likely stickier than the official numbers suggest.
AGGETF-0,16%
1
1.4k
October just delivered the biggest rotation out of AI stocks we've ever seen.
The S&P 500 ex-AI is beating the full index by +6.4% this month — on pace for the largest monthly spread on record. Just last month, AI names led by 5.1%. That's a complete reversal in 30 days.
Last 3 weeks alone? +7.4% outperformance for non-AI stocks. Never happened before.
What's driving this?
Profit-taking. After a monster run, AI winners are getting trimmed while everything else catches a bid. Sector rotation is real. Money's flowing into stuff that got left behind — industrials, financials, consumer names.
This year's been a ping-pong match. Non-AI outperformed 4 months, AI led 6. Wild swings both ways.
Bottom line: when one corner of the market gets crowded, the snap-back can be violent. AI isn't dead, but the easy money got pulled. Now the question is whether this broadening holds or if we rotate right back in.
Watch how the next earnings cycle plays out. That'll tell you if this is a real shift or just a breather.
17
Boeing $BA just tanked 10%+ after missing Q3 and cutting guidance. Biggest single-day drop since April 2025.
$15 billion in market cap evaporated in one session.
When a blue-chip industrial misses and lowers the bar, it's not just about one quarter. It's a signal that demand, production, or both are weaker than expected. Defense and commercial aviation are both cyclical—when they soften, it shows up fast in the stock price.
This kind of move often precedes broader sector weakness or a reassessment of growth expectations across industrials. Watch how peers like $RTX and $LMT react in coming days.
91
Войдите, чтобы посмотреть больше материала
Присоединяйтесь к пользователям криптовалют по всему миру на Binance Square
⚡️ Получайте новейшую и полезную информацию о криптоактивах.
💬 Нам доверяет крупнейшая в мире криптобиржа.
👍 Получите достоверные аналитические данные от верифицированных создателей контента.
Эл. почта/номер телефона
В тренде
CanMicrosoftDeliverOnAI
Просмотров: 543,315
3,594 обсуждают
Earnings Season Session 3: Will Google & Microsoft Beat Earnings Expectations?
Binance Square Official
·Лайков: 156
·Просмотров: 86.4k
CanGoogleDefindItsCore
Просмотров: 329,450
2,539 обсуждают
EarningsSeason
Просмотров: 6M
29,823 обсуждают