

Huutruong
10.4k Публикации

Huutruong
Отправить жалобу
Заблокировать пользователя
💰 Theo dõi Crypto | Tìm kiếm cơ hội mỗi ngày ( KITE-277880 )
Открытая сделка
Трейдер с частыми сделками
5.5 г
3.6K+ подписок(и/а)
2.4K+ подписчиков(а)
846 понравилось
Посты
Портфель
Все
Цитирования
Видео
Активно
·
--
Падение
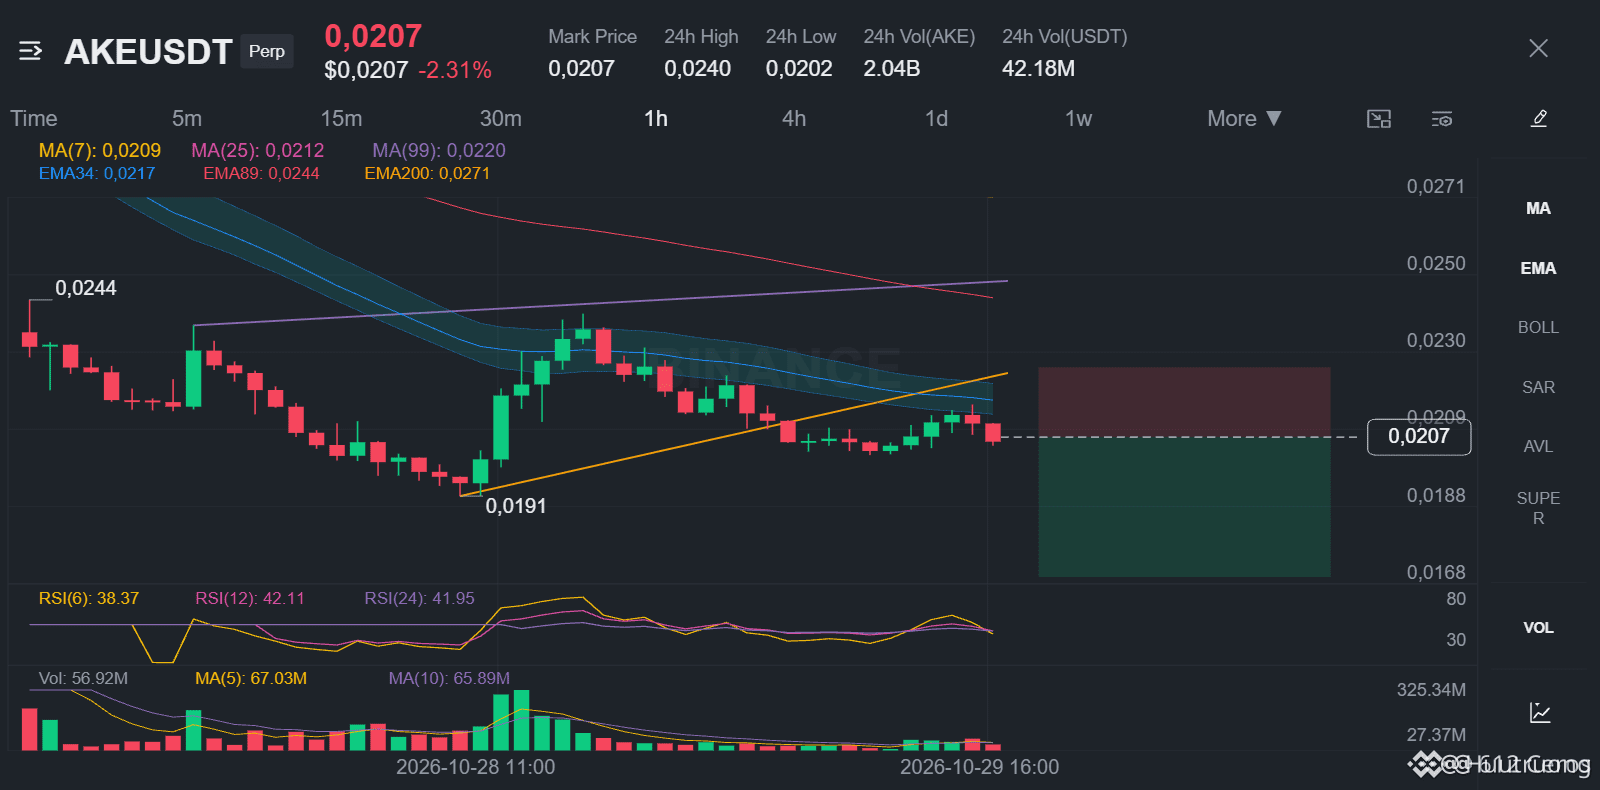
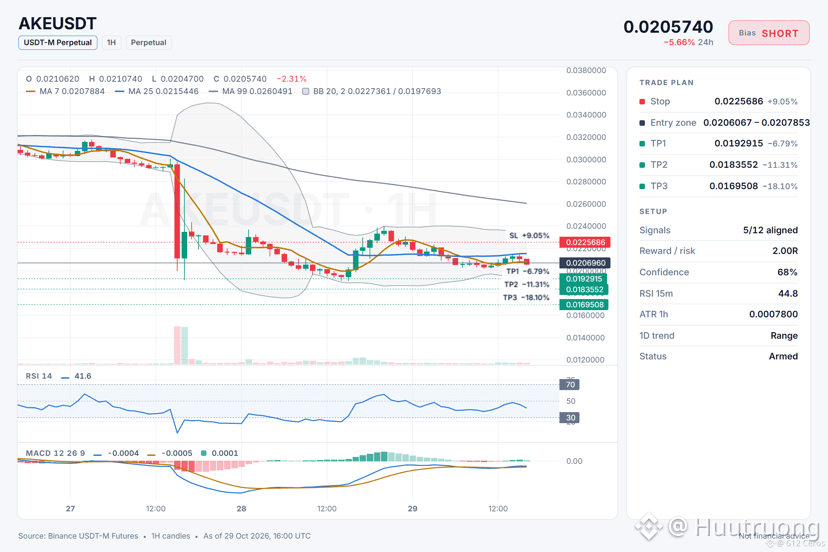
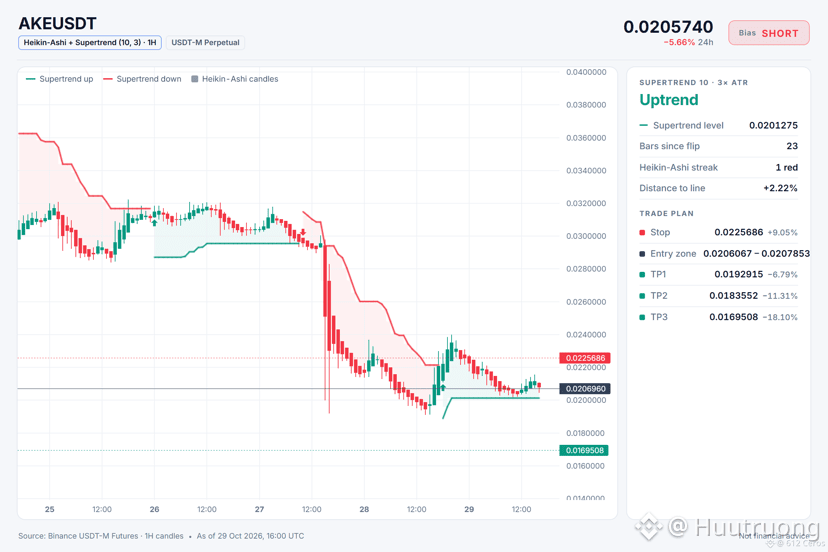
Can AKE flip its 4h bearish stack now?
🔴 SHORT $AKE /USDT: expecting price to go DOWN
Bias: SHORT · Leaning
Entry: 0.0206067 – 0.0207853
TP1: 0.0192915 (-6.8%)
TP2: 0.0183552 (-11.3%)
TP3: 0.0169508 (-18.1%)
SL: 0.0225686 (+9.0%)
Plan: enter only inside the zone, close 50% at TP1, 25% at TP2, 25% at TP3, and move the stop to entry after TP1.
Note: moderate conviction only, keep size light.
Why SHORT? AKE checklist: 5/12 agree, 0 against.
• 4h trend down (below EMA50 & EMA200)
• 1h trend down (below EMA50 & EMA200)
• Sellers have the momentum (4h RSI 37.2)
Watch: The idea is wrong if price reaches the stop at 0.0225686
Bottom line: The 4h bearish stack (price below EMA50 below EMA200) and 1h bearish stack both mean the trend is down, but the daily trend is range-bound and ADX shows no clear direction, so conviction stays moderate.
Would you short here or wait for a lower entry?
{future}(AKEUSDT)
Can AKE flip its 4h bearish stack now?
🔴 SHORT $AKE /USDT: expecting price to go DOWN
Bias: SHORT · Leaning
Entry: 0.0206067 – 0.0207853
TP1: 0.0192915 (-6.8%)
TP2: 0.0183552 (-11.3%)
TP3: 0.0169508 (-18.1%)
SL: 0.0225686 (+9.0%)
Plan: enter only inside the zone, close 50% at TP1, 25% at TP2, 25% at TP3, and move the stop to entry after TP1.
Note: moderate conviction only, keep size light.
Why SHORT? AKE checklist: 5/12 agree, 0 against.
• 4h trend down (below EMA50 & EMA200)
• 1h trend down (below EMA50 & EMA200)
• Sellers have the momentum (4h RSI 37.2)
Watch: The idea is wrong if price reaches the stop at 0.0225686
Bottom line: The 4h bearish stack (price below EMA50 below EMA200) and 1h bearish stack both mean the trend is down, but the daily trend is range-bound and ADX shows no clear direction, so conviction stays moderate.
Would you short here or wait for a lower entry?
18
·
--
Падение
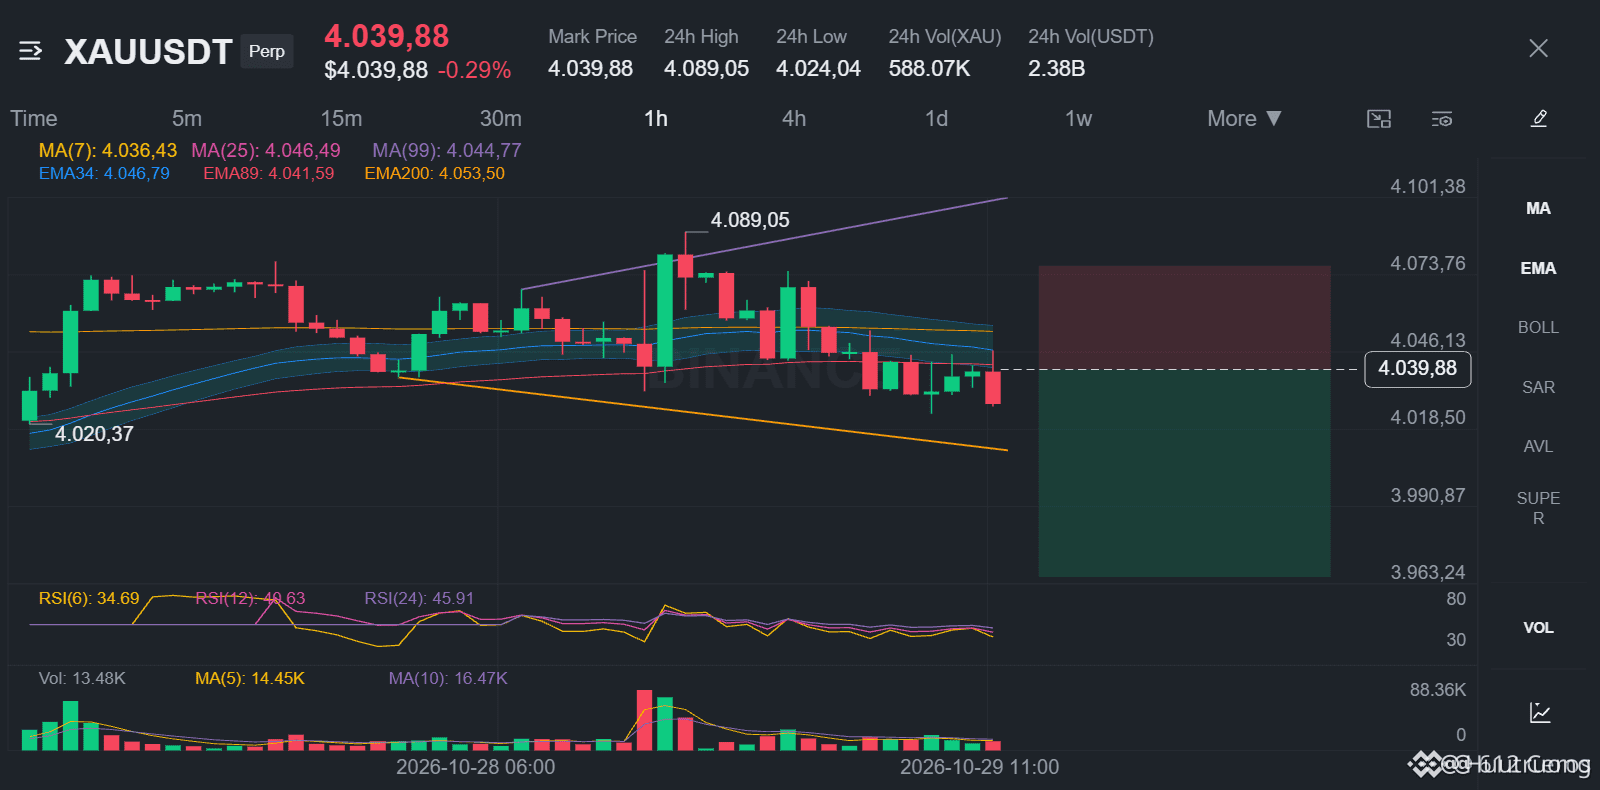
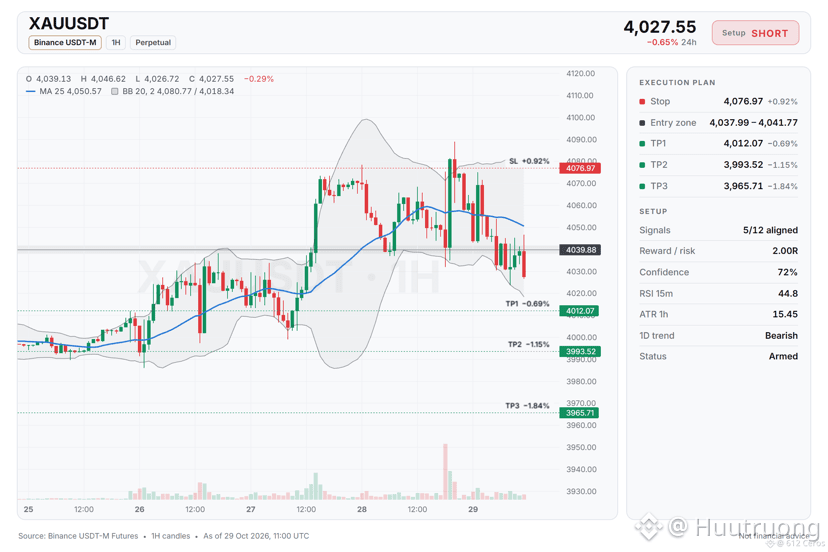
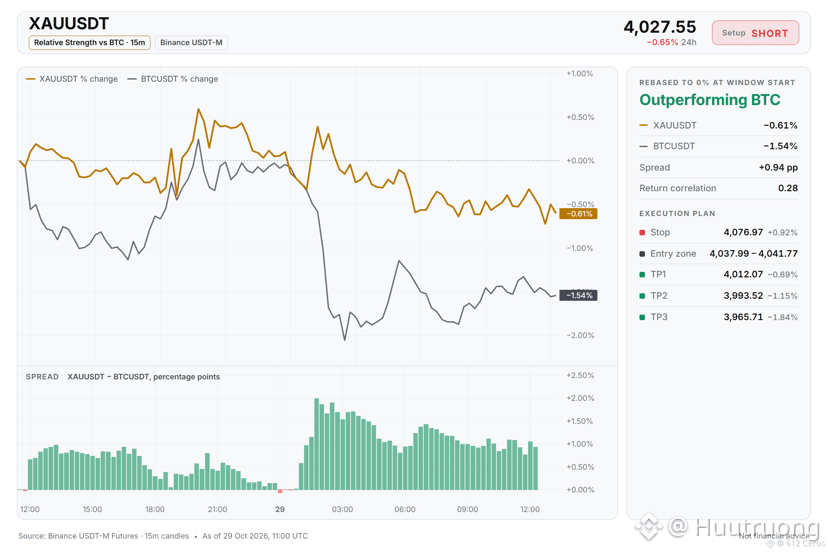
XAU looks ripe for a short here
🔴 SHORT $XAU /USDT: expecting price to go DOWN
Bias: SHORT · Leaning
Entry: 4037.99 – 4041.77
TP1: 4012.07 (-0.7%)
TP2: 3993.52 (-1.1%)
TP3: 3965.71 (-1.8%)
SL: 4076.97 (+0.9%)
Plan: enter only inside the zone, close 50% at TP1, 25% at TP2, 25% at TP3, and move the stop to entry after TP1.
Note: moderate conviction only, keep size light.
Why SHORT? 5/12 signals agree, 0 against.
• Daily trend down (below EMA50 & EMA200)
• 4h trend down (below EMA50 & EMA200)
• 1h trend down (below EMA50 & EMA200)
Plan A:
If price pushes toward 4041.77 and the 4h bearish stack holds, it may roll toward the first target near 4012.07.
Plan B (invalidation):
A break above 4076.97 would prove the short wrong, so I would exit immediately.
Where do you see this failing?
{future}(XAUUSDT)
XAU looks ripe for a short here
🔴 SHORT $XAU /USDT: expecting price to go DOWN
Bias: SHORT · Leaning
Entry: 4037.99 – 4041.77
TP1: 4012.07 (-0.7%)
TP2: 3993.52 (-1.1%)
TP3: 3965.71 (-1.8%)
SL: 4076.97 (+0.9%)
Plan: enter only inside the zone, close 50% at TP1, 25% at TP2, 25% at TP3, and move the stop to entry after TP1.
Note: moderate conviction only, keep size light.
Why SHORT? 5/12 signals agree, 0 against.
• Daily trend down (below EMA50 & EMA200)
• 4h trend down (below EMA50 & EMA200)
• 1h trend down (below EMA50 & EMA200)
Plan A:
If price pushes toward 4041.77 and the 4h bearish stack holds, it may roll toward the first target near 4012.07.
Plan B (invalidation):
A break above 4076.97 would prove the short wrong, so I would exit immediately.
Where do you see this failing?
11
·
--
Падение
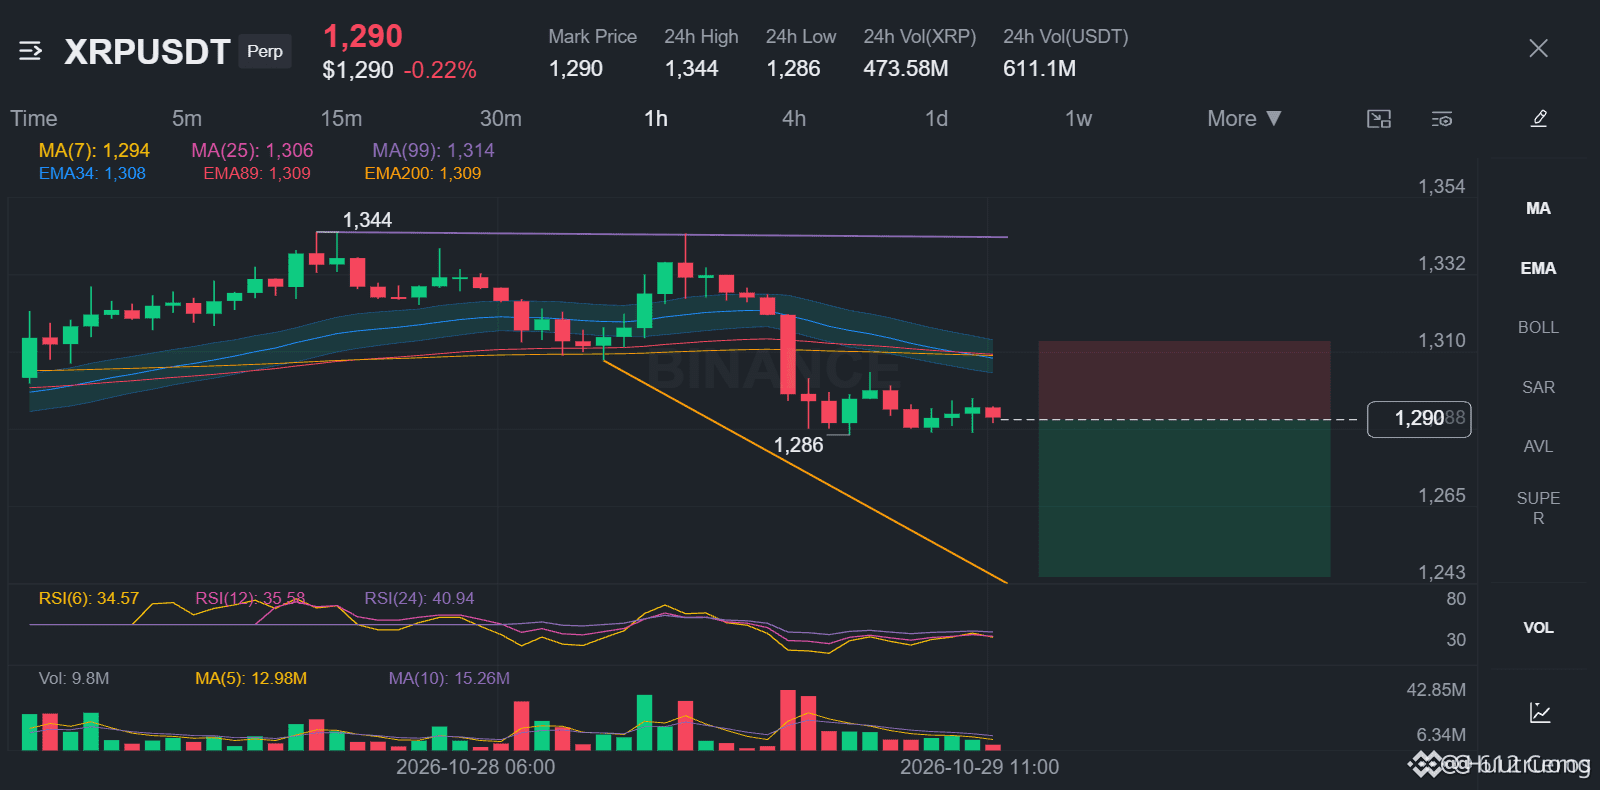
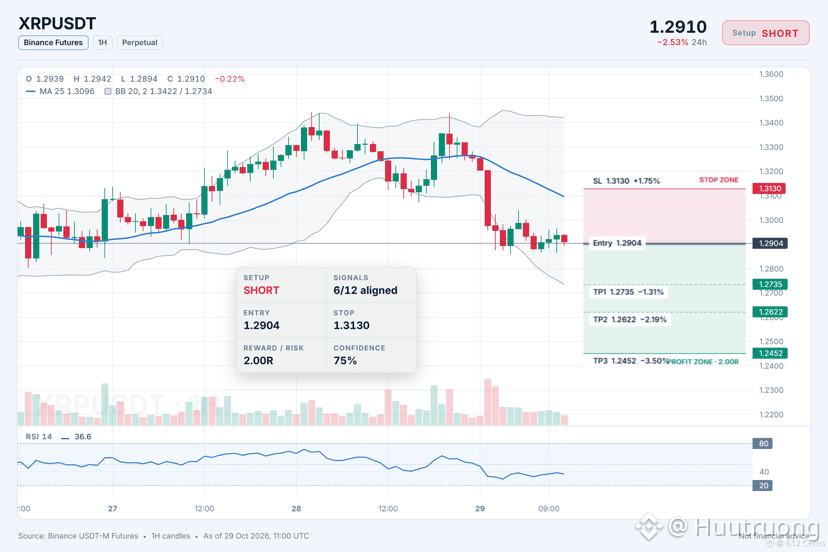
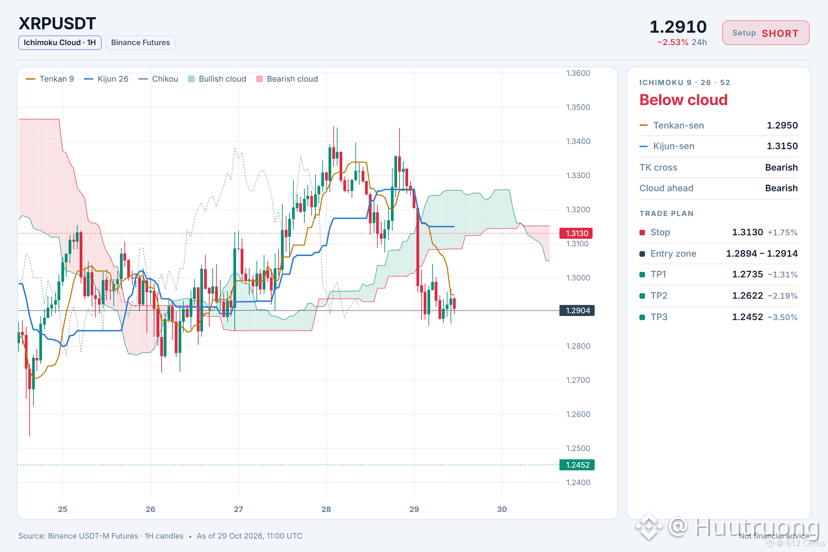
Is XRP sliding into a clear short entry?
🔴 SHORT $XRP /USDT: expecting price to go DOWN
Bias: SHORT · Strong
Entry: 1.2894 – 1.2914
TP1: 1.2735 (-1.3%)
TP2: 1.2622 (-2.2%)
TP3: 1.2452 (-3.5%)
SL: 1.3130 (+1.8%)
Plan: enter only inside the zone, close 50% at TP1, 25% at TP2, 25% at TP3, and move the stop to entry after TP1.
Why SHORT? 6/12 signals agree, 0 against.
• Daily trend down (below EMA50 & EMA200)
• 4h trend down (below EMA50 & EMA200)
• BTC is falling, this coin follows (corr 0.92)
Trade note: XRP
I'm watching XRP because the daily trend and the 4h trend are both bearish, with price below EMA50 and EMA200 on both timeframes. I want to see sellers keep control, and the 4h RSI at 43.1 and the 1h RSI at 36.6 confirm bearish momentum. The daily trend is down and the BTC backdrop is bearish with a correlation of 0.92, so XRP often follows. The main risk is that the 1h trend is mixed, meaning the short-term trend is undecided.
Where do you take profit on a short here?
{spot}(XRPUSDT)
Is XRP sliding into a clear short entry?
🔴 SHORT $XRP /USDT: expecting price to go DOWN
Bias: SHORT · Strong
Entry: 1.2894 – 1.2914
TP1: 1.2735 (-1.3%)
TP2: 1.2622 (-2.2%)
TP3: 1.2452 (-3.5%)
SL: 1.3130 (+1.8%)
Plan: enter only inside the zone, close 50% at TP1, 25% at TP2, 25% at TP3, and move the stop to entry after TP1.
Why SHORT? 6/12 signals agree, 0 against.
• Daily trend down (below EMA50 & EMA200)
• 4h trend down (below EMA50 & EMA200)
• BTC is falling, this coin follows (corr 0.92)
Trade note: XRP
I'm watching XRP because the daily trend and the 4h trend are both bearish, with price below EMA50 and EMA200 on both timeframes. I want to see sellers keep control, and the 4h RSI at 43.1 and the 1h RSI at 36.6 confirm bearish momentum. The daily trend is down and the BTC backdrop is bearish with a correlation of 0.92, so XRP often follows. The main risk is that the 1h trend is mixed, meaning the short-term trend is undecided.
Where do you take profit on a short here?
15
·
--
Падение
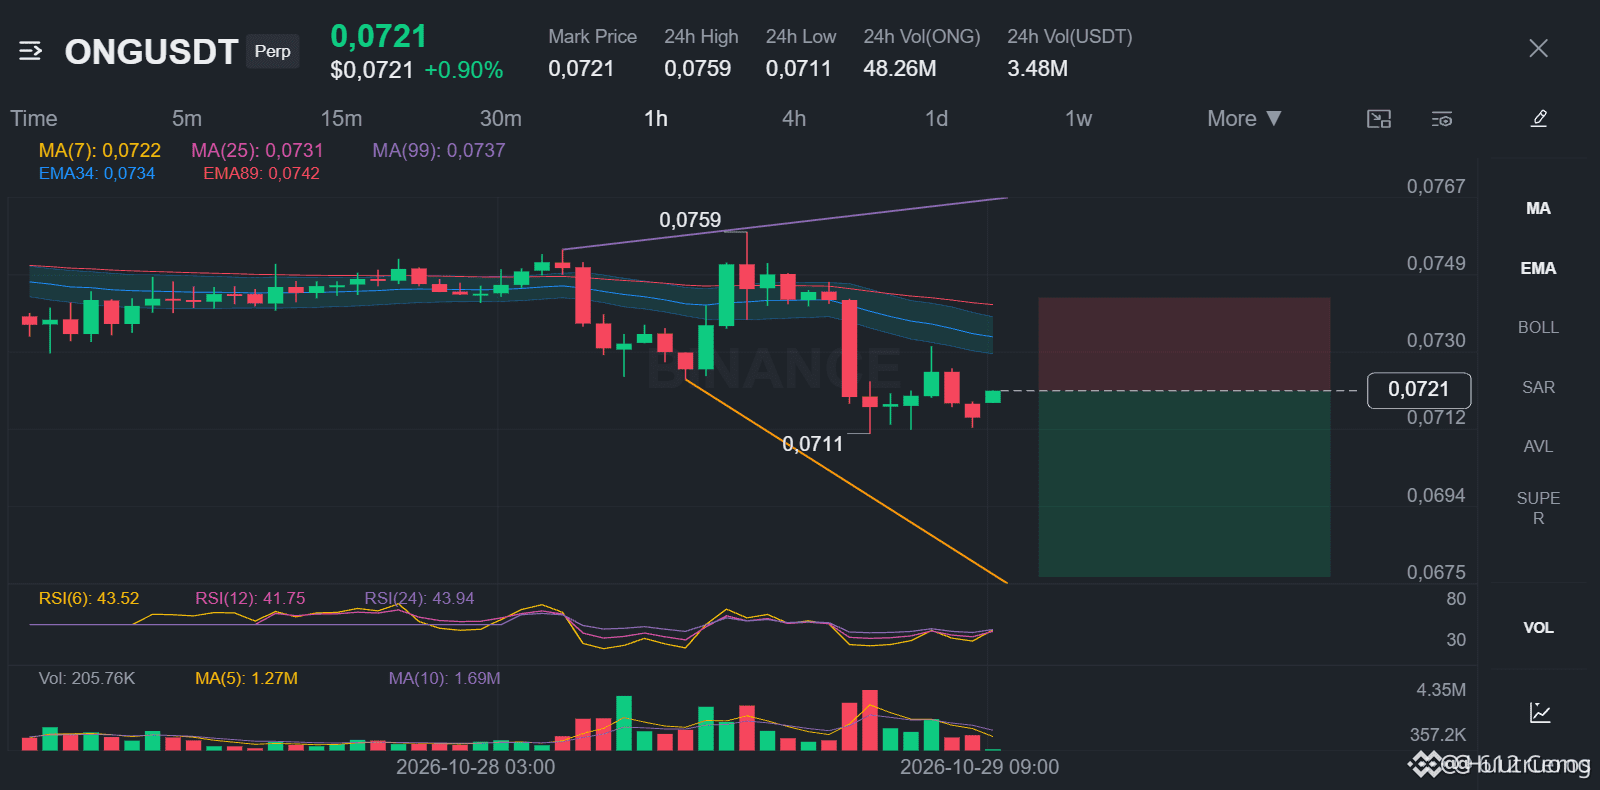
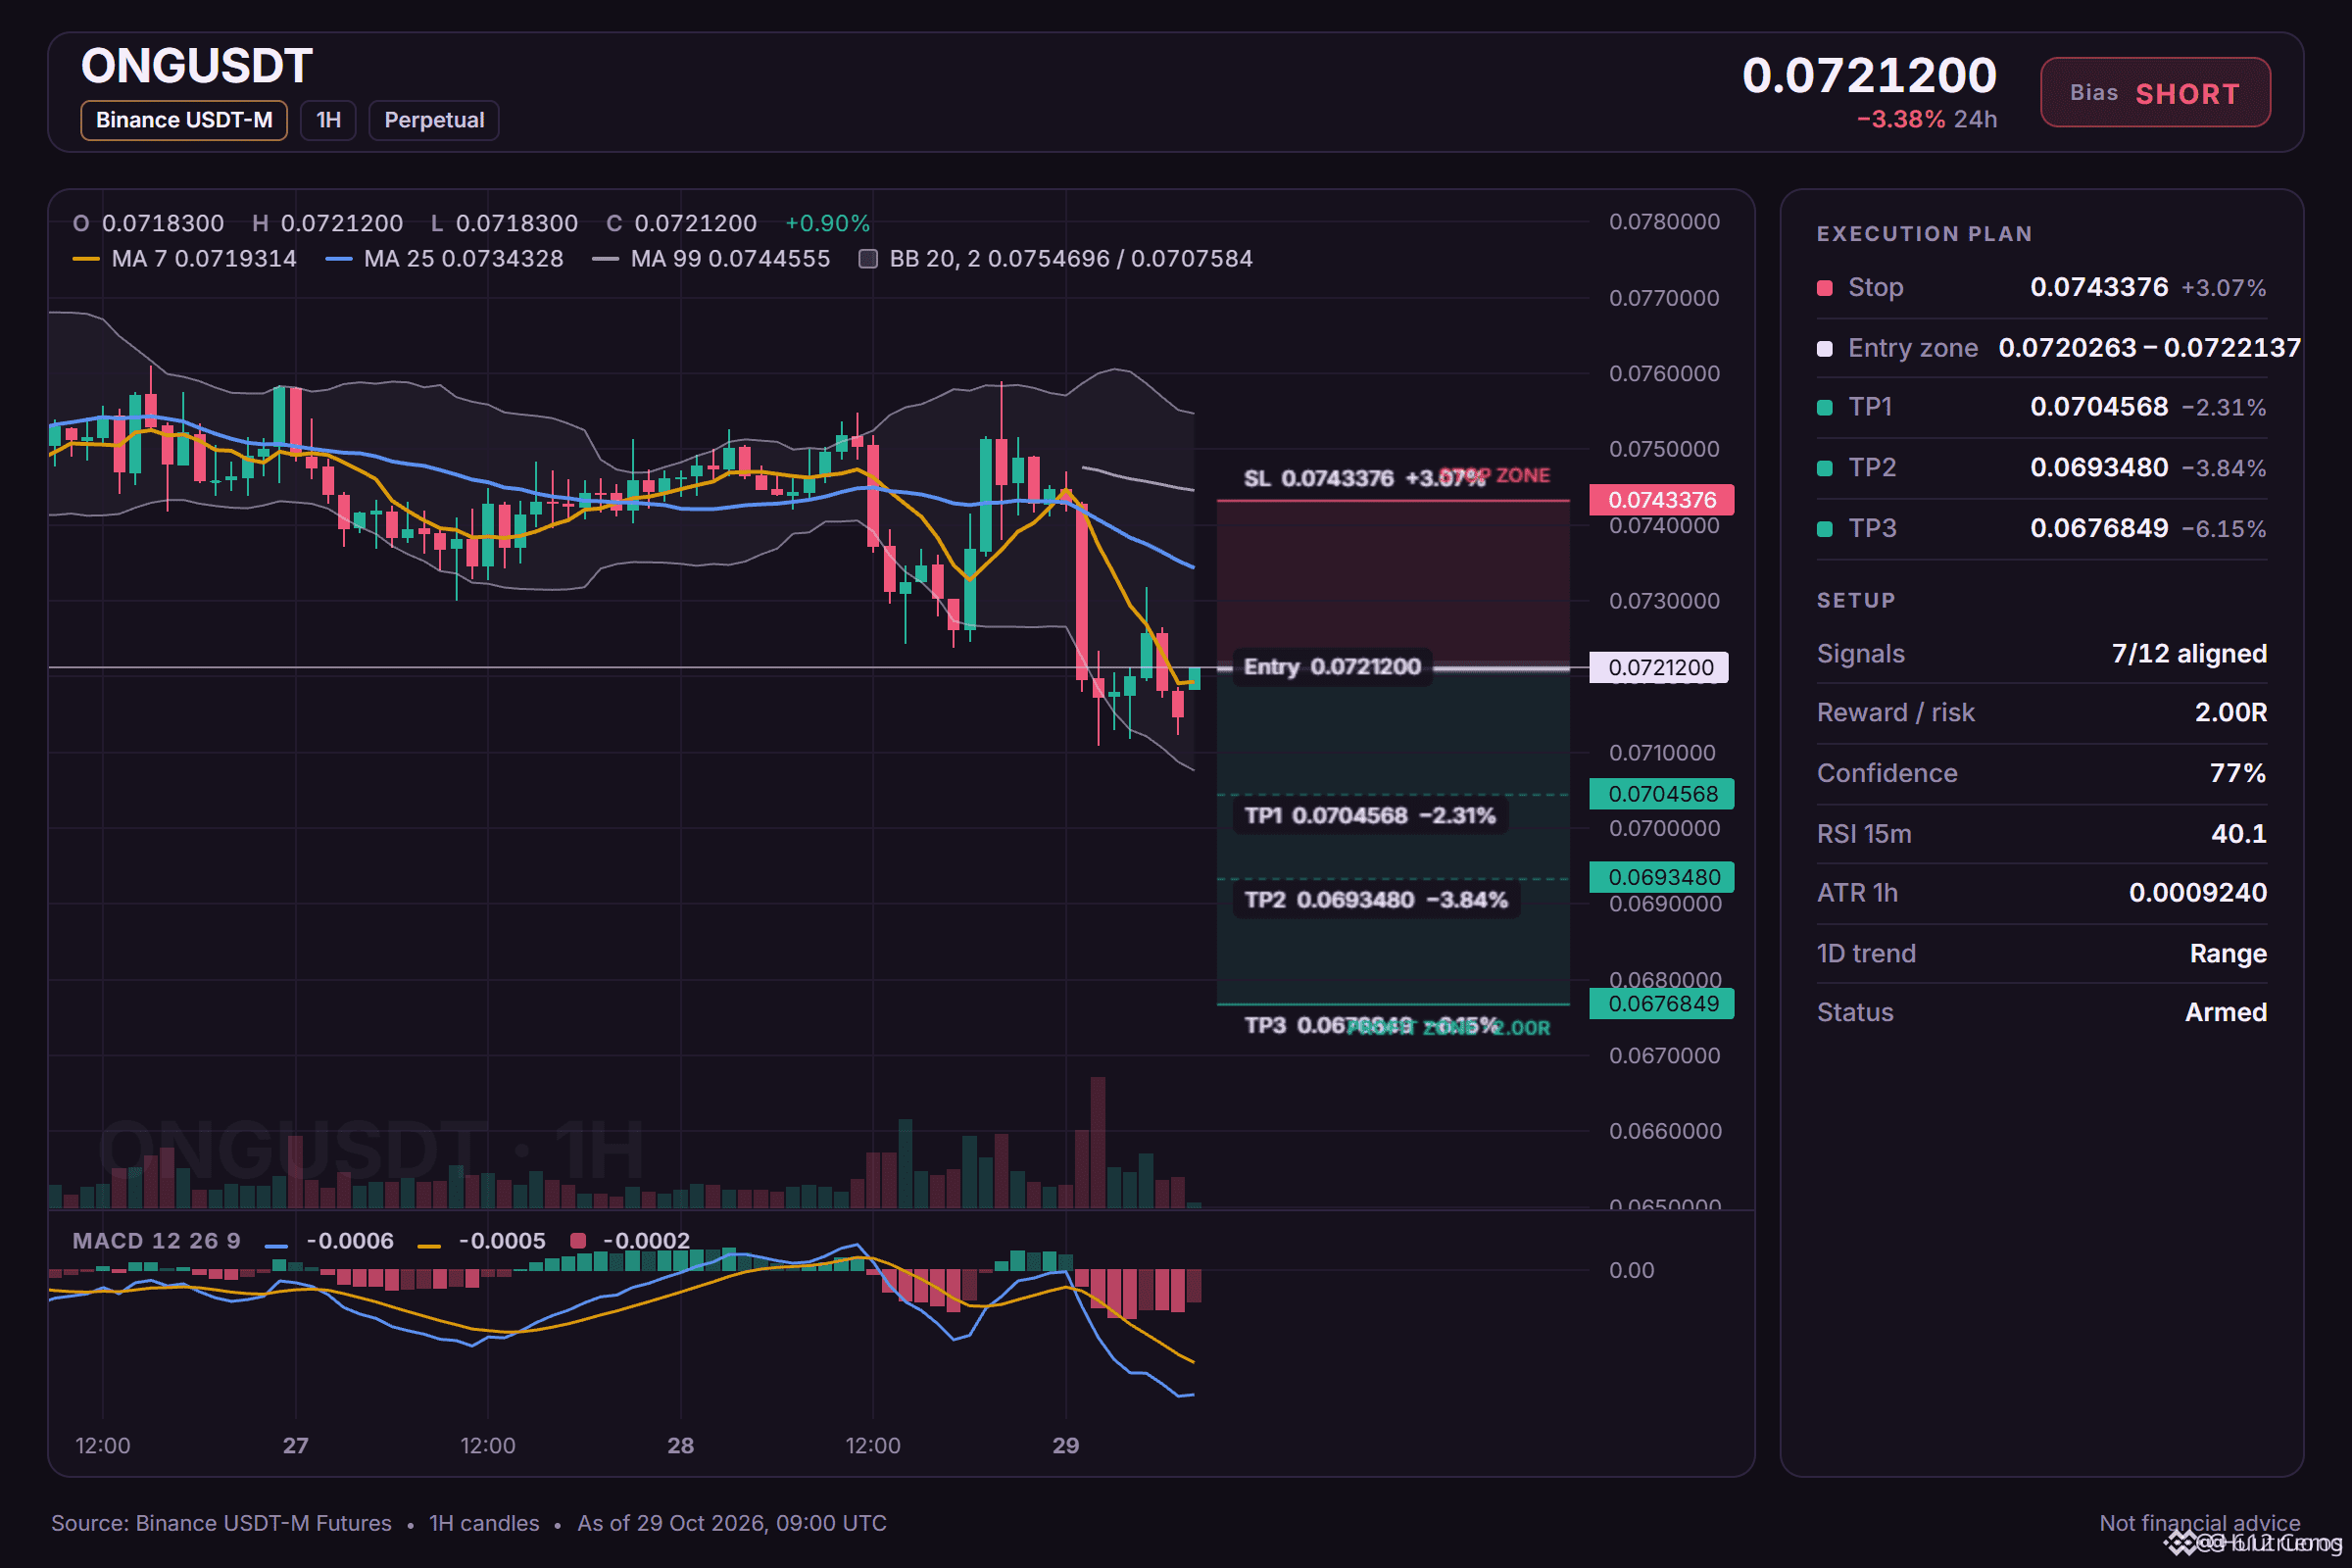
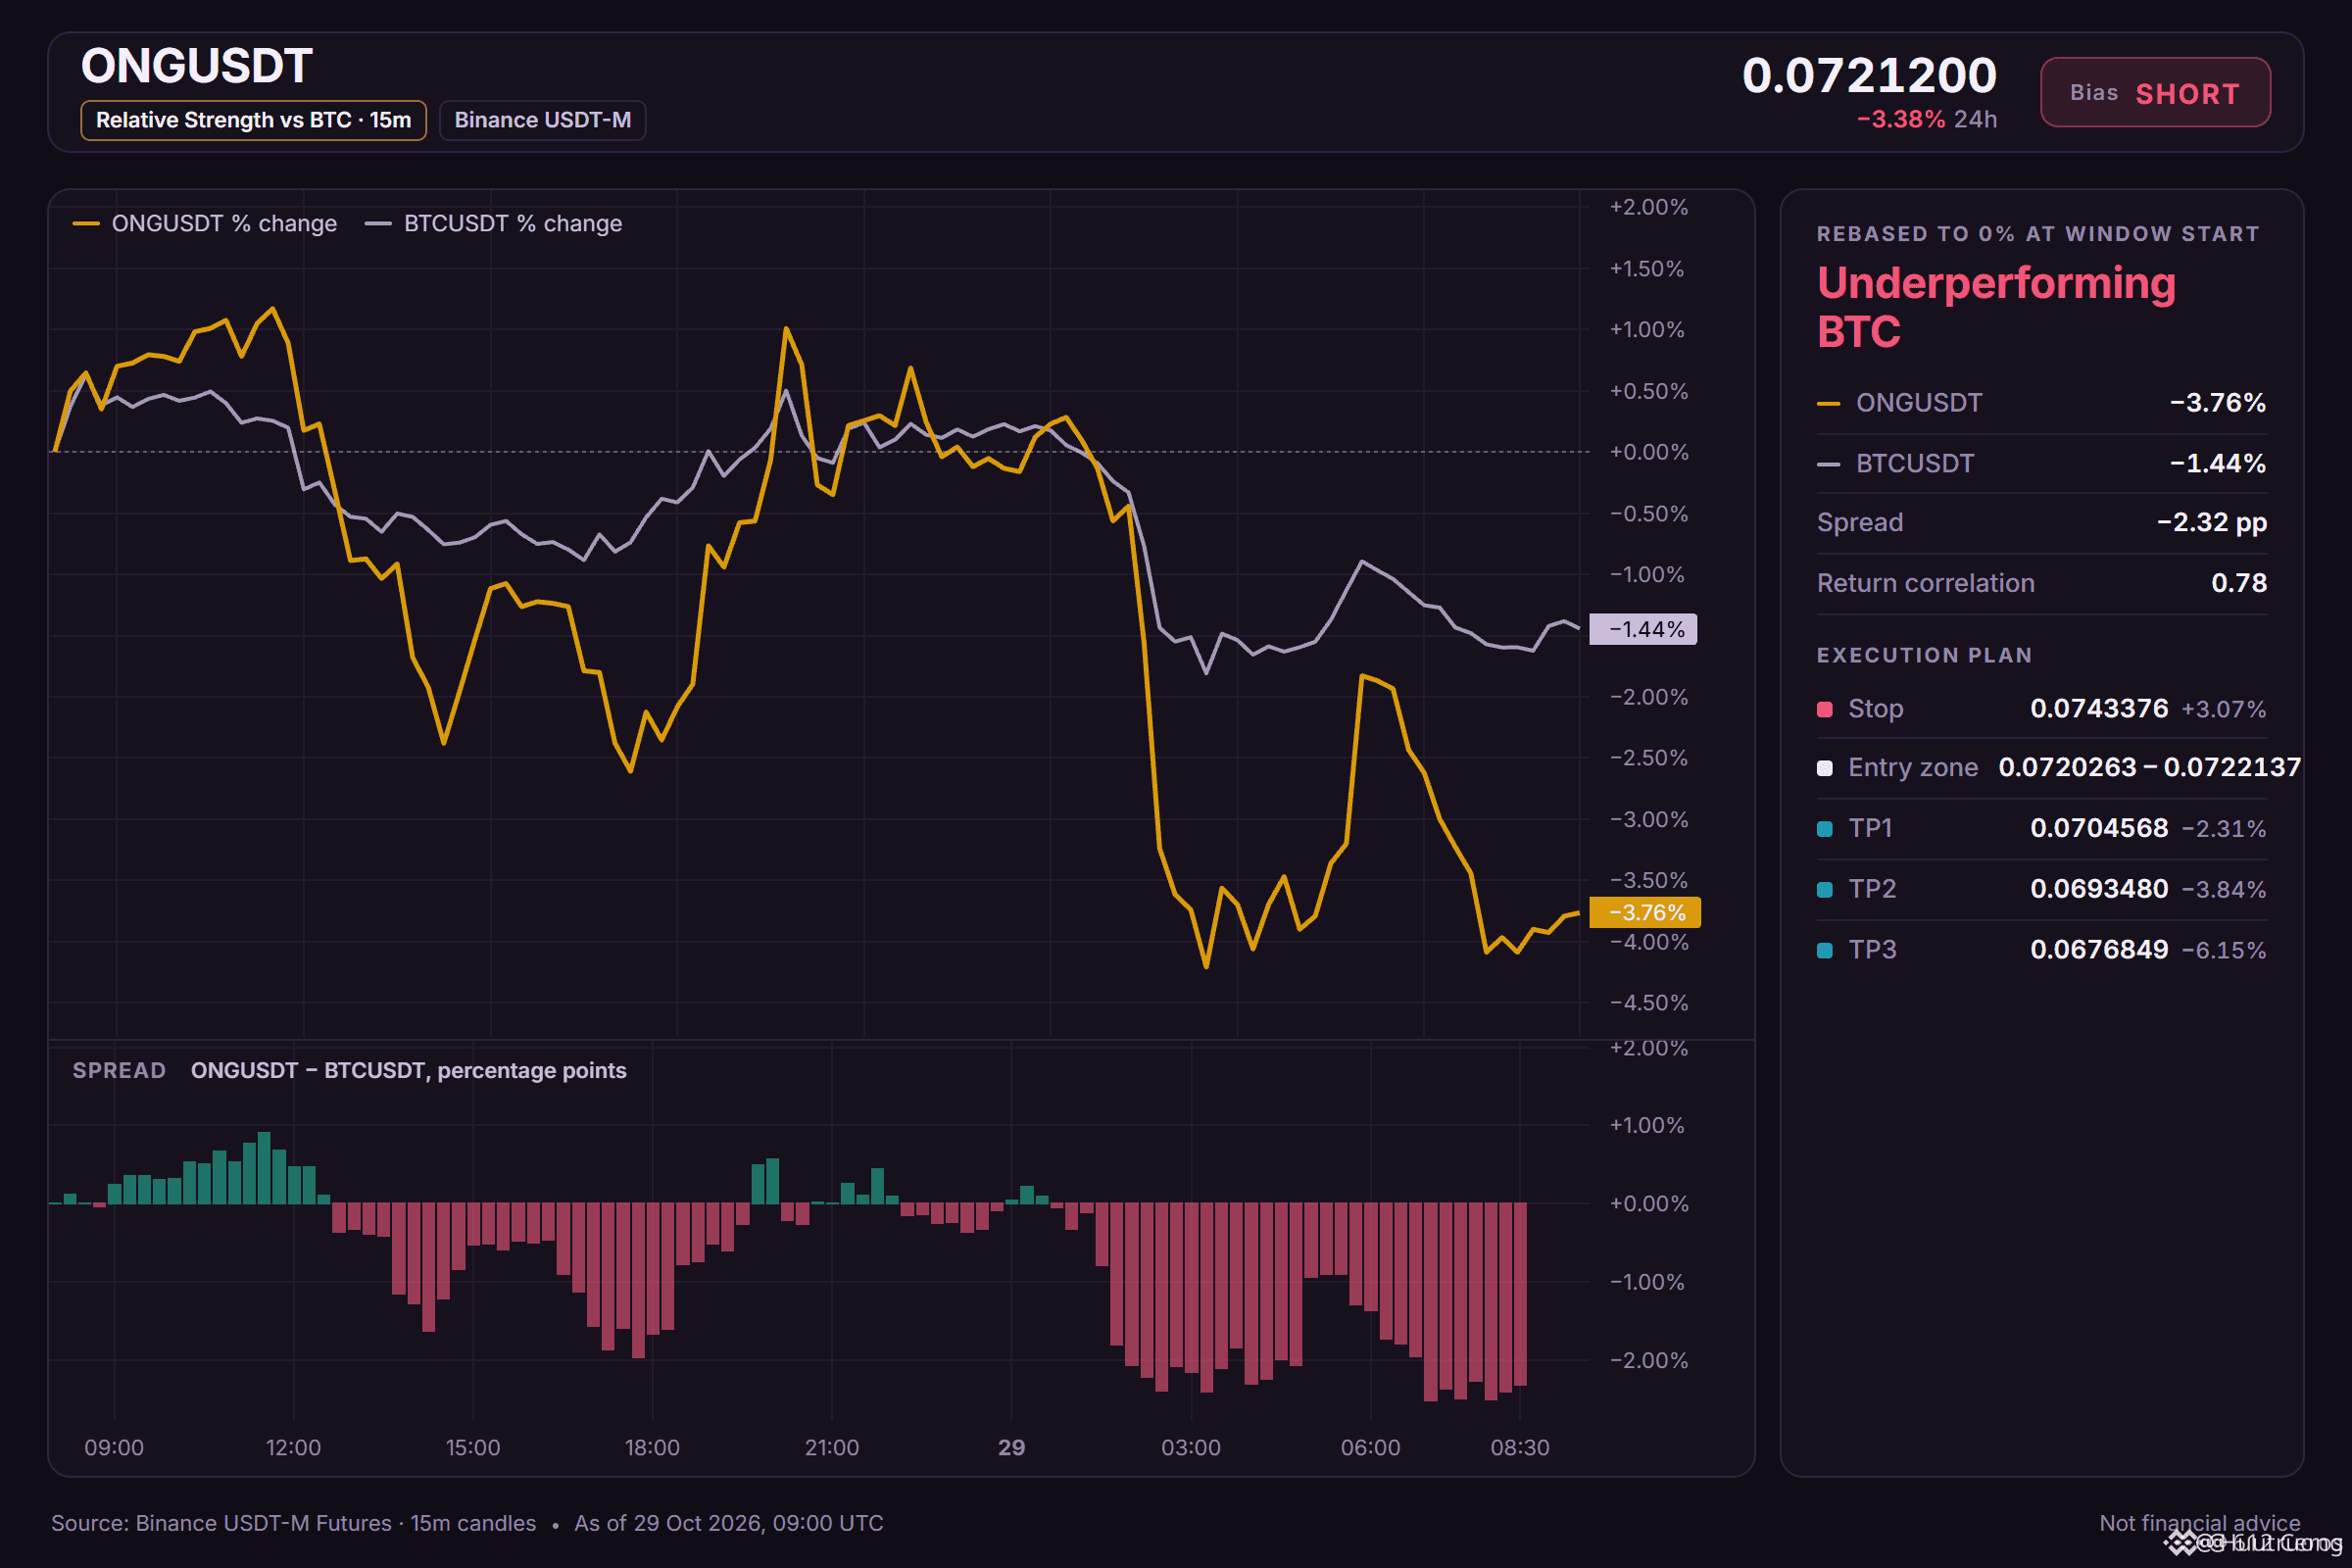
ONG short setup: the levels I'm watching
🔴 SHORT $ONG /USDT: expecting price to go DOWN
Bias: SHORT · Strong
Entry: 0.0720263 – 0.0722137
TP1: 0.0704568 (-2.3%)
TP2: 0.0693480 (-3.8%)
TP3: 0.0676849 (-6.1%)
SL: 0.0743376 (+3.1%)
Plan: enter only inside the zone, close 50% at TP1, 25% at TP2, 25% at TP3, and move the stop to entry after TP1.
Why SHORT? 7/12 signals agree, 0 against.
• 4h trend down (below EMA50 & EMA200)
• 1h trend down (below EMA50 & EMA200)
• Sellers are driving the move (15m ADX 28.6)
Why now?
The daily trend reads range, and 7/12 signals aligned favour the short side. The plan is to work the 0.0720263 – 0.0722137 zone, scale out at 0.0704568 and 0.0693480, and stay patient for 0.0676849. A move through 0.0743376 means the idea is wrong and the stop does its job.
Does ONG tag 0.0704568 first, or the stop?
36
·
--
Падение
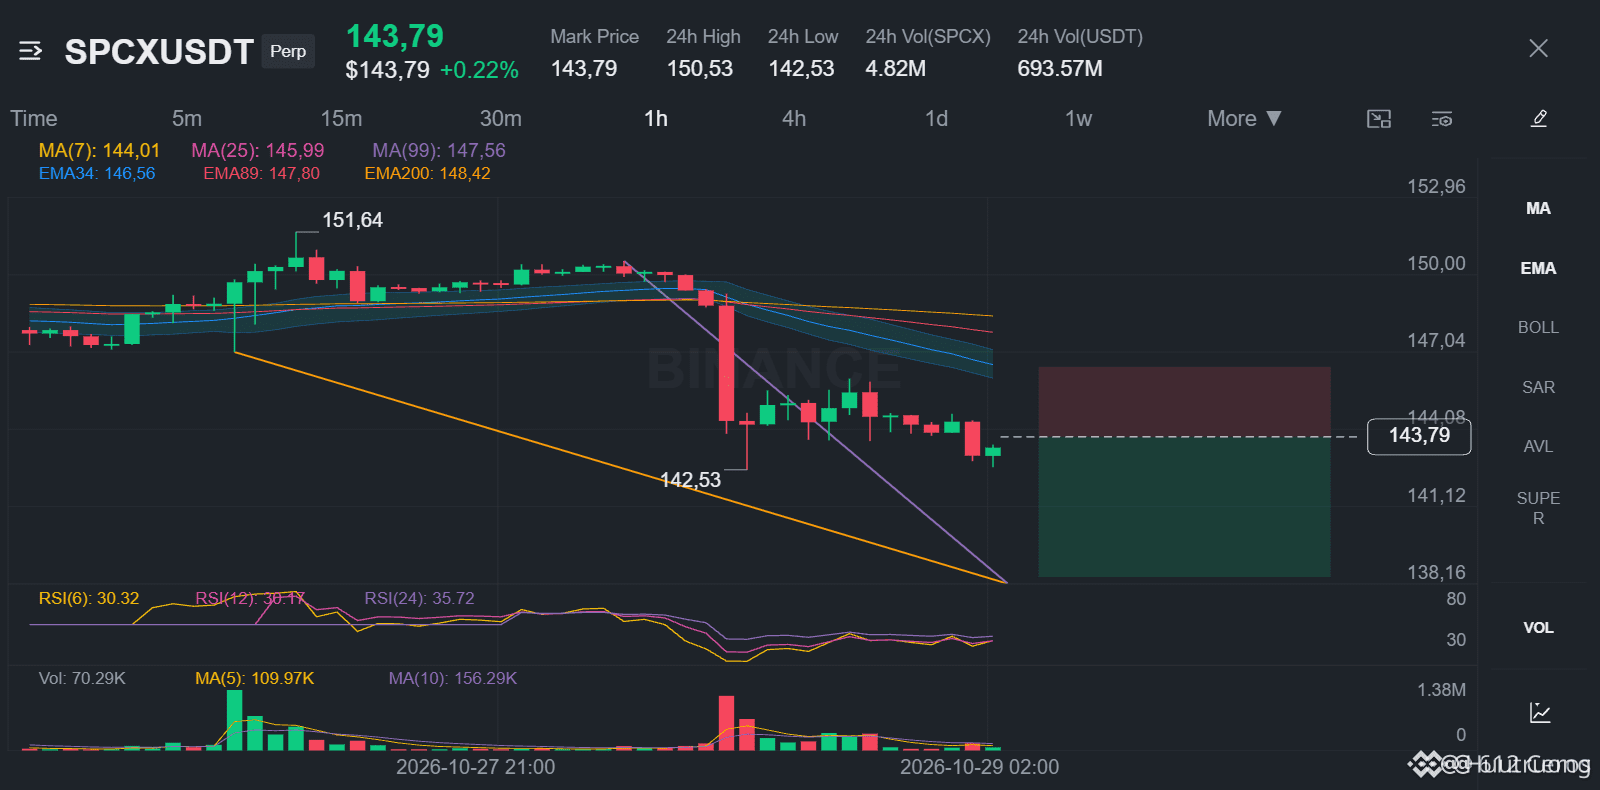
🔴 $SPCX
{future}(SPCXUSDT)
/USDT — SHORT SETUP
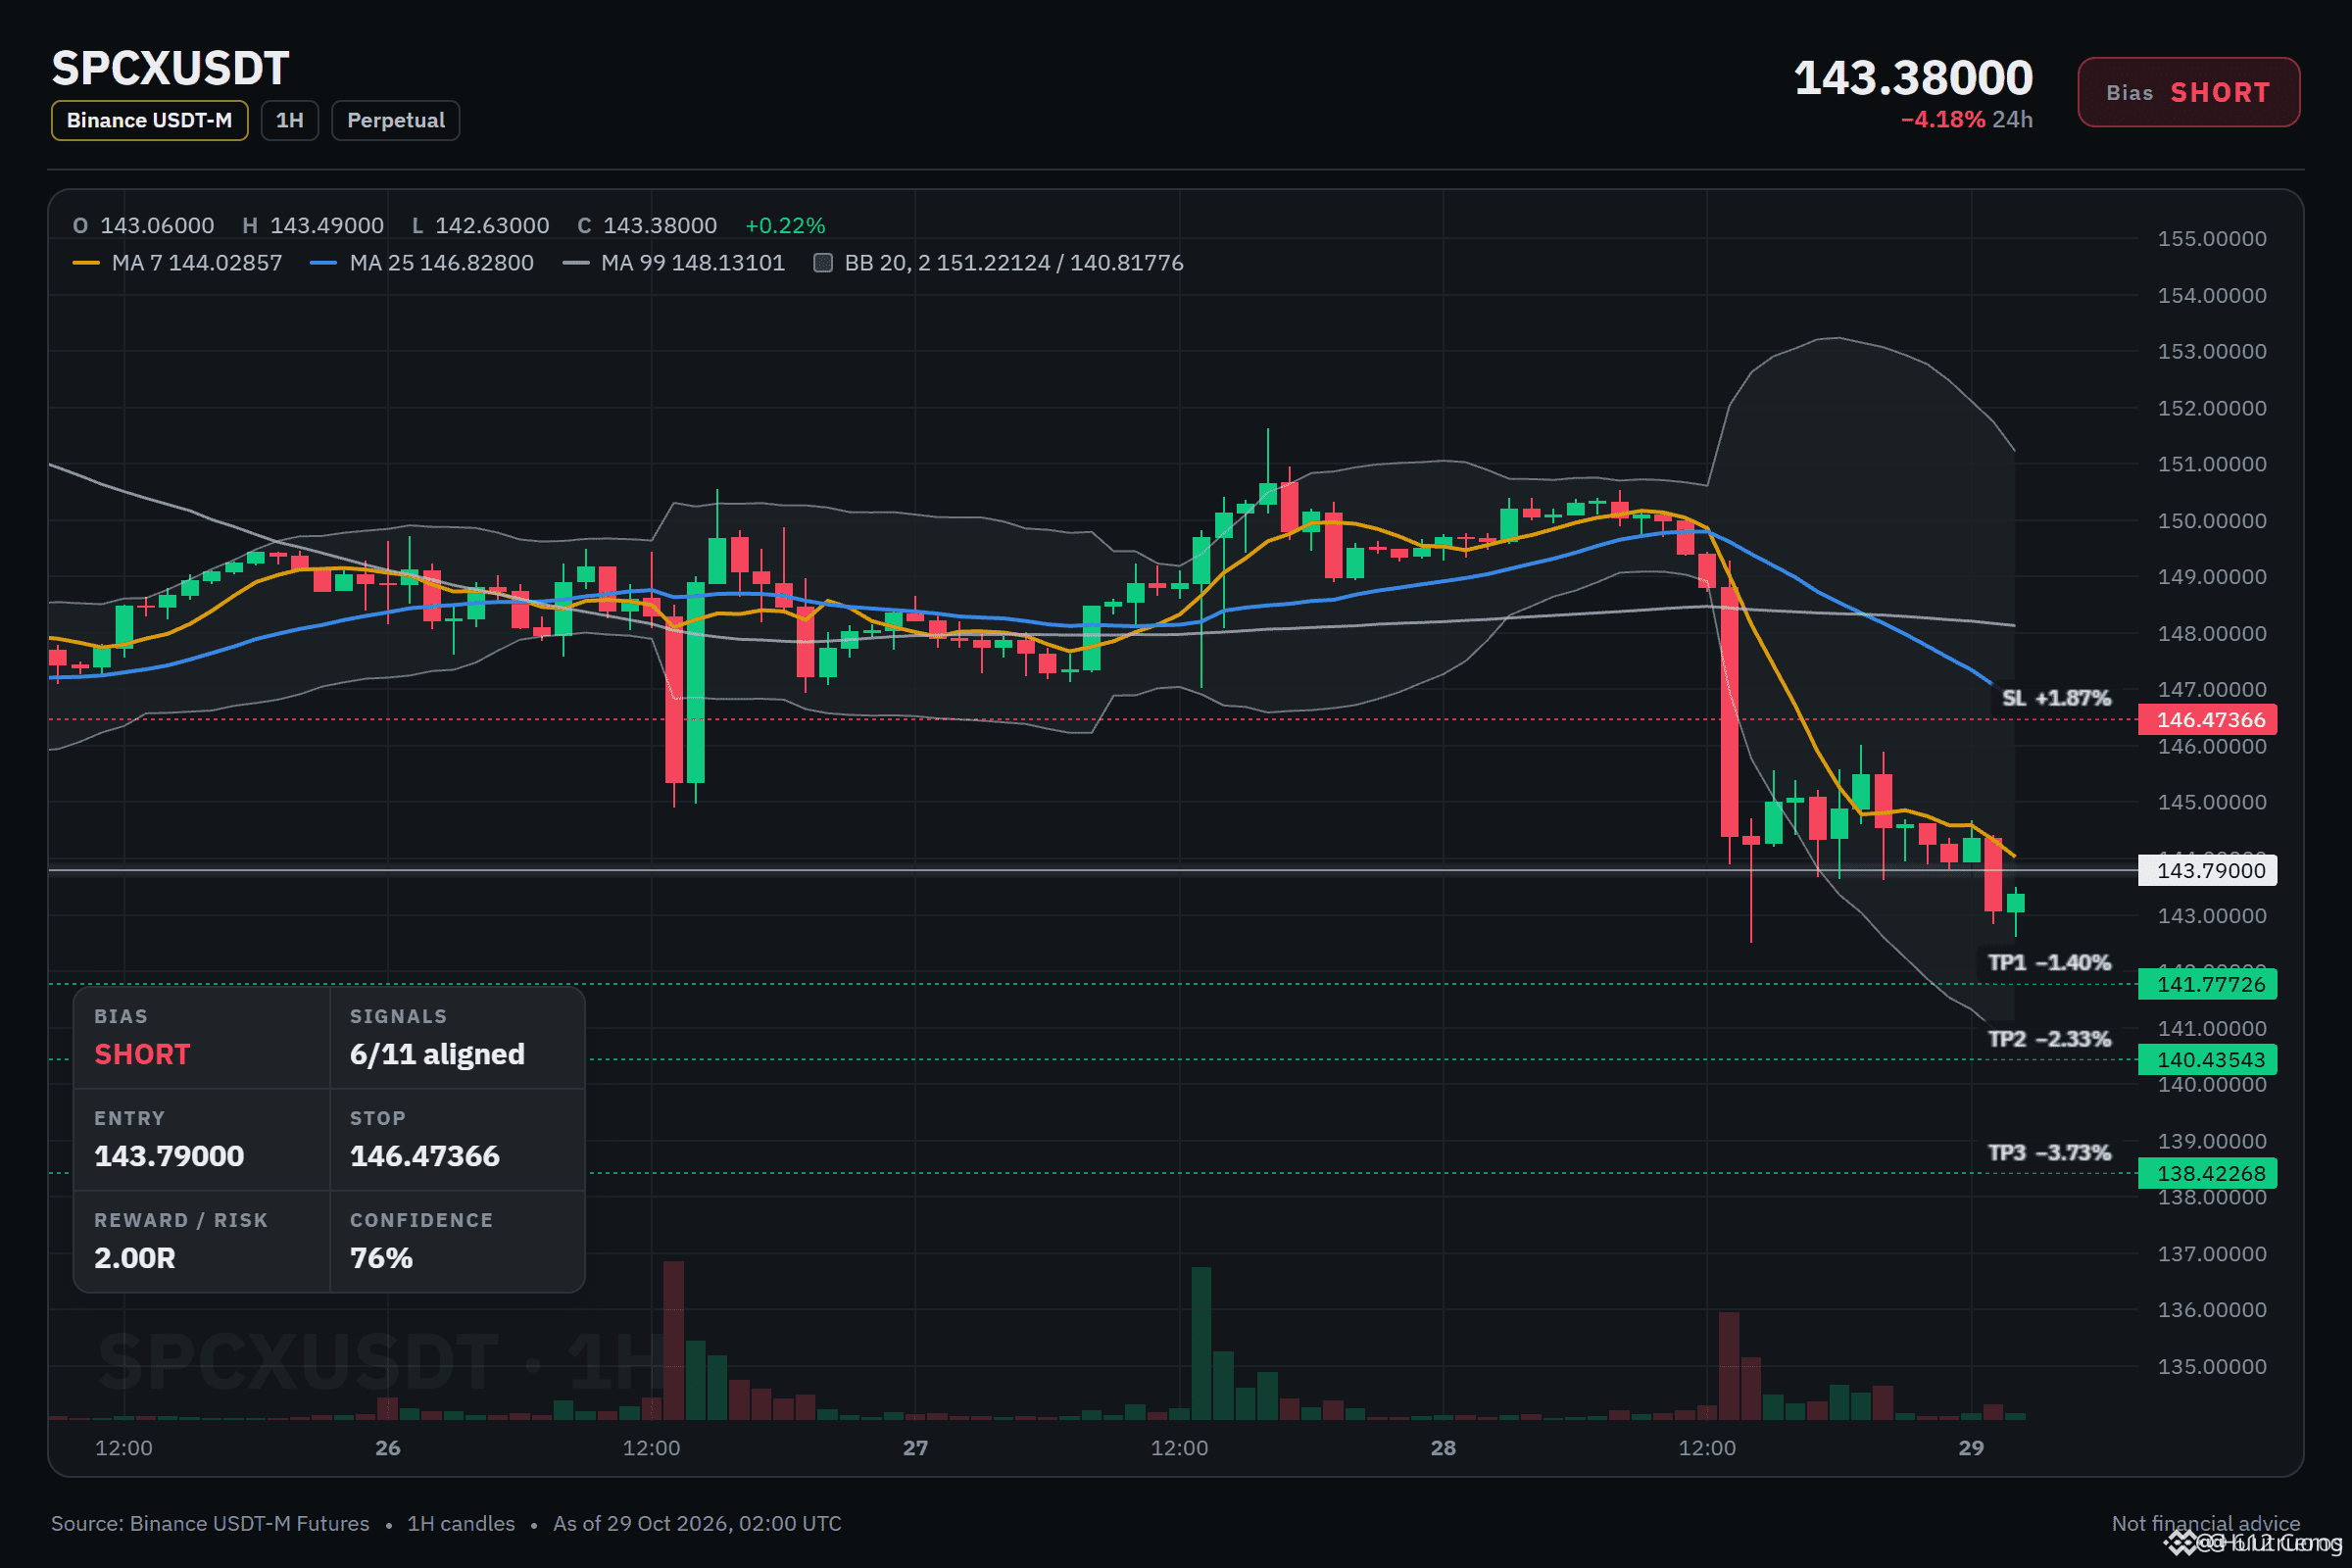
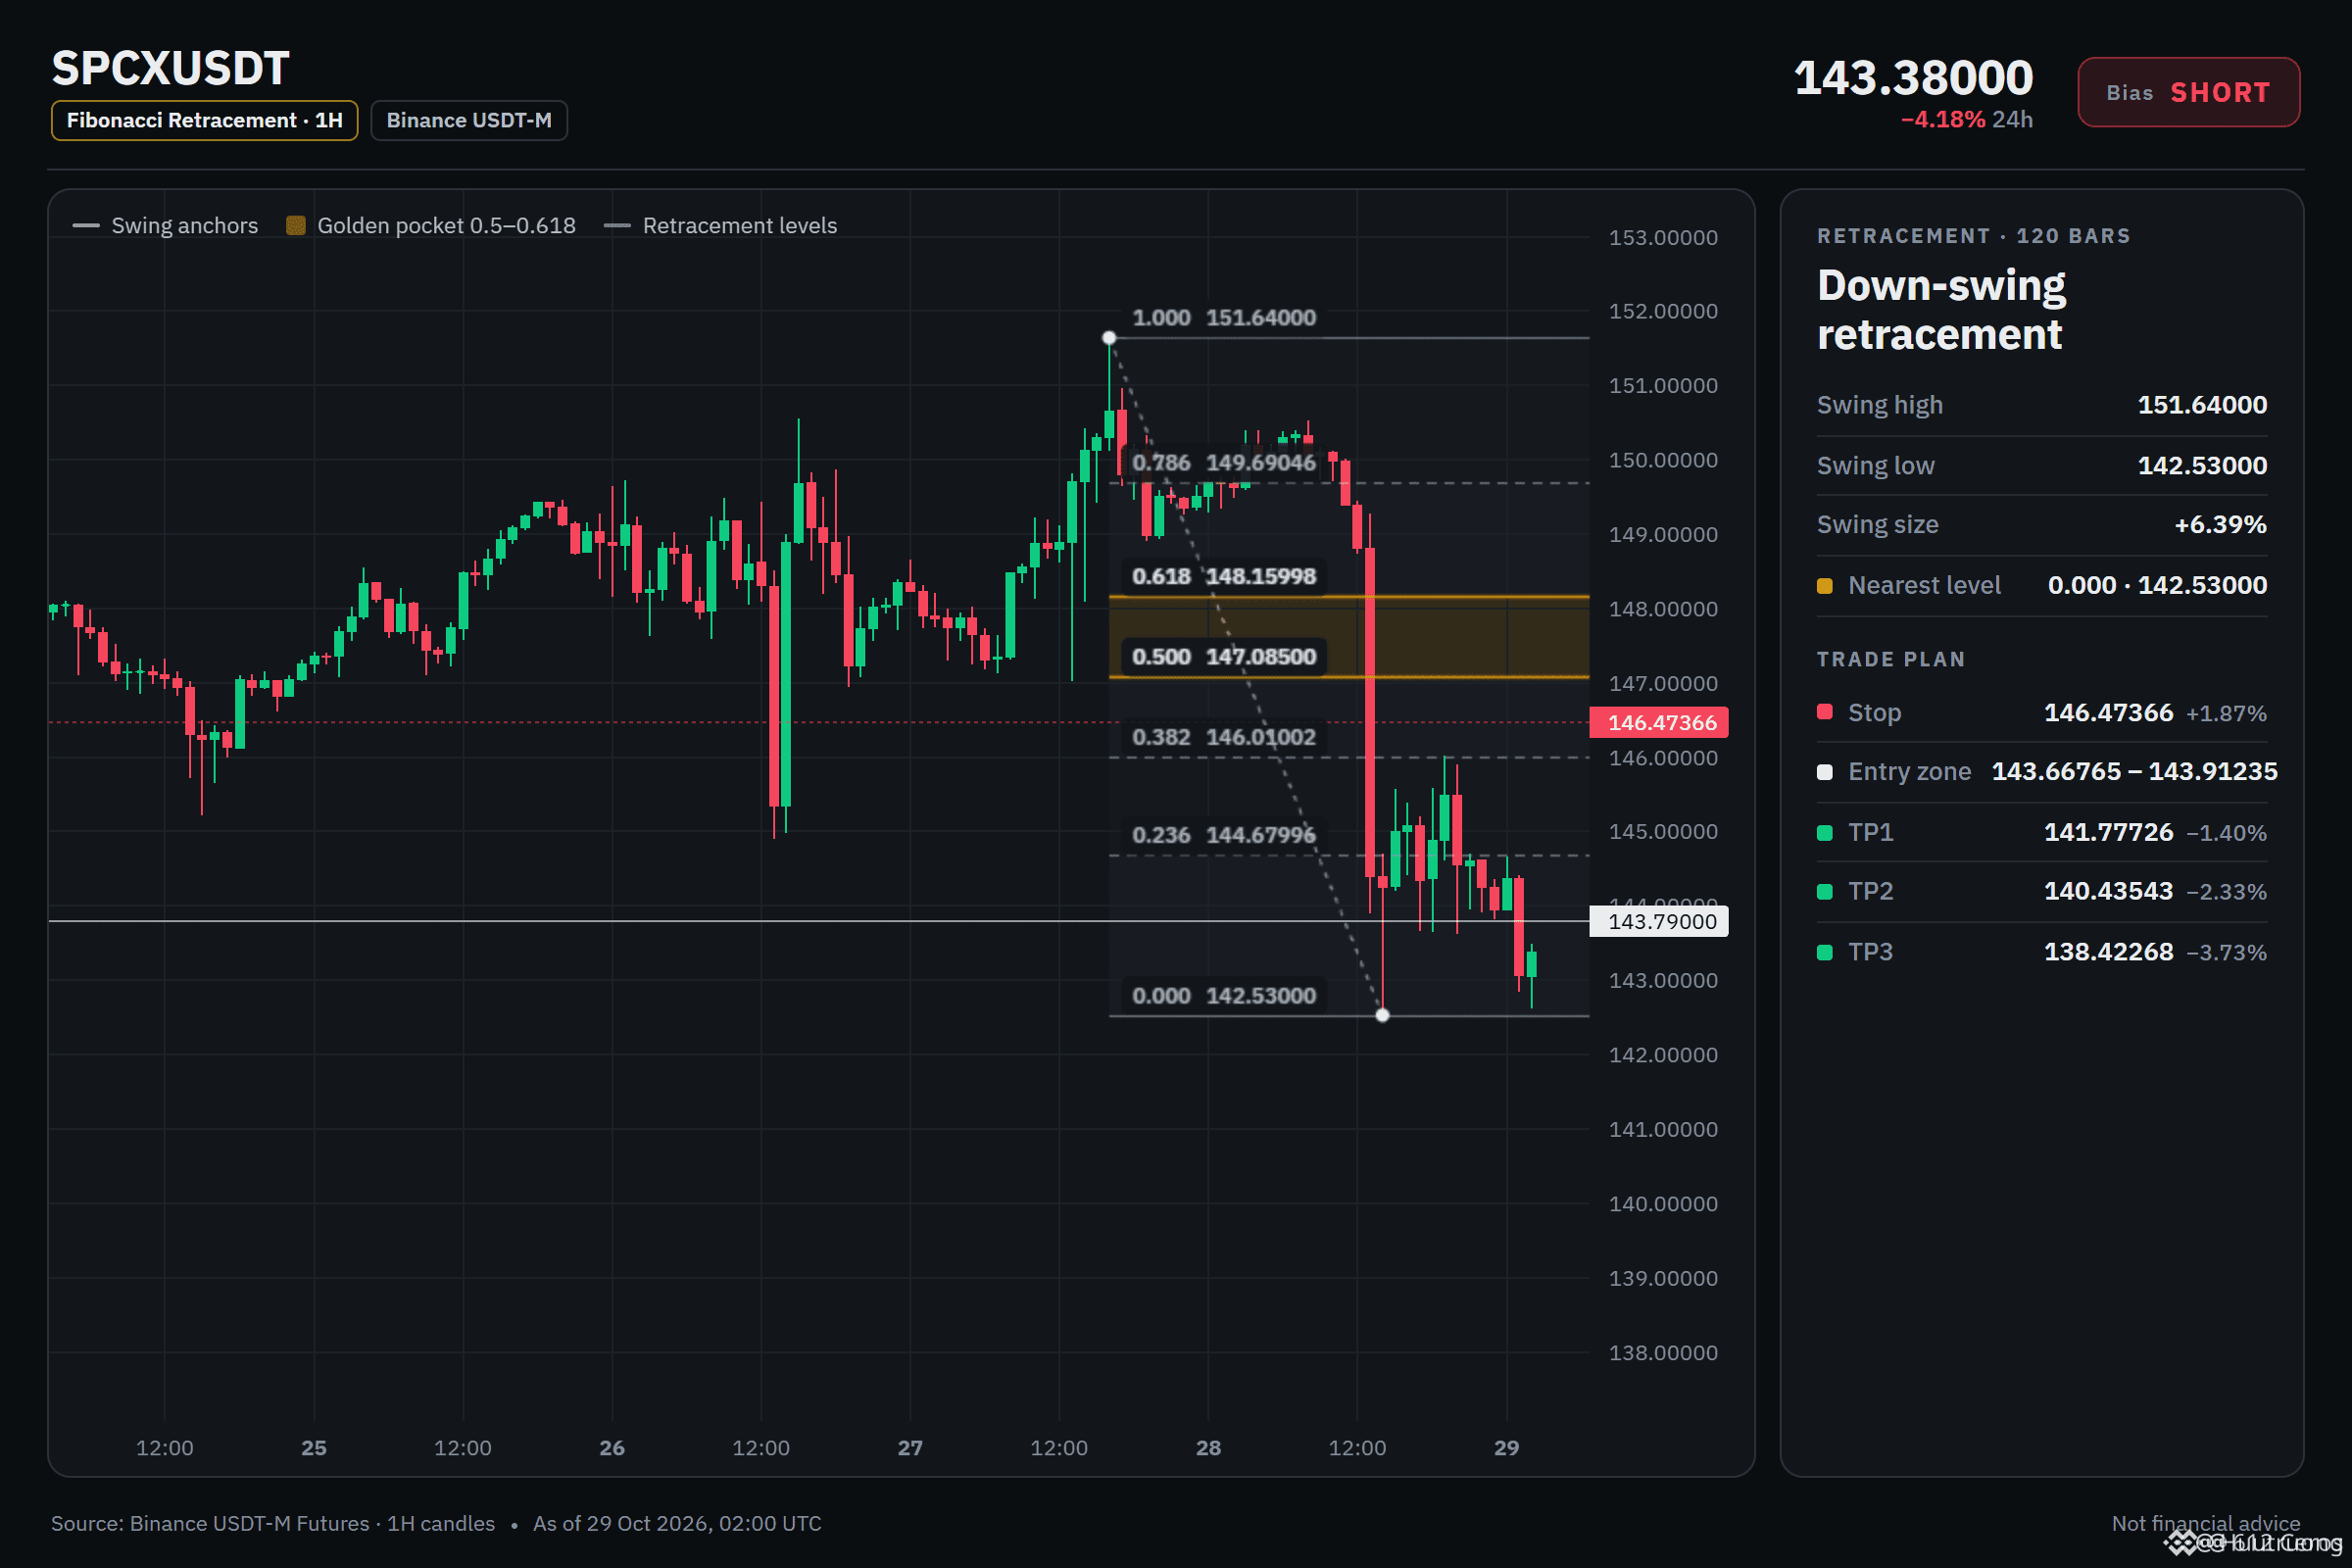
📍 Entry: 143.66765–143.91235
🎯 TP1: 141.77726
🎯 TP2: 140.43543
🎯 TP3: 138.42268
🛑 SL: 146.47366
📉 Bearish signals:
• 4H & 1H below EMA50 and EMA200
• RSI (1H): 30.6
• ADX (15M): 28.4
• 6/11 signals favour SHORT
Plan: Wait for entry confirmation and manage risk carefully. RSI near 30 may also signal oversold conditions, so watch for a rebound.
Where would you place your invalidation level? 👇
#SPCX #Crypto #Trading
🔴 $SPCX
/USDT — SHORT SETUP
📍 Entry: 143.66765–143.91235
🎯 TP1: 141.77726
🎯 TP2: 140.43543
🎯 TP3: 138.42268
🛑 SL: 146.47366
📉 Bearish signals:
• 4H & 1H below EMA50 and EMA200
• RSI (1H): 30.6
• ADX (15M): 28.4
• 6/11 signals favour SHORT
Plan: Wait for entry confirmation and manage risk carefully. RSI near 30 may also signal oversold conditions, so watch for a rebound.
Where would you place your invalidation level? 👇
#SPCX #Crypto #Trading
14
·
--
Падение
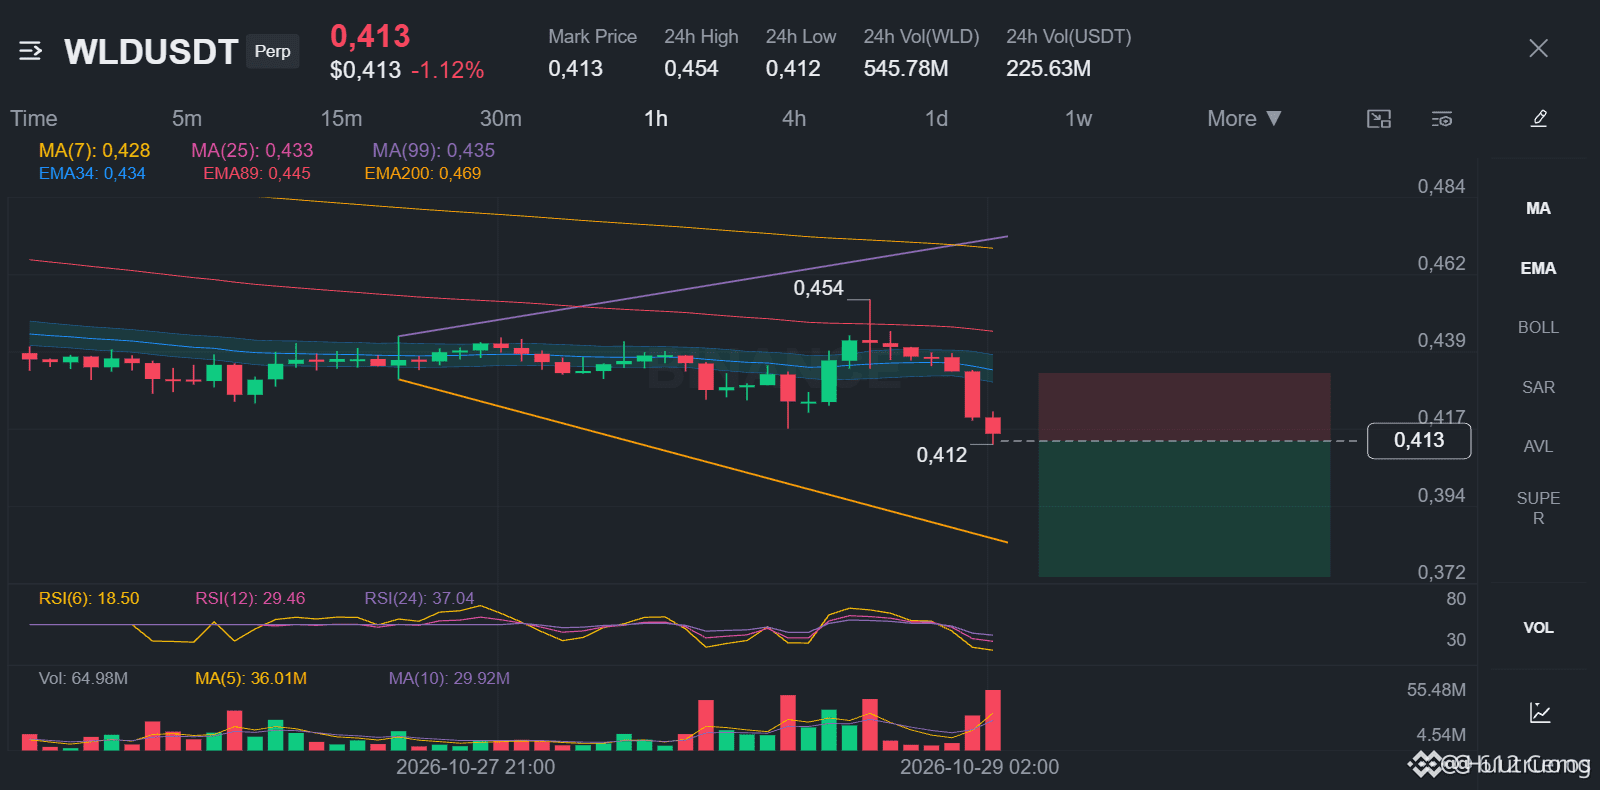
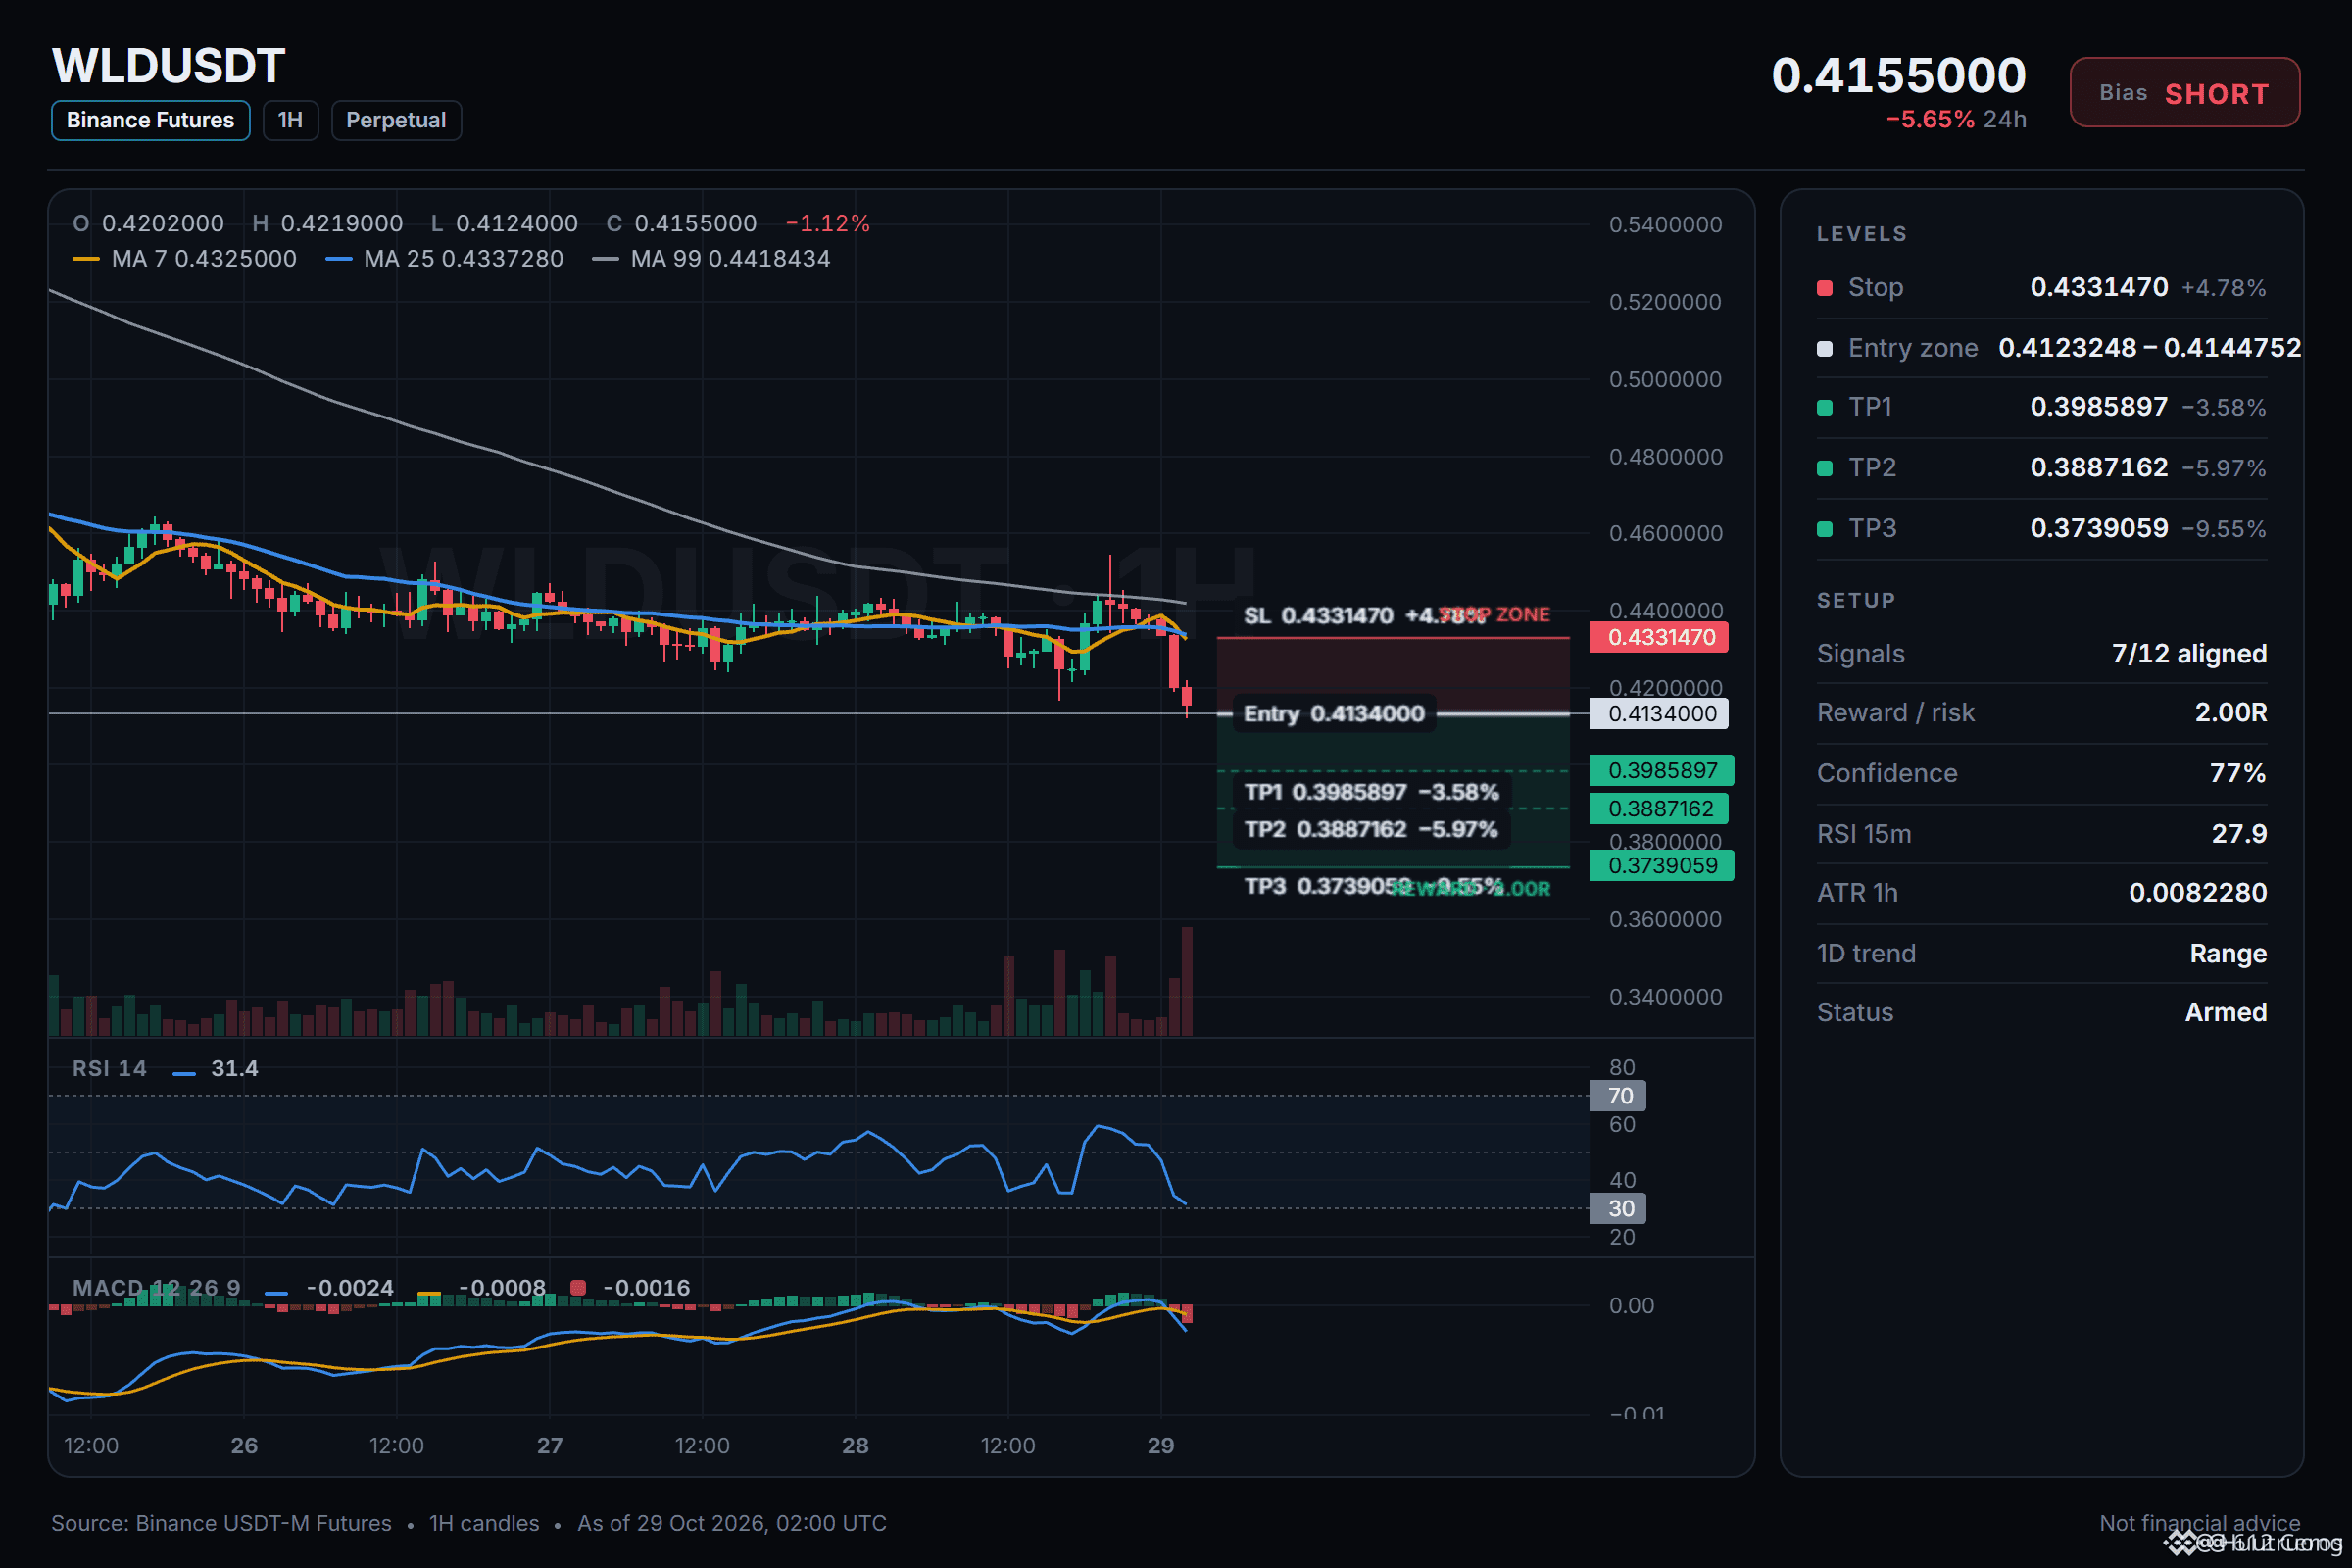
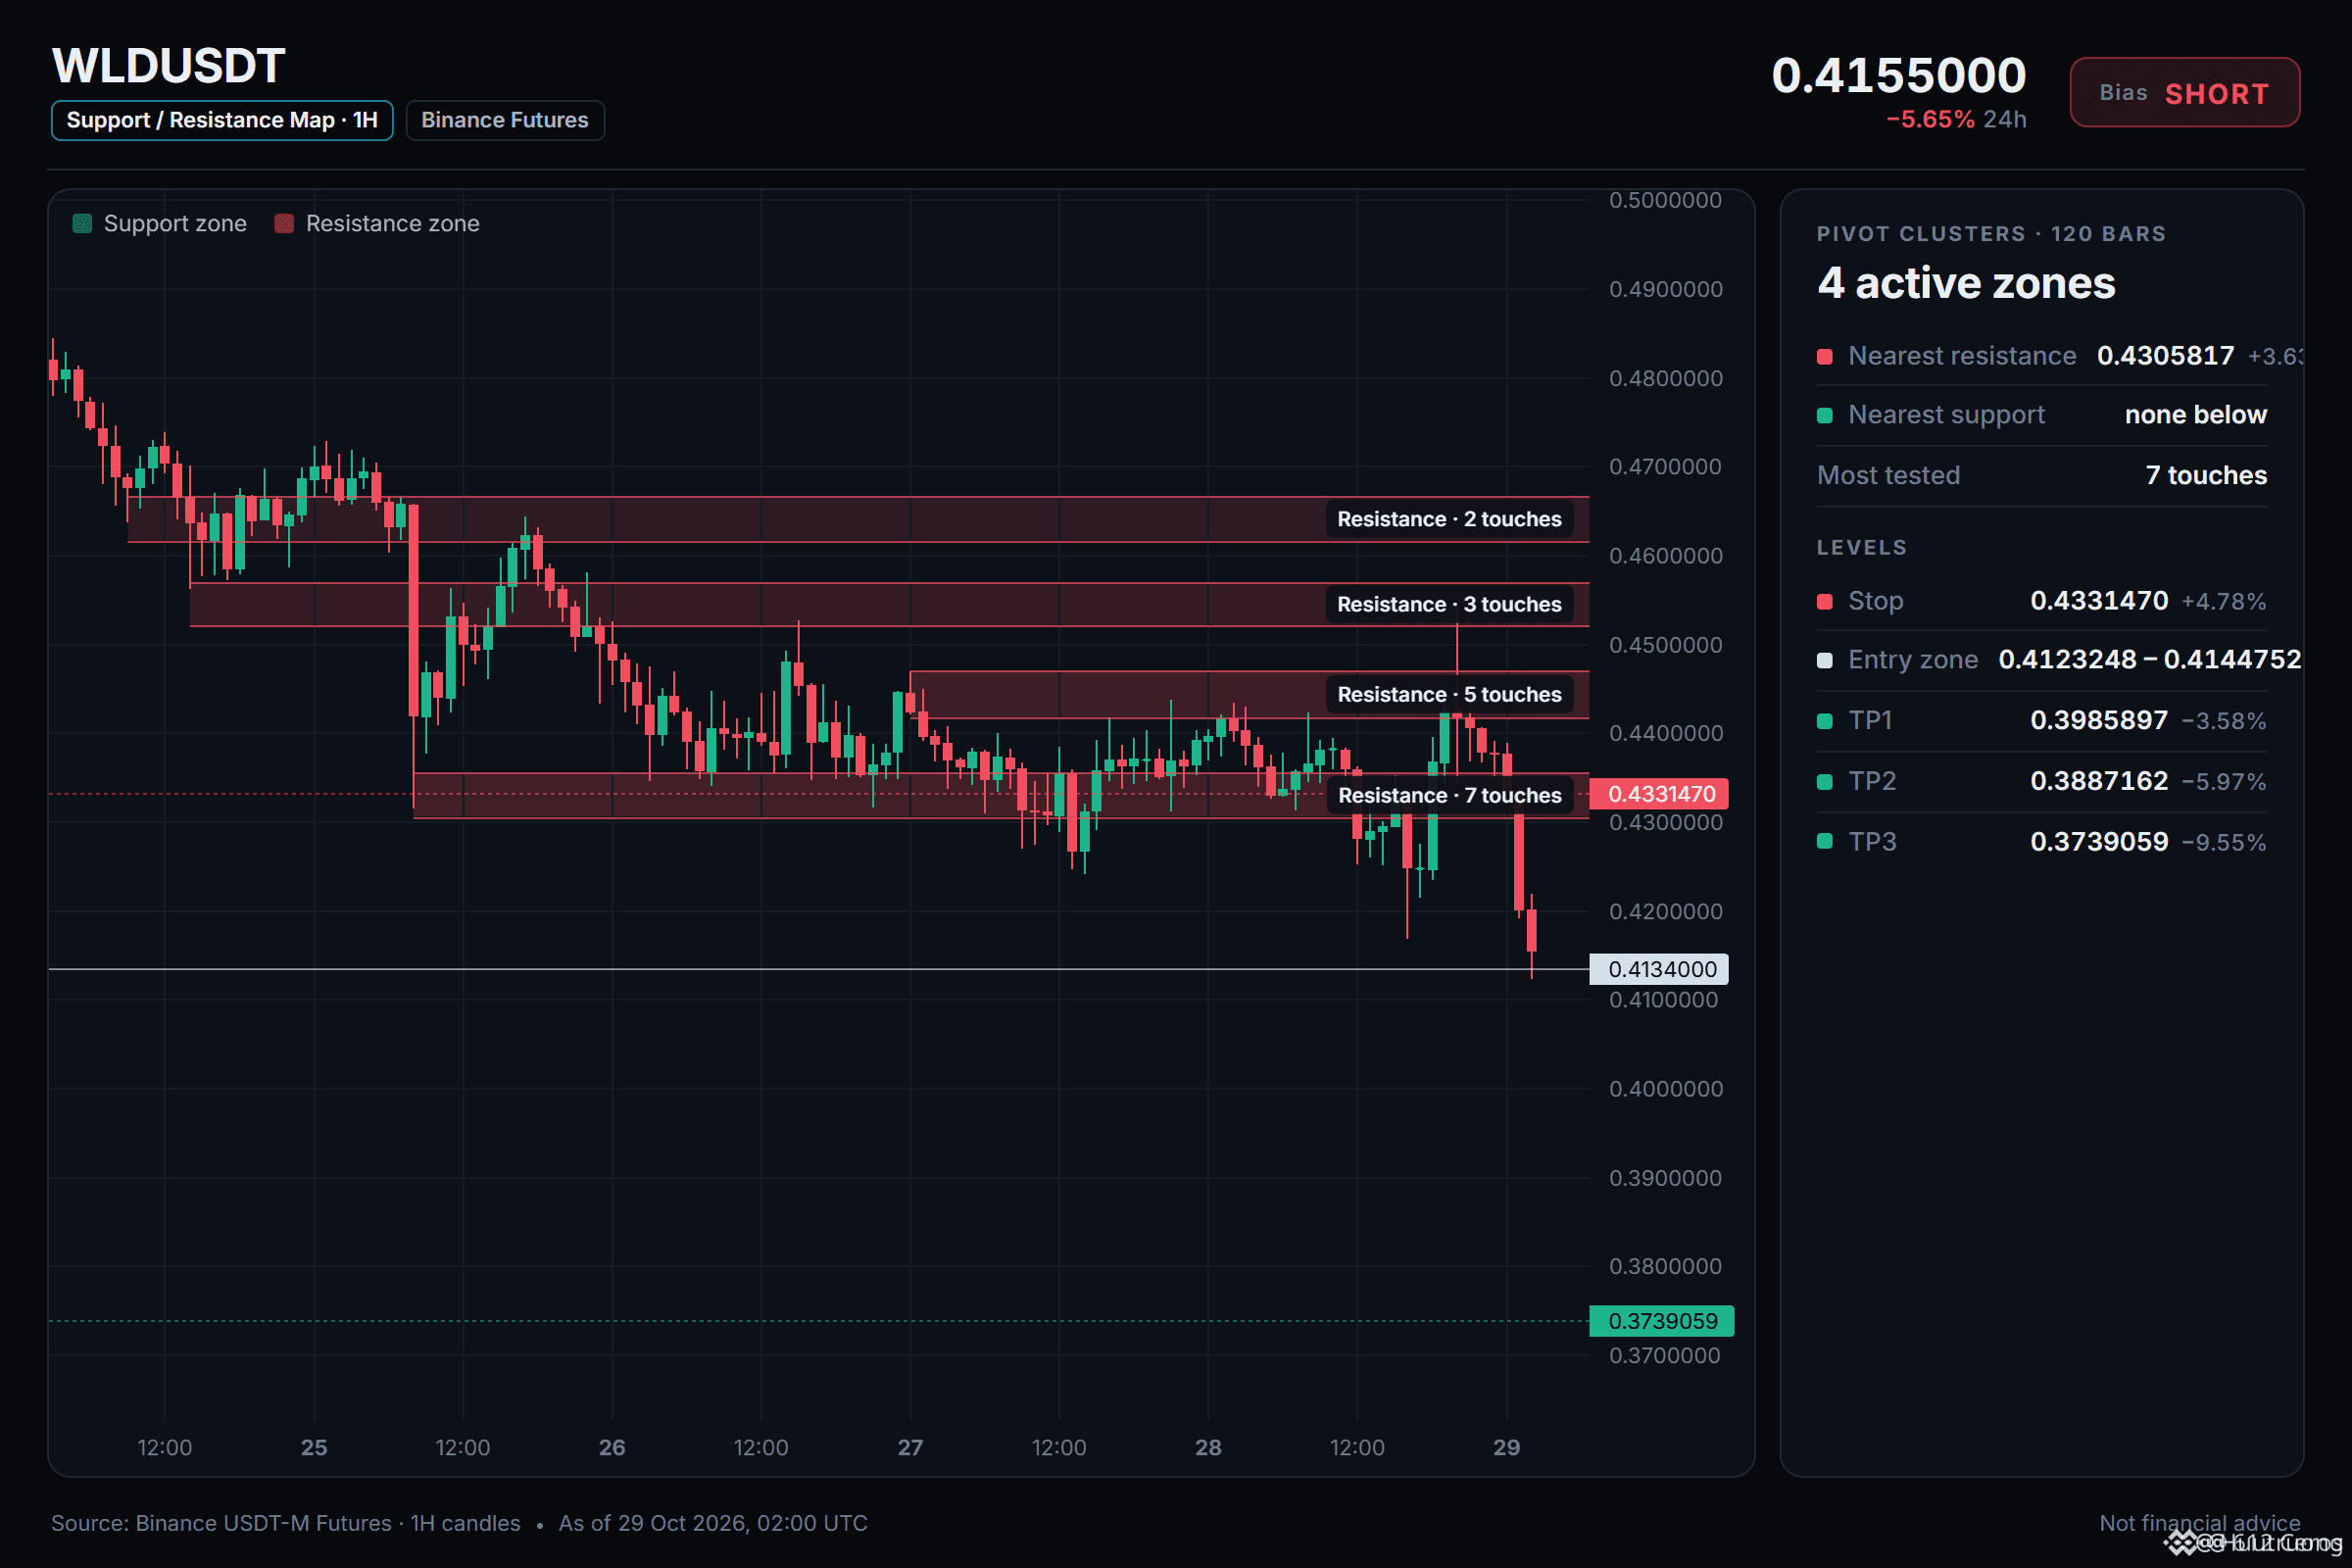
🔴 $WLD
{spot}(WLDUSDT)
/USDT — SHORT SETUP
Bias: Bearish, but confirmation matters.
📍 Entry: 0.4123248–0.4144752
🎯 TP1: 0.3985897
🎯 TP2: 0.3887162
🎯 TP3: 0.3739059
🛑 SL: 0.4331470
Why watch this setup?
• 4H and 1H price below EMA50 and EMA200
• 15M ADX: 35.2
• 7 of 12 signals favour SHORT
Plan: Wait for the entry zone. Consider taking partial profits at each target and reassess risk after TP1.
These levels are a technical scenario, not a guarantee. DYOR and manage risk carefully.
Will $WLD reach TP1 first, or invalidate the setup?
#WLD #Crypto #Trading
🔴 $WLD
/USDT — SHORT SETUP
Bias: Bearish, but confirmation matters.
📍 Entry: 0.4123248–0.4144752
🎯 TP1: 0.3985897
🎯 TP2: 0.3887162
🎯 TP3: 0.3739059
🛑 SL: 0.4331470
Why watch this setup?
• 4H and 1H price below EMA50 and EMA200
• 15M ADX: 35.2
• 7 of 12 signals favour SHORT
Plan: Wait for the entry zone. Consider taking partial profits at each target and reassess risk after TP1.
These levels are a technical scenario, not a guarantee. DYOR and manage risk carefully.
Will $WLD reach TP1 first, or invalidate the setup?
#WLD #Crypto #Trading
7
·
--
🚀 Crypto is more than price movements!
Which matters most for long-term growth: Bitcoin's adoption, Ethereum's ecosystem, or new blockchain innovations?
Share your perspective below! 👇 Always DYOR before trading.
$BTC $ETH #BinanceSquare #Crypto
🚀 Crypto is more than price movements!
Which matters most for long-term growth: Bitcoin's adoption, Ethereum's ecosystem, or new blockchain innovations?
Share your perspective below! 👇 Always DYOR before trading.
$BTC $ETH #BinanceSquare #Crypto
Which matters most for long-term growth: Bitcoin's adoption, Ethereum's ecosystem, or new blockchain innovations?
Share your perspective below! 👇 Always DYOR before trading.
$BTC $ETH #BinanceSquare #Crypto
53
·
--
Looking for crypto insights? 👀
Follow my updates on $BTC, $ETH, and other trending coins. Share your thoughts, join the discussion, and always DYOR before trading.
Click coin tags to explore market opportunities on Binance.
#BinanceSquare #Crypto #Trading
Looking for crypto insights? 👀
Follow my updates on $BTC, $ETH, and other trending coins. Share your thoughts, join the discussion, and always DYOR before trading.
Click coin tags to explore market opportunities on Binance.
#BinanceSquare #Crypto #Trading
Follow my updates on $BTC, $ETH, and other trending coins. Share your thoughts, join the discussion, and always DYOR before trading.
Click coin tags to explore market opportunities on Binance.
#BinanceSquare #Crypto #Trading

53
·
--
Tôi đã kiếm được lợi nhuận 0.10 USDC từ Write to Earn vào tuần trước
🎁 Small rewards, a great start!
I just received 0.10 USDC on Binance! 🚀
Want to explore Binance and discover rewards for eligible new users? Sign up through my referral link and check the available promotions.
💰 Referral commission: up to 20% on eligible trading fees.
🔗 Join here: [https://app.binance.com/uni-qr/cpro/Deaflove?l=en&r=JQ3F4UE9&uc=web_square_share_link&us=copylink](https://app.binance.com/uni-qr/cpro/Deaflove?l=en&r=JQ3F4UE9&uc=web_square_share_link&us=copylink)
Rewards and commissions depend on eligibility and official terms.
#Binance #USDC #Crypto #Referral
Tôi đã kiếm được lợi nhuận 0.10 USDC từ Write to Earn vào tuần trước
🎁 Small rewards, a great start!
I just received 0.10 USDC on Binance! 🚀
Want to explore Binance and discover rewards for eligible new users? Sign up through my referral link and check the available promotions.
💰 Referral commission: up to 20% on eligible trading fees.
🔗 Join here: https://app.binance.com/uni-qr/cpro/Deaflove?l=en&r=JQ3F4UE9&uc=web_square_share_link&us=copylink
Rewards and commissions depend on eligibility and official terms.
#Binance #USDC #Crypto #Referral

7
·
--
Рост
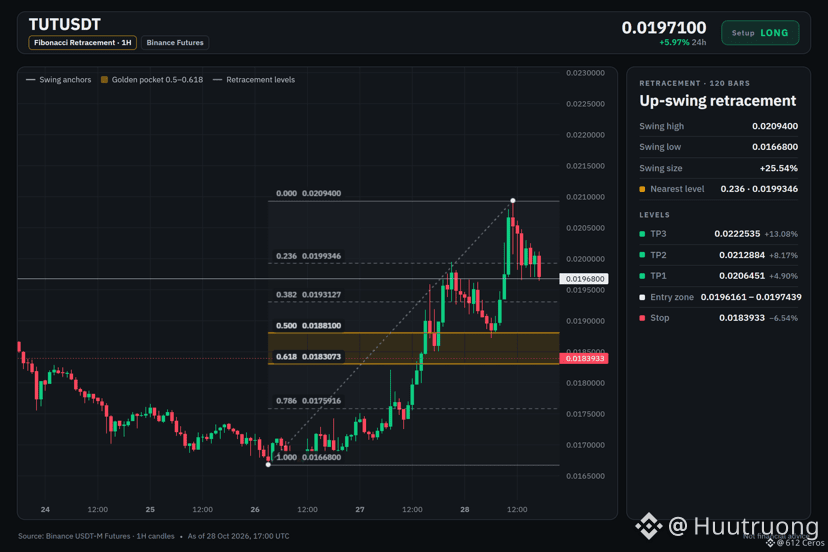
TUT is not stuck in a range on the 1h.
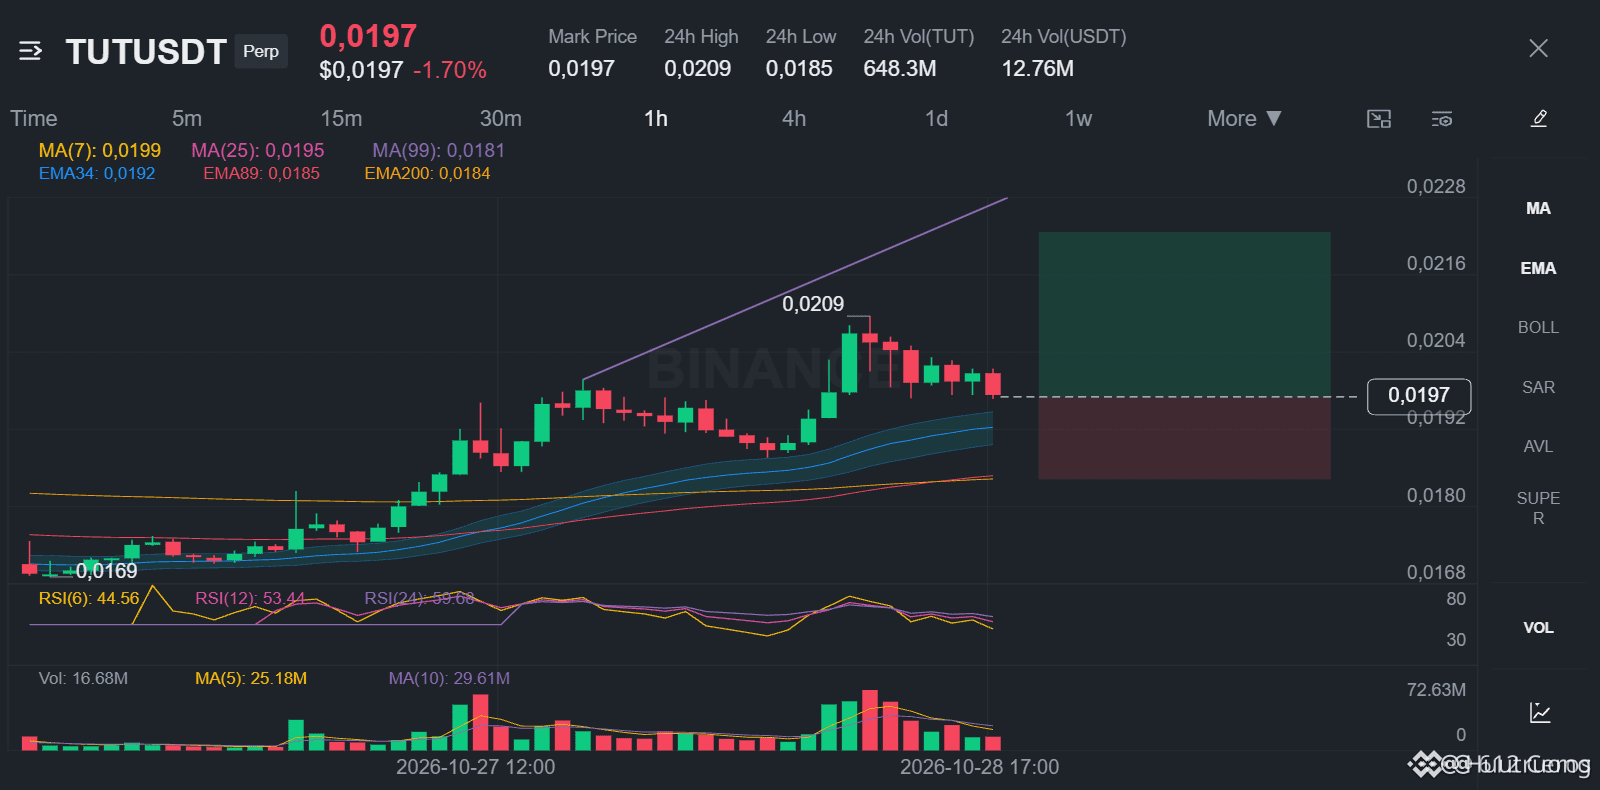
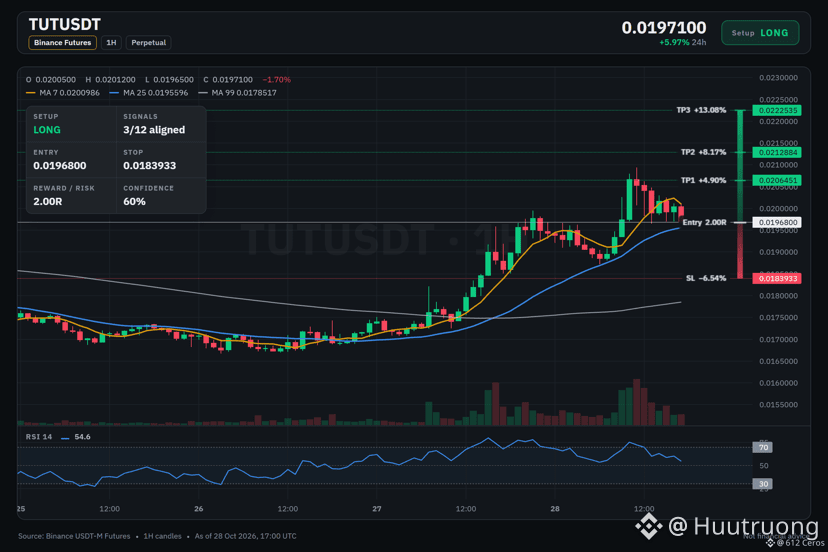
🟢 LONG $TUT /USDT: expecting price to go UP
Bias: LONG · Leaning
Entry: 0.0196161 – 0.0197439
TP1: 0.0206451 (+4.9%)
TP2: 0.0212884 (+8.2%)
TP3: 0.0222535 (+13.1%)
SL: 0.0183933 (-6.5%)
Plan: enter only inside the zone, close 50% at TP1, 25% at TP2, 25% at TP3, and move the stop to entry after TP1.
Note: moderate conviction only, keep size light.
Why LONG? 3/12 signals agree, 0 against.
• 1h trend up (above EMA50 & EMA200)
• Buyers have the momentum (4h RSI 64.8)
• Stronger than BTC (+3.65% 24h vs BTC)
My read on TUT today
I'm watching the 1h price and the daily trend. The 1h trend is up with price above EMA50 and EMA200. The daily trend is range, so conviction is moderate and I want to see a daily close above the daily EMA50.
Where would you invalidate this long?
{spot}(TUTUSDT)
TUT is not stuck in a range on the 1h.
🟢 LONG $TUT /USDT: expecting price to go UP
Bias: LONG · Leaning
Entry: 0.0196161 – 0.0197439
TP1: 0.0206451 (+4.9%)
TP2: 0.0212884 (+8.2%)
TP3: 0.0222535 (+13.1%)
SL: 0.0183933 (-6.5%)
Plan: enter only inside the zone, close 50% at TP1, 25% at TP2, 25% at TP3, and move the stop to entry after TP1.
Note: moderate conviction only, keep size light.
Why LONG? 3/12 signals agree, 0 against.
• 1h trend up (above EMA50 & EMA200)
• Buyers have the momentum (4h RSI 64.8)
• Stronger than BTC (+3.65% 24h vs BTC)
My read on TUT today
I'm watching the 1h price and the daily trend. The 1h trend is up with price above EMA50 and EMA200. The daily trend is range, so conviction is moderate and I want to see a daily close above the daily EMA50.
Where would you invalidate this long?
13
·
--
Рост
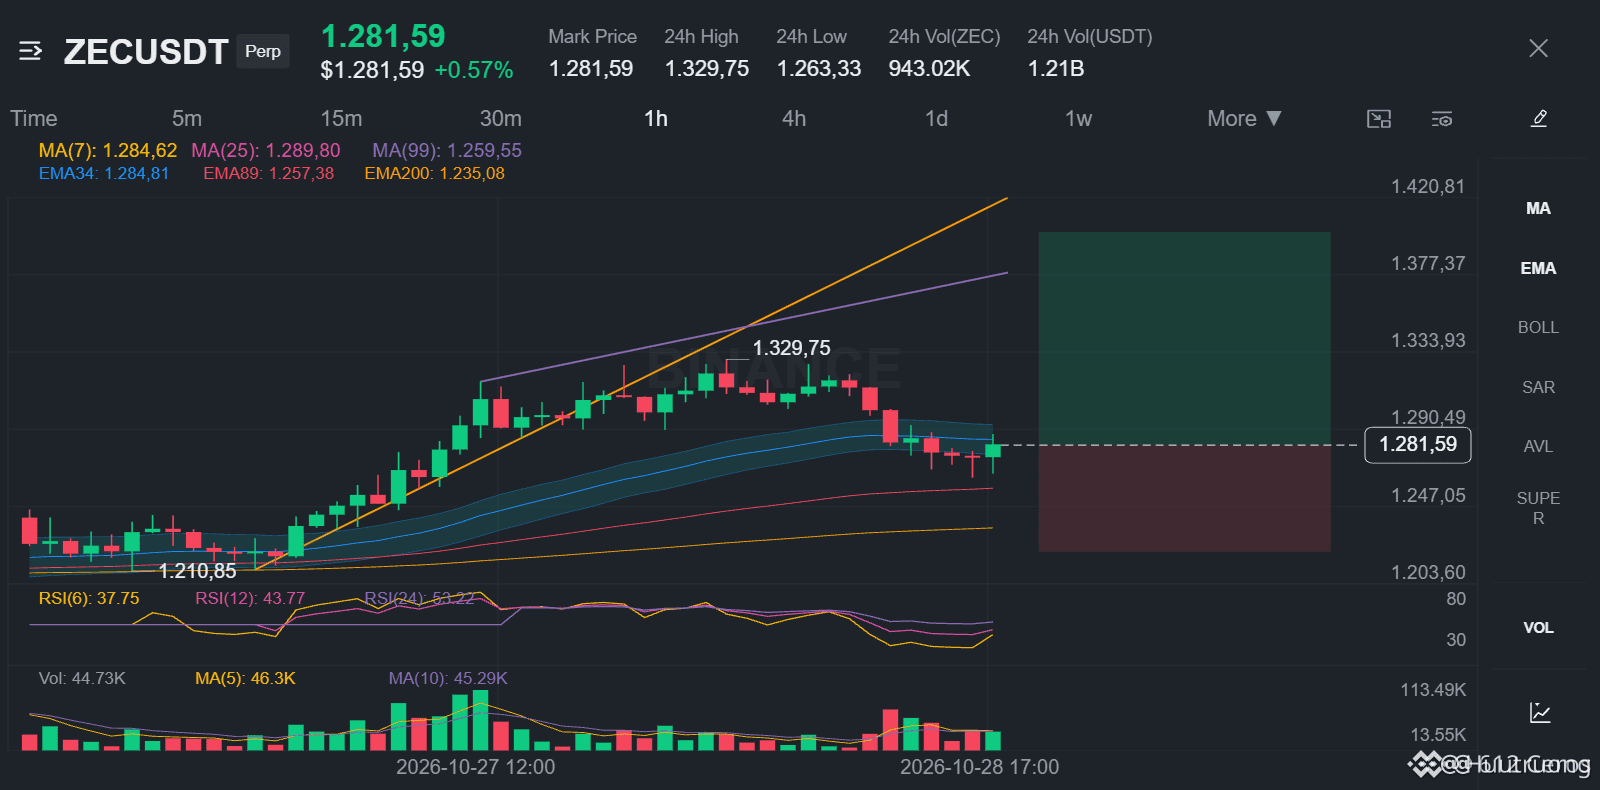
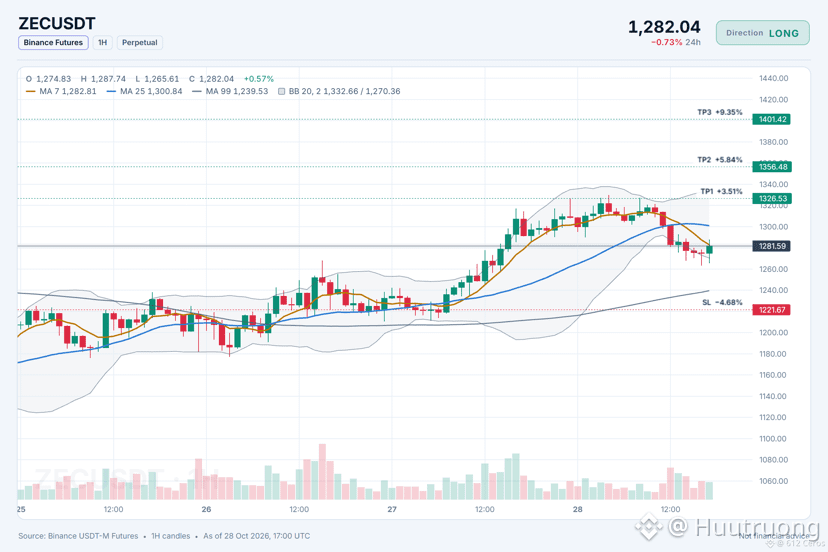
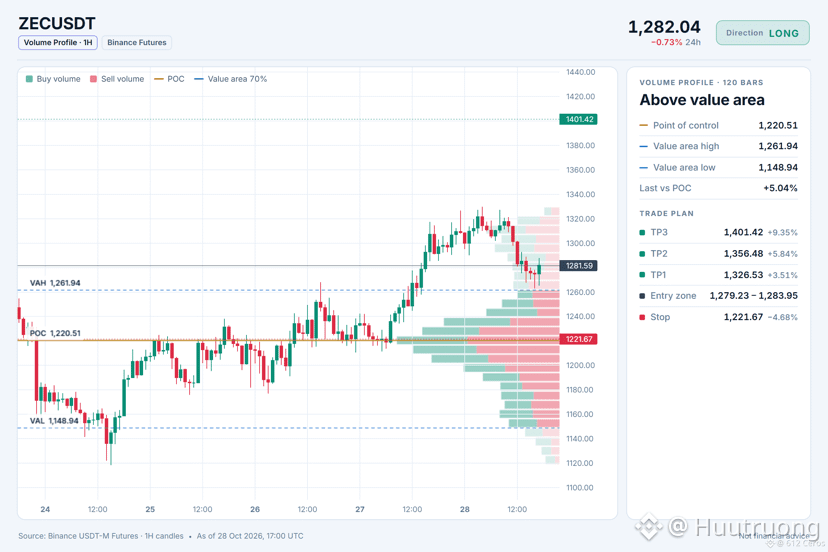
ZEC is quietly stacking one higher low after another.
🟢 LONG $ZEC /USDT: expecting price to go UP
Bias: LONG · Leaning
Entry: 1279.23 – 1283.95
TP1: 1326.53 (+3.5%)
TP2: 1356.48 (+5.8%)
TP3: 1401.42 (+9.4%)
SL: 1221.67 (-4.7%)
Plan: enter only inside the zone, close 50% at TP1, 25% at TP2, 25% at TP3, and move the stop to entry after TP1.
Note: moderate conviction only, keep size light.
Why LONG? 4/12 signals agree, 1 against.
• Daily trend up (above EMA50 & EMA200)
• 1h trend up (above EMA50 & EMA200)
• Buyers are driving the move (15m ADX 39.0)
Risk: Weaker than BTC (−1.68% 24h vs BTC)
Plan A:
The daily trend is bullish and the 1h trend is bullish, so price should push toward the daily resistance zone and the 4h RSI shows buyers still have momentum.
Plan B (invalidation):
If the daily trend breaks and price slices below the daily EMA200, I would exit and reassess.
Where would you put your stop on this setup?
{spot}(ZECUSDT)
ZEC is quietly stacking one higher low after another.
🟢 LONG $ZEC /USDT: expecting price to go UP
Bias: LONG · Leaning
Entry: 1279.23 – 1283.95
TP1: 1326.53 (+3.5%)
TP2: 1356.48 (+5.8%)
TP3: 1401.42 (+9.4%)
SL: 1221.67 (-4.7%)
Plan: enter only inside the zone, close 50% at TP1, 25% at TP2, 25% at TP3, and move the stop to entry after TP1.
Note: moderate conviction only, keep size light.
Why LONG? 4/12 signals agree, 1 against.
• Daily trend up (above EMA50 & EMA200)
• 1h trend up (above EMA50 & EMA200)
• Buyers are driving the move (15m ADX 39.0)
Risk: Weaker than BTC (−1.68% 24h vs BTC)
Plan A:
The daily trend is bullish and the 1h trend is bullish, so price should push toward the daily resistance zone and the 4h RSI shows buyers still have momentum.
Plan B (invalidation):
If the daily trend breaks and price slices below the daily EMA200, I would exit and reassess.
Where would you put your stop on this setup?
17
·
--
Рост
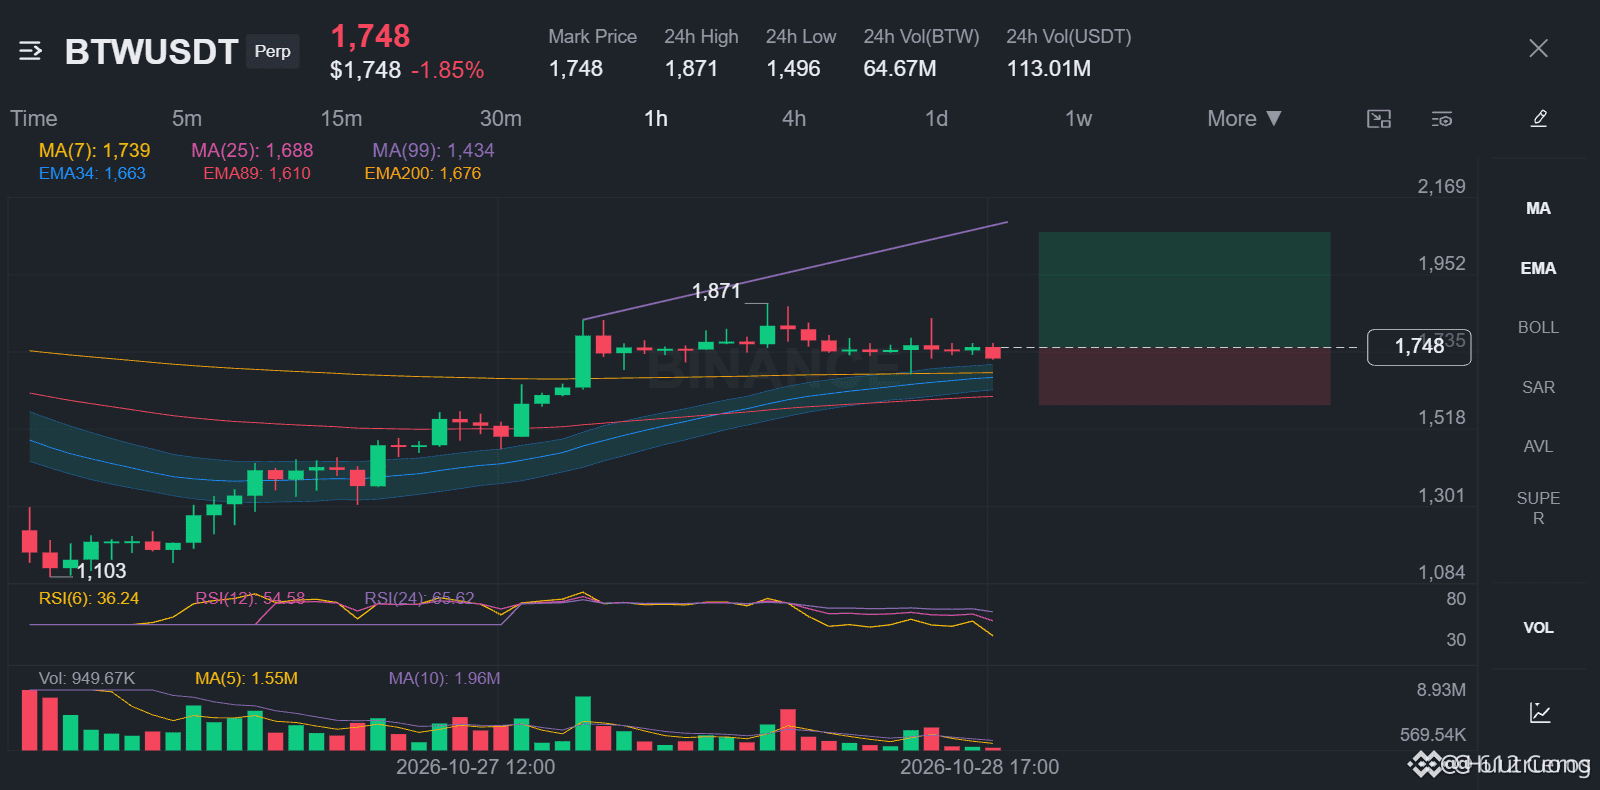
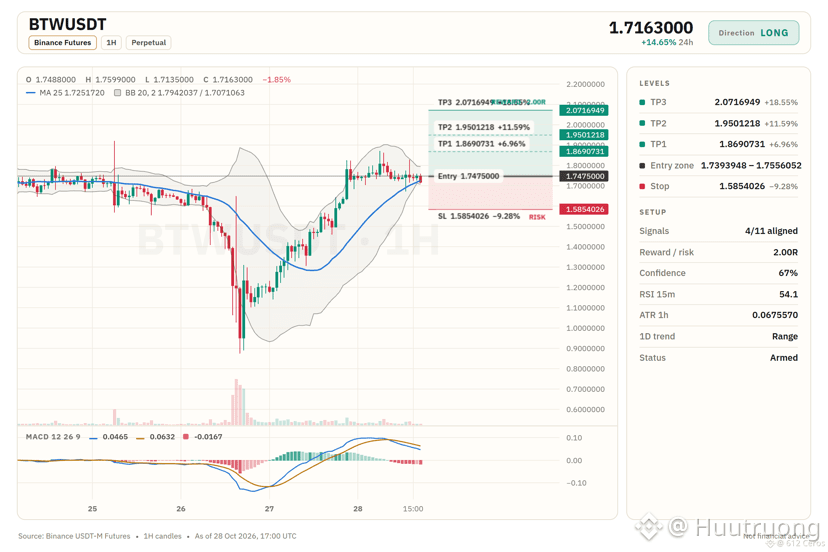
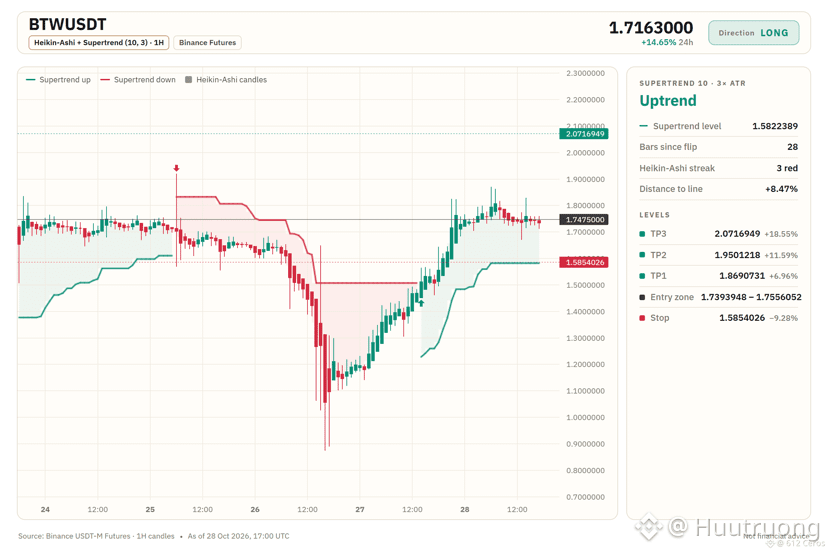
The 4h stack does not always mean a long is safe.
🟢 LONG $BTW /USDT: expecting price to go UP
Bias: LONG · Leaning
Entry: 1.7393948 – 1.7556052
TP1: 1.8690731 (+7.0%)
TP2: 1.9501218 (+11.6%)
TP3: 2.0716949 (+18.6%)
SL: 1.5854026 (-9.3%)
Plan: enter only inside the zone, close 50% at TP1, 25% at TP2, 25% at TP3, and move the stop to entry after TP1.
Note: moderate conviction only, keep size light.
Why LONG? BTW checklist: 4/11 agree, 0 against.
• 4h trend up (above EMA50 & EMA200)
• Buyers have the momentum (4h RSI 56.4)
• Buyers are pushing right now (+1.82% 15m candle)
Watch: The idea is wrong if price reaches the stop at 1.5854026
Verdict: The 4h bullish stack and buyers pressing now support the long, but the daily range and weak trend strength mean conviction is only moderate.
What level would make you cautious on this long?
{future}(BTWUSDT)
The 4h stack does not always mean a long is safe.
🟢 LONG $BTW /USDT: expecting price to go UP
Bias: LONG · Leaning
Entry: 1.7393948 – 1.7556052
TP1: 1.8690731 (+7.0%)
TP2: 1.9501218 (+11.6%)
TP3: 2.0716949 (+18.6%)
SL: 1.5854026 (-9.3%)
Plan: enter only inside the zone, close 50% at TP1, 25% at TP2, 25% at TP3, and move the stop to entry after TP1.
Note: moderate conviction only, keep size light.
Why LONG? BTW checklist: 4/11 agree, 0 against.
• 4h trend up (above EMA50 & EMA200)
• Buyers have the momentum (4h RSI 56.4)
• Buyers are pushing right now (+1.82% 15m candle)
Watch: The idea is wrong if price reaches the stop at 1.5854026
Verdict: The 4h bullish stack and buyers pressing now support the long, but the daily range and weak trend strength mean conviction is only moderate.
What level would make you cautious on this long?
19
·
--
Падение
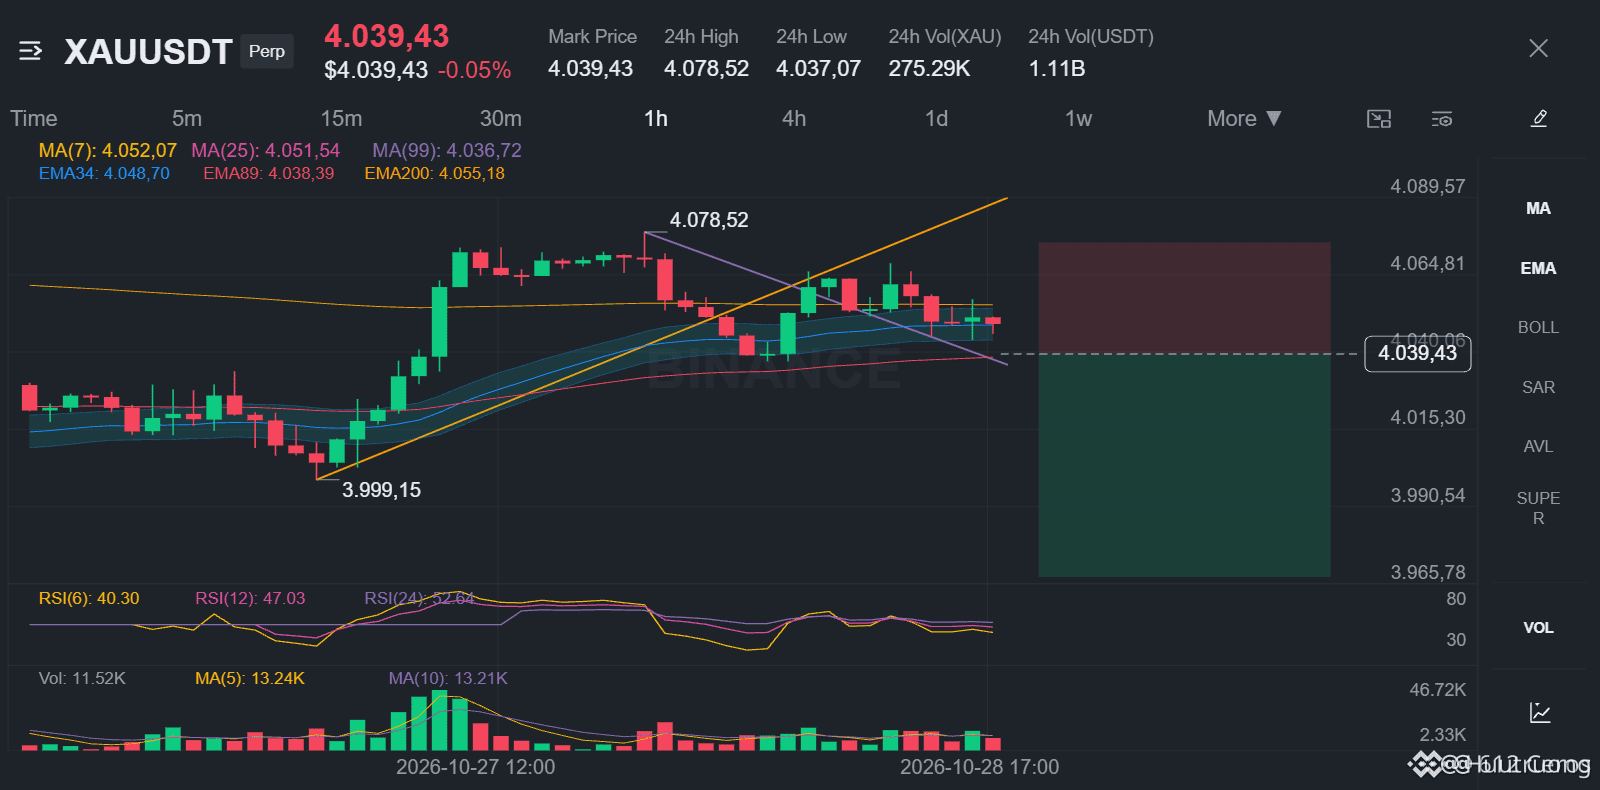
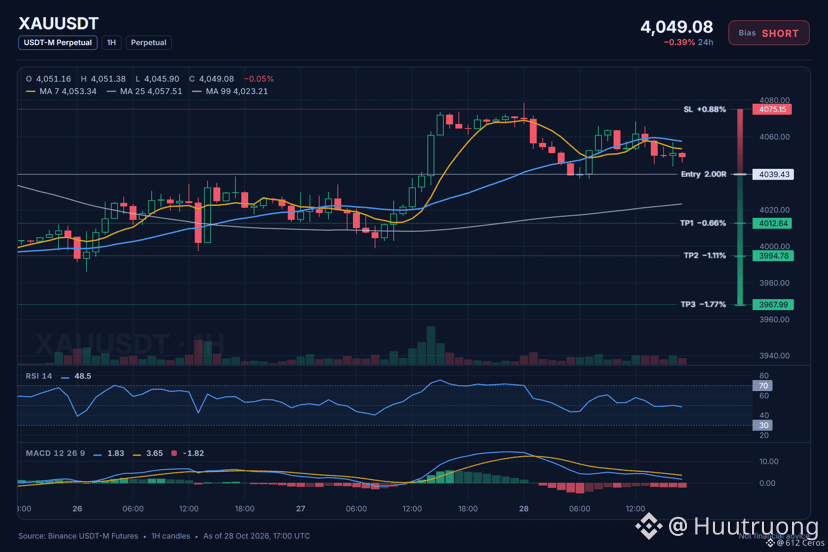
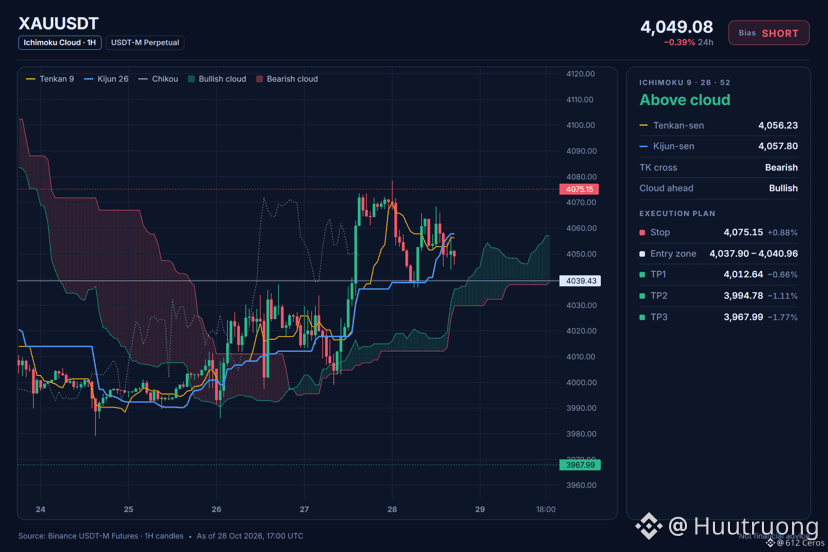
XAU shows a bearish stack across all timeframes
🔴 SHORT $XAU /USDT: expecting price to go DOWN
Bias: SHORT · Leaning
Entry: 4037.90 – 4040.96
TP1: 4012.64 (-0.7%)
TP2: 3994.78 (-1.1%)
TP3: 3967.99 (-1.8%)
SL: 4075.15 (+0.9%)
Plan: enter only inside the zone, close 50% at TP1, 25% at TP2, 25% at TP3, and move the stop to entry after TP1.
Note: moderate conviction only, keep size light.
Why SHORT? 5/12 signals agree, 0 against.
• Daily trend down (below EMA50 & EMA200)
• 4h trend down (below EMA50 & EMA200)
• 1h trend down (below EMA50 & EMA200)
Why now?
The daily trend is bearish, with price below both the EMA50 and EMA200. The 1h price is 4039.43, and the 1h ATR is 9.92, so sellers are driving the move with real volume behind it.
What is your invalidation level for XAU shorts?
{future}(XAUUSDT)
XAU shows a bearish stack across all timeframes
🔴 SHORT $XAU /USDT: expecting price to go DOWN
Bias: SHORT · Leaning
Entry: 4037.90 – 4040.96
TP1: 4012.64 (-0.7%)
TP2: 3994.78 (-1.1%)
TP3: 3967.99 (-1.8%)
SL: 4075.15 (+0.9%)
Plan: enter only inside the zone, close 50% at TP1, 25% at TP2, 25% at TP3, and move the stop to entry after TP1.
Note: moderate conviction only, keep size light.
Why SHORT? 5/12 signals agree, 0 against.
• Daily trend down (below EMA50 & EMA200)
• 4h trend down (below EMA50 & EMA200)
• 1h trend down (below EMA50 & EMA200)
Why now?
The daily trend is bearish, with price below both the EMA50 and EMA200. The 1h price is 4039.43, and the 1h ATR is 9.92, so sellers are driving the move with real volume behind it.
What is your invalidation level for XAU shorts?
28
·
--
Падение
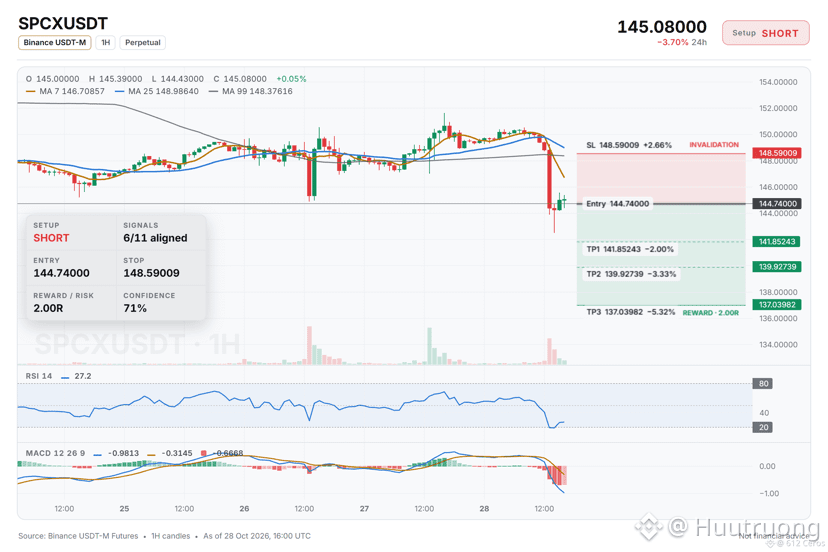
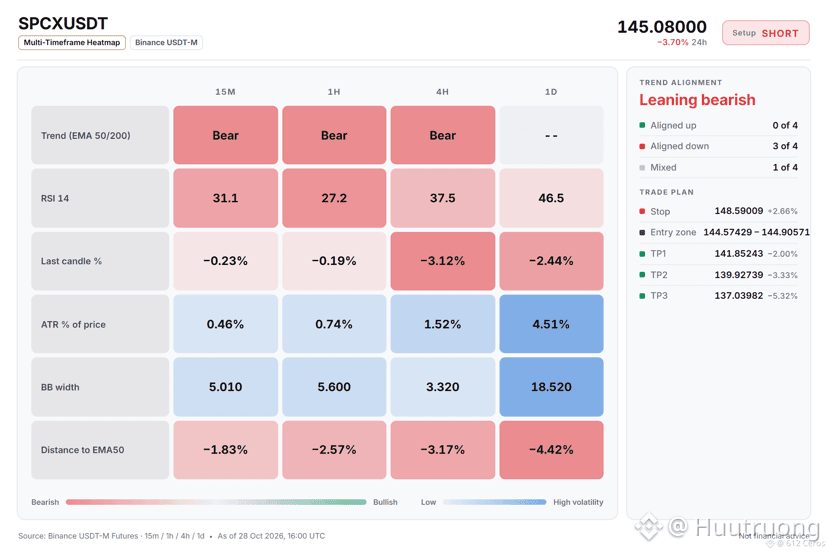
SPCX is not stuck in a range
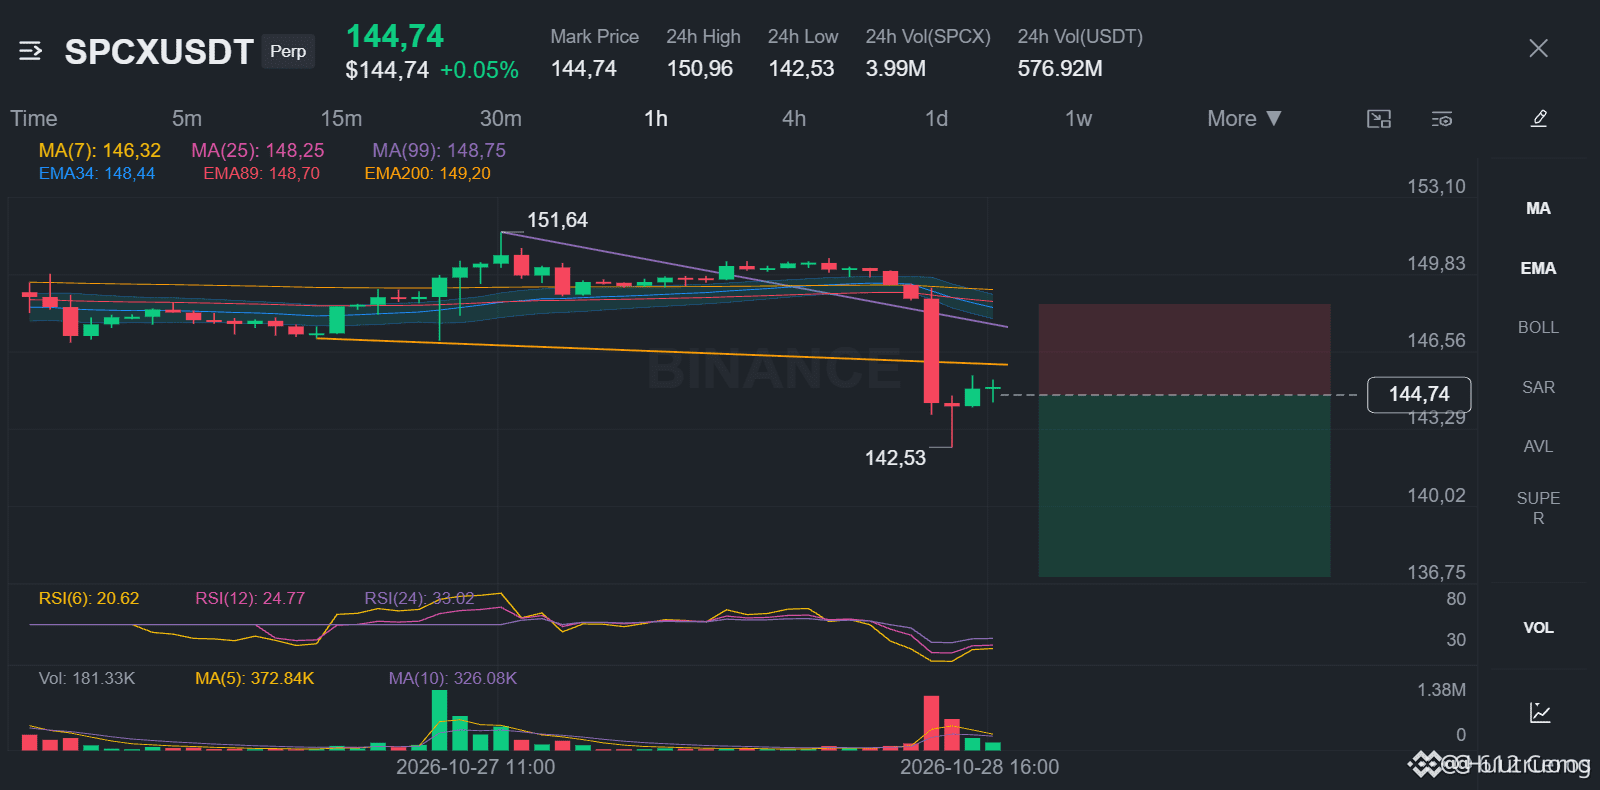
🔴 SHORT $SPCX /USDT: expecting price to go DOWN
Bias: SHORT · Strong
Entry: 144.57429 – 144.90571
TP1: 141.85243 (-2.0%)
TP2: 139.92739 (-3.3%)
TP3: 137.03982 (-5.3%)
SL: 148.59009 (+2.7%)
Plan: enter only inside the zone, close 50% at TP1, 25% at TP2, 25% at TP3, and move the stop to entry after TP1.
Why SHORT? 6/11 signals agree, 1 against.
• 4h trend down (below EMA50 & EMA200)
• 1h trend down (below EMA50 & EMA200)
• Sellers are driving the move (15m ADX 50.9)
Risk: Far below its average, bounce likely (−3.6 ATR from 1h EMA50)
Journal note: SPCX
I'm watching the 4h chart for a short entry. The 4h trend shows price below EMA50 and EMA200, a bearish stack. I want to see price hold below the 1h EMA50 to confirm the move down. The 1h RSI is 27.2, meaning sellers have strong momentum.
Where is your invalidation level for SPCX?
{future}(SPCXUSDT)
SPCX is not stuck in a range
🔴 SHORT $SPCX /USDT: expecting price to go DOWN
Bias: SHORT · Strong
Entry: 144.57429 – 144.90571
TP1: 141.85243 (-2.0%)
TP2: 139.92739 (-3.3%)
TP3: 137.03982 (-5.3%)
SL: 148.59009 (+2.7%)
Plan: enter only inside the zone, close 50% at TP1, 25% at TP2, 25% at TP3, and move the stop to entry after TP1.
Why SHORT? 6/11 signals agree, 1 against.
• 4h trend down (below EMA50 & EMA200)
• 1h trend down (below EMA50 & EMA200)
• Sellers are driving the move (15m ADX 50.9)
Risk: Far below its average, bounce likely (−3.6 ATR from 1h EMA50)
Journal note: SPCX
I'm watching the 4h chart for a short entry. The 4h trend shows price below EMA50 and EMA200, a bearish stack. I want to see price hold below the 1h EMA50 to confirm the move down. The 1h RSI is 27.2, meaning sellers have strong momentum.
Where is your invalidation level for SPCX?
6
·
--
Падение
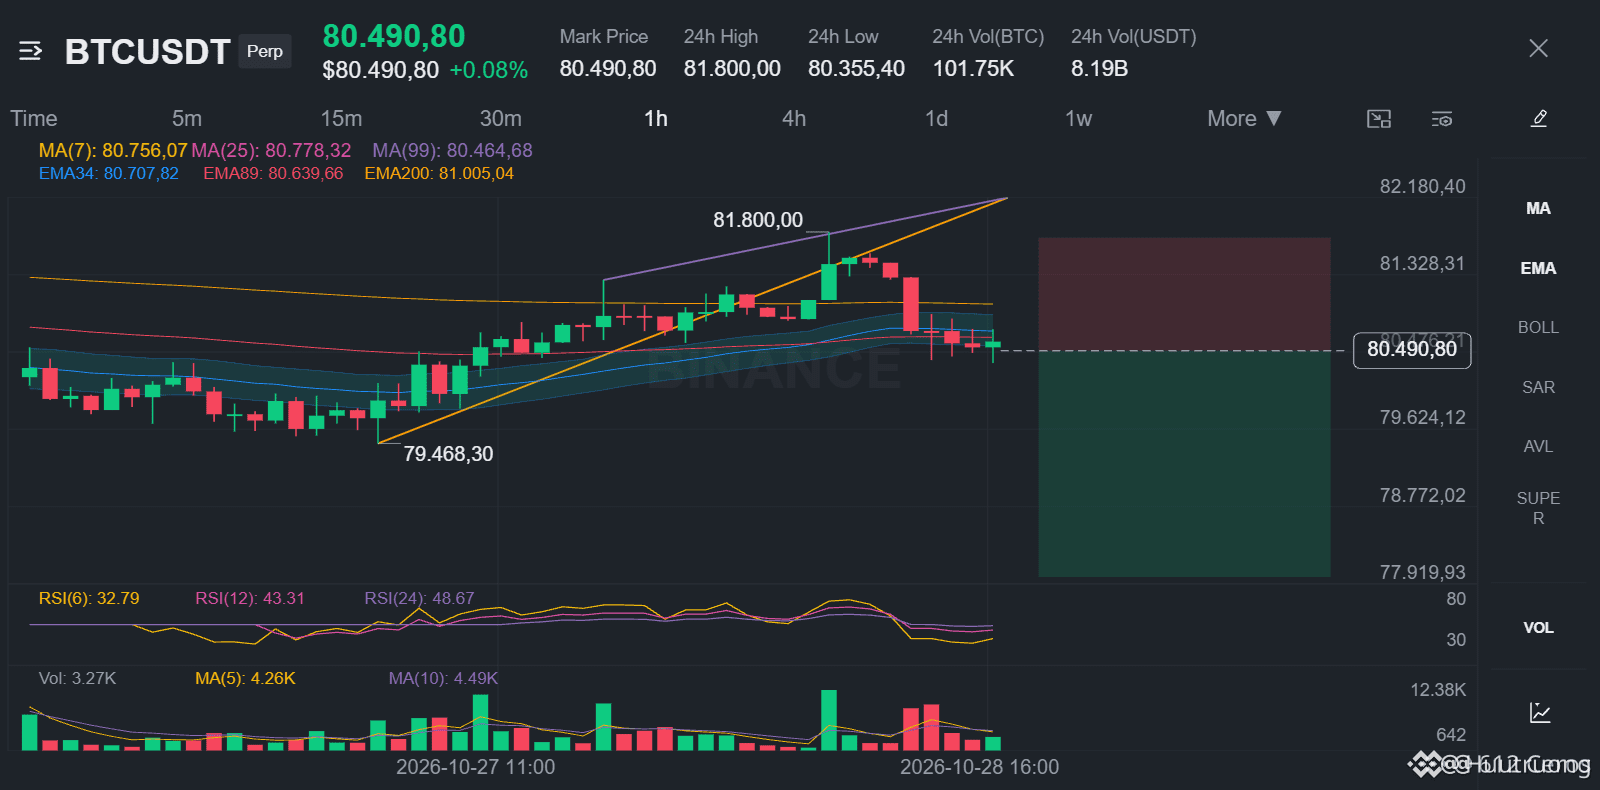
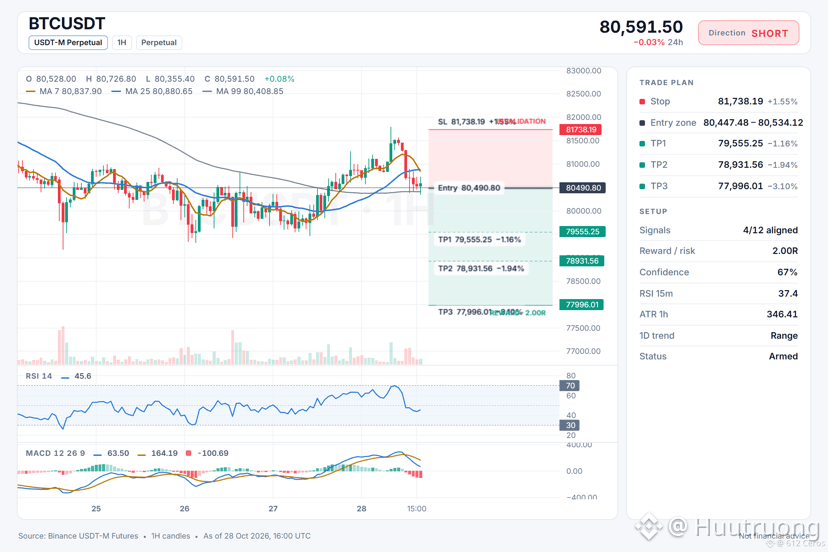
Can the daily range trap short sellers?
🔴 SHORT $BTC /USDT: expecting price to go DOWN
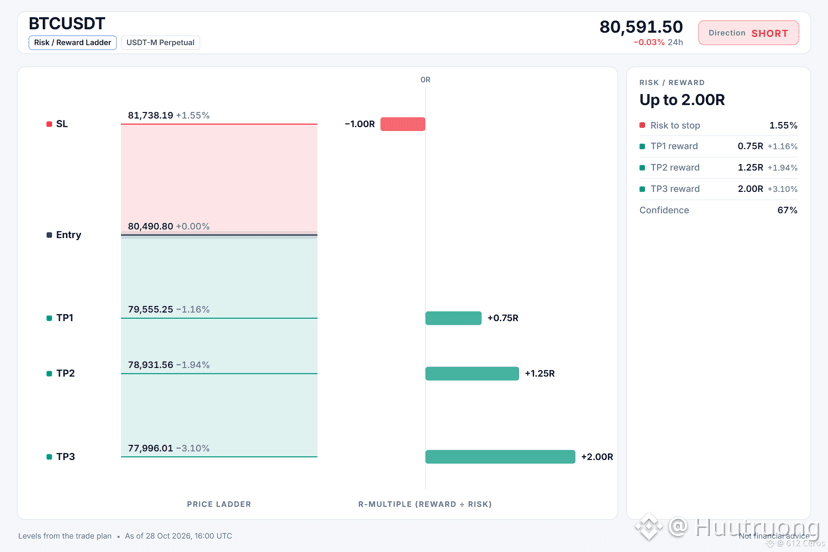
Bias: SHORT · Leaning
Entry: 80447.48 – 80534.12
TP1: 79555.25 (-1.2%)
TP2: 78931.56 (-1.9%)
TP3: 77996.01 (-3.1%)
SL: 81738.19 (+1.5%)
Plan: enter only inside the zone, close 50% at TP1, 25% at TP2, 25% at TP3, and move the stop to entry after TP1.
Note: moderate conviction only, keep size light.
Why SHORT? 4/12 signals agree, 0 against.
• 4h trend down (below EMA50 & EMA200)
• 1h trend down (below EMA50 & EMA200)
• Sellers are driving the move (15m ADX 24.5)
Quick BTC read:
1/3 The daily trend is range-bound, and the 1h trend is down with price below stacked bearish averages.
2/3 The 1h RSI is 37.4, meaning momentum is already weak and leaning lower.
3/3 The 4h RSI is 47.6, which means momentum is neutral and could reverse the move.
What is your invalidation level if you are leaning long?
{spot}(BTCUSDT)
Can the daily range trap short sellers?
🔴 SHORT $BTC /USDT: expecting price to go DOWN
Bias: SHORT · Leaning
Entry: 80447.48 – 80534.12
TP1: 79555.25 (-1.2%)
TP2: 78931.56 (-1.9%)
TP3: 77996.01 (-3.1%)
SL: 81738.19 (+1.5%)
Plan: enter only inside the zone, close 50% at TP1, 25% at TP2, 25% at TP3, and move the stop to entry after TP1.
Note: moderate conviction only, keep size light.
Why SHORT? 4/12 signals agree, 0 against.
• 4h trend down (below EMA50 & EMA200)
• 1h trend down (below EMA50 & EMA200)
• Sellers are driving the move (15m ADX 24.5)
Quick BTC read:
1/3 The daily trend is range-bound, and the 1h trend is down with price below stacked bearish averages.
2/3 The 1h RSI is 37.4, meaning momentum is already weak and leaning lower.
3/3 The 4h RSI is 47.6, which means momentum is neutral and could reverse the move.
What is your invalidation level if you are leaning long?
13
·
--
Рост
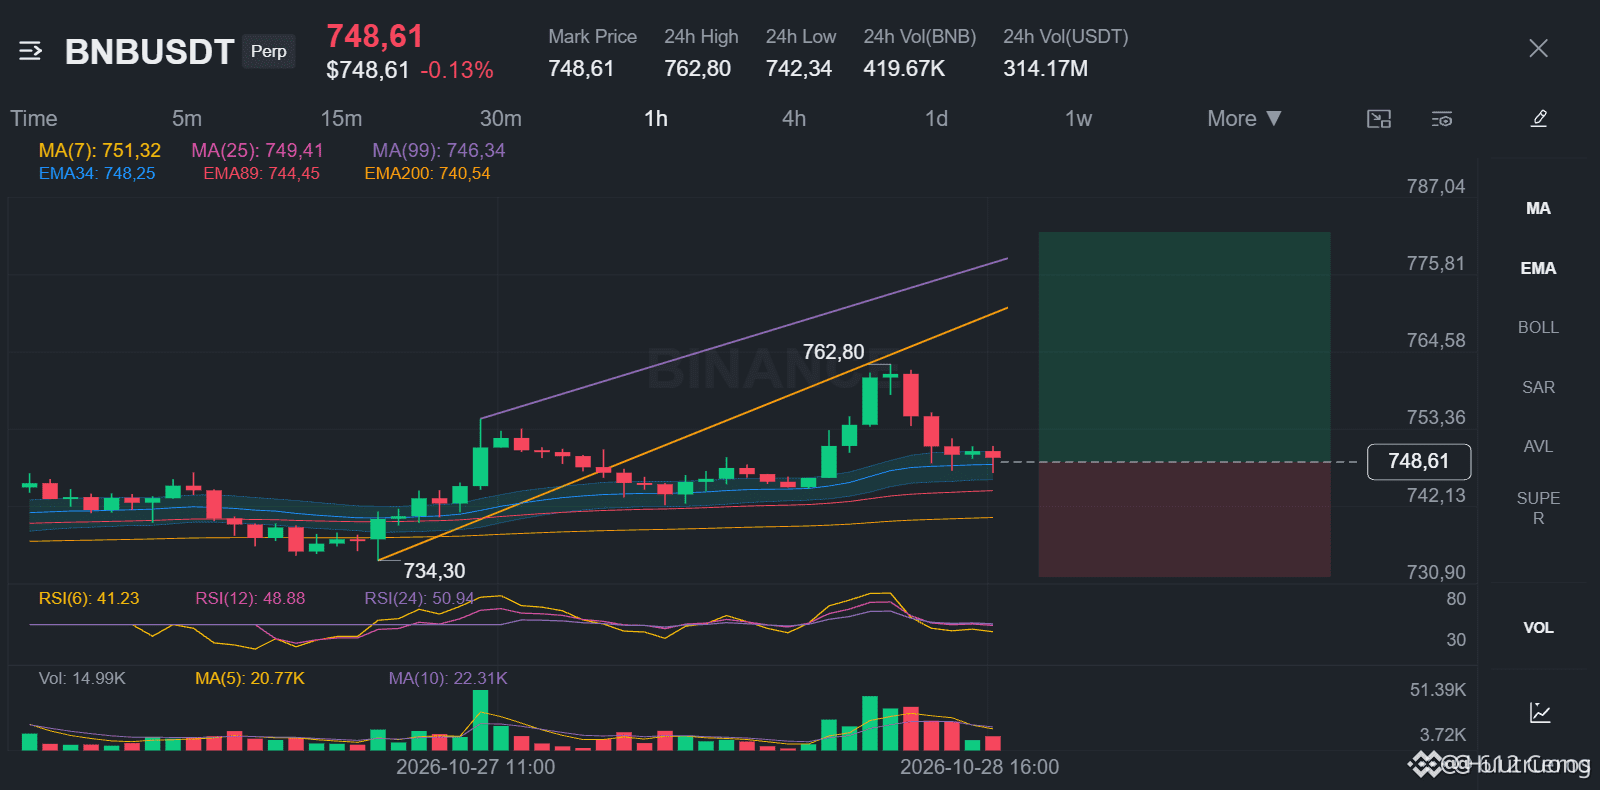
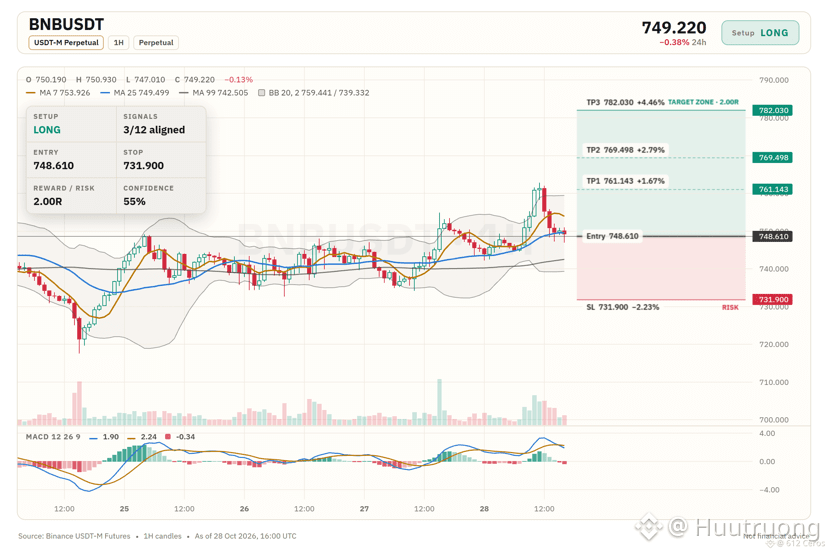
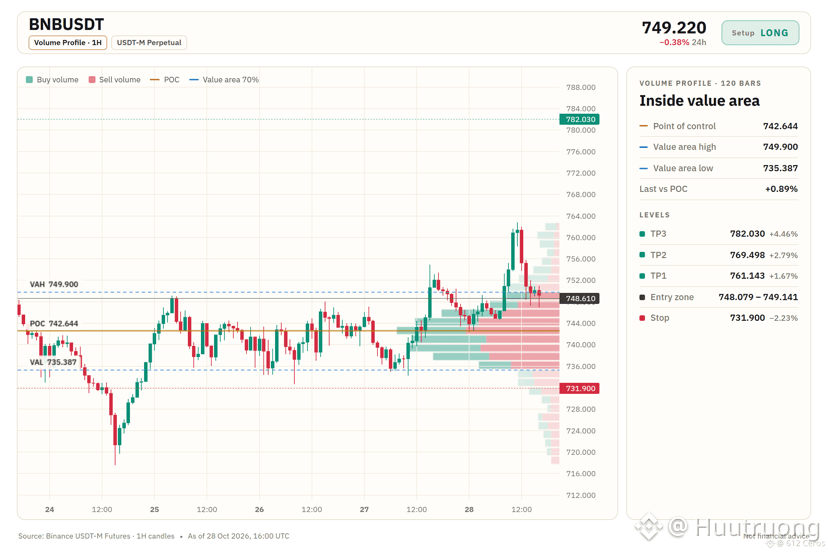
BNB sits above stacked averages while sellers drive the move.
🟢 LONG $BNB /USDT: expecting price to go UP
Bias: LONG · Leaning
Entry: 748.079 – 749.141
TP1: 761.143 (+1.7%)
TP2: 769.498 (+2.8%)
TP3: 782.030 (+4.5%)
SL: 731.900 (-2.2%)
Plan: enter only inside the zone, close 50% at TP1, 25% at TP2, 25% at TP3, and move the stop to entry after TP1.
Note: moderate conviction only, keep size light.
Why LONG? 3/12 signals agree, 2 against.
• Daily trend up (above EMA50 & EMA200)
• 1h trend up (above EMA50 & EMA200)
• Buyers have the momentum (4h RSI 55.0)
Risk: Sellers are driving the move (15m ADX 30.4)
Q: Why go long with only 3 of 12 signals aligned?
A: The daily and 1h trends both show bullish stacked EMAs, which supports patience.
Q: When does this setup turn wrong?
A: A break below 731.900 invalidates the long and limits downside to one ATR.
Where would you place your stop if you were on the other side?
{spot}(BNBUSDT)
BNB sits above stacked averages while sellers drive the move.
🟢 LONG $BNB /USDT: expecting price to go UP
Bias: LONG · Leaning
Entry: 748.079 – 749.141
TP1: 761.143 (+1.7%)
TP2: 769.498 (+2.8%)
TP3: 782.030 (+4.5%)
SL: 731.900 (-2.2%)
Plan: enter only inside the zone, close 50% at TP1, 25% at TP2, 25% at TP3, and move the stop to entry after TP1.
Note: moderate conviction only, keep size light.
Why LONG? 3/12 signals agree, 2 against.
• Daily trend up (above EMA50 & EMA200)
• 1h trend up (above EMA50 & EMA200)
• Buyers have the momentum (4h RSI 55.0)
Risk: Sellers are driving the move (15m ADX 30.4)
Q: Why go long with only 3 of 12 signals aligned?
A: The daily and 1h trends both show bullish stacked EMAs, which supports patience.
Q: When does this setup turn wrong?
A: A break below 731.900 invalidates the long and limits downside to one ATR.
Where would you place your stop if you were on the other side?
15
·
--
Падение
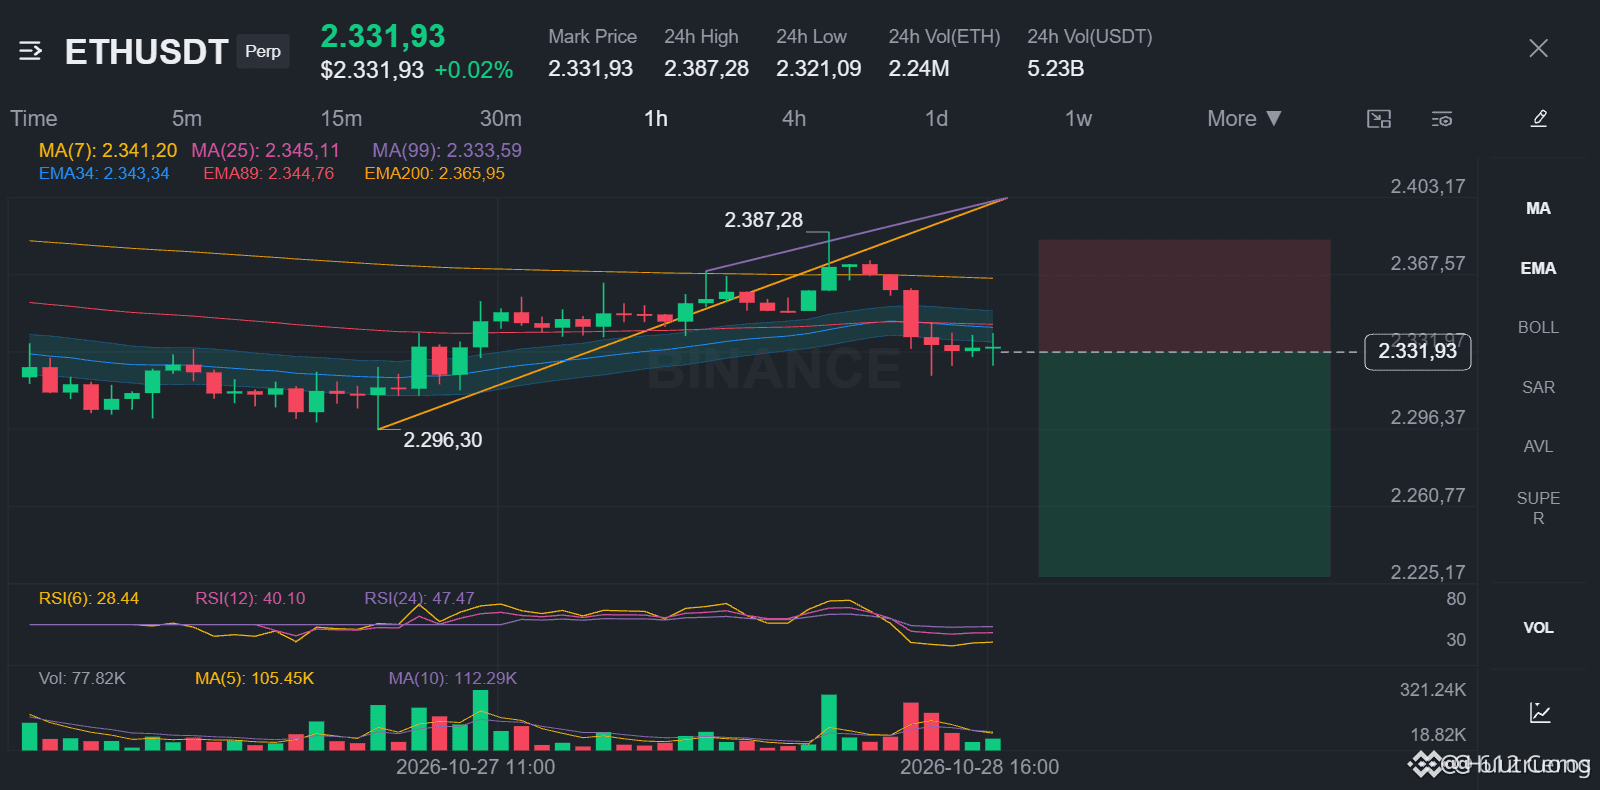
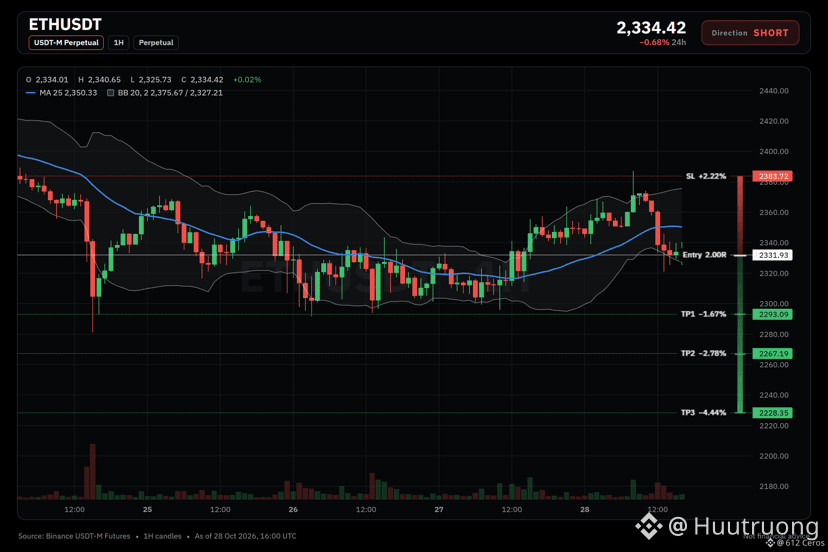
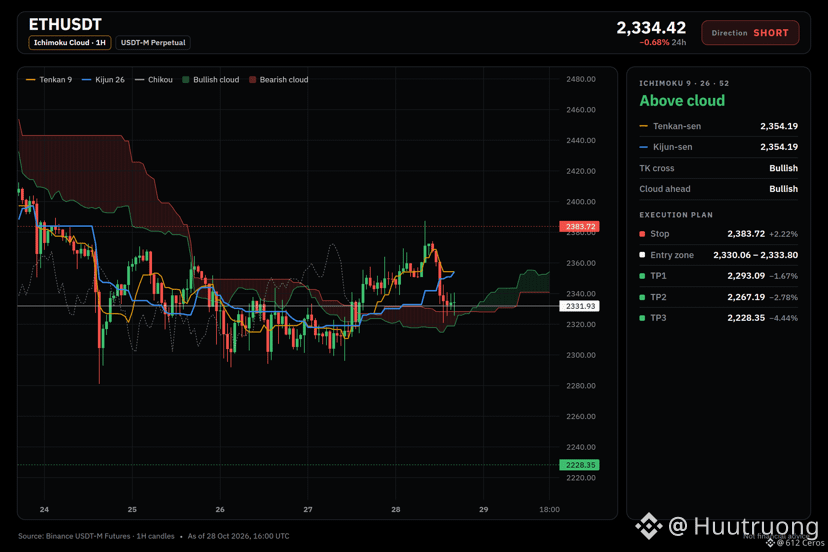
ETH short setup: the levels I'm watching
🔴 SHORT $ETH /USDT: expecting price to go DOWN
Bias: SHORT · Strong
Entry: 2330.06 – 2333.80
TP1: 2293.09 (-1.7%)
TP2: 2267.19 (-2.8%)
TP3: 2228.35 (-4.4%)
SL: 2383.72 (+2.2%)
Plan: enter only inside the zone, close 50% at TP1, 25% at TP2, 25% at TP3, and move the stop to entry after TP1.
Why SHORT? 6/12 signals agree, 0 against.
• 4h trend down (below EMA50 & EMA200)
• 1h trend down (below EMA50 & EMA200)
• Sellers are driving the move (15m ADX 29.6)
The reasoning:
The daily trend reads range, and 6/12 signals aligned favour the short side. The plan is to work the 2330.06 – 2333.80 zone, scale out at 2293.09 and 2267.19, and stay patient for 2228.35. A move through 2383.72 means the idea is wrong and the stop does its job.
Does ETH tag 2293.09 first, or the stop?
{spot}(ETHUSDT)
ETH short setup: the levels I'm watching
🔴 SHORT $ETH /USDT: expecting price to go DOWN
Bias: SHORT · Strong
Entry: 2330.06 – 2333.80
TP1: 2293.09 (-1.7%)
TP2: 2267.19 (-2.8%)
TP3: 2228.35 (-4.4%)
SL: 2383.72 (+2.2%)
Plan: enter only inside the zone, close 50% at TP1, 25% at TP2, 25% at TP3, and move the stop to entry after TP1.
Why SHORT? 6/12 signals agree, 0 against.
• 4h trend down (below EMA50 & EMA200)
• 1h trend down (below EMA50 & EMA200)
• Sellers are driving the move (15m ADX 29.6)
The reasoning:
The daily trend reads range, and 6/12 signals aligned favour the short side. The plan is to work the 2330.06 – 2333.80 zone, scale out at 2293.09 and 2267.19, and stay patient for 2228.35. A move through 2383.72 means the idea is wrong and the stop does its job.
Does ETH tag 2293.09 first, or the stop?
14
·
--
Падение
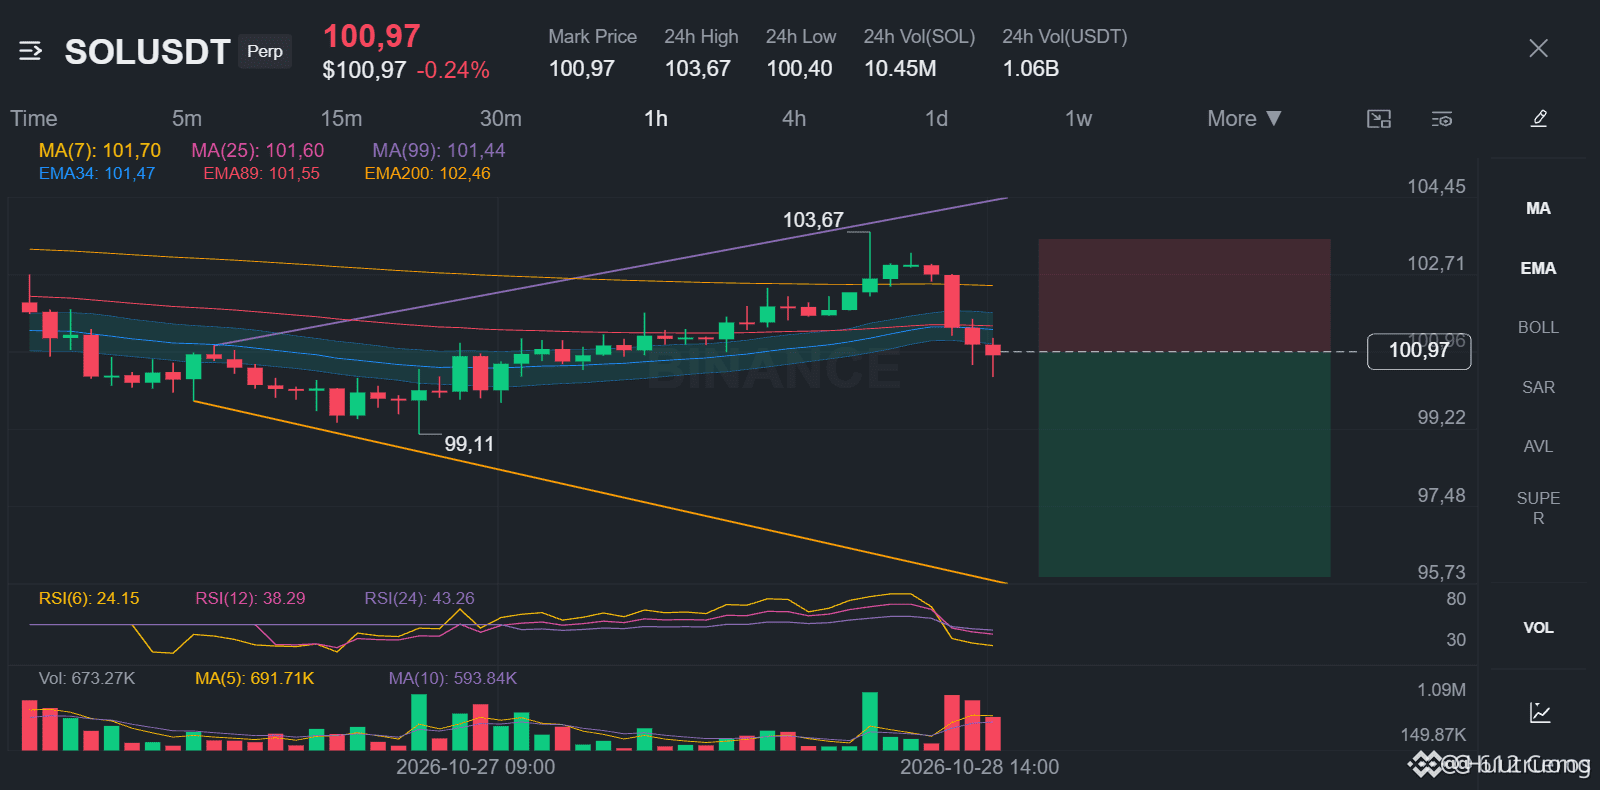
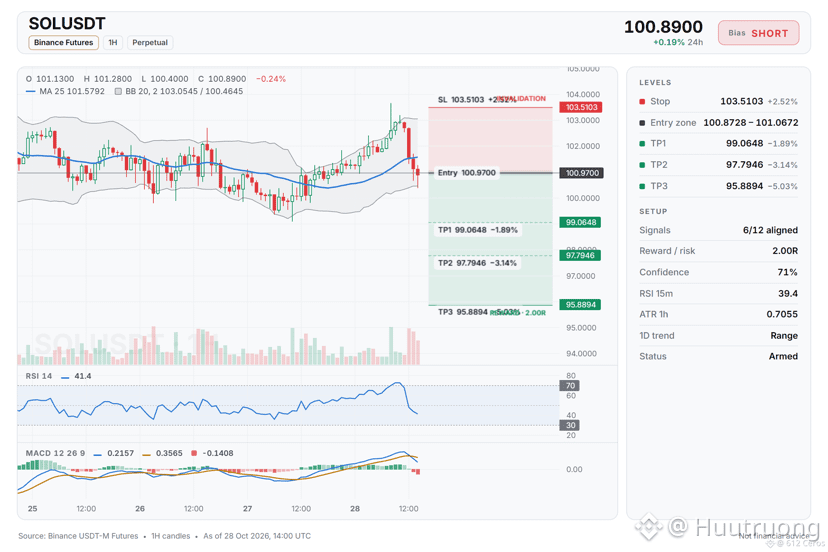
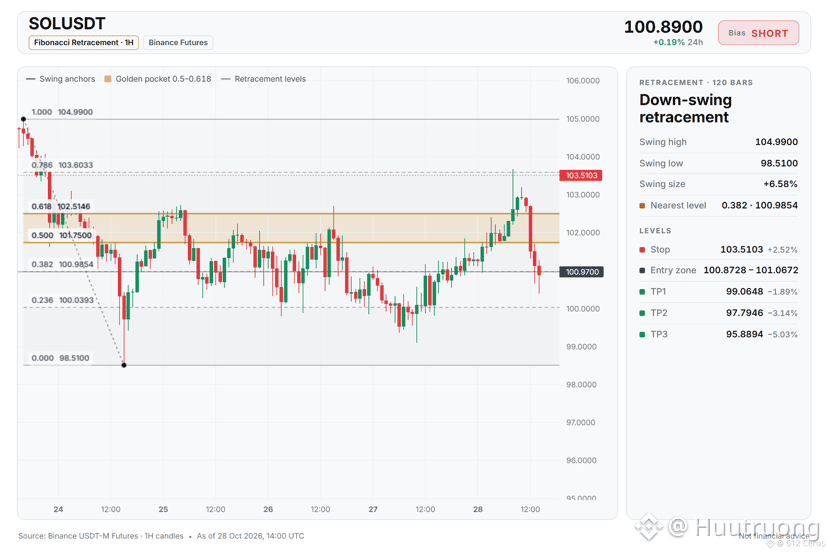
SOL is trading below stacked bearish averages on the 4h.
🔴 SHORT $SOL /USDT: expecting price to go DOWN
Bias: SHORT · Strong
Entry: 100.8728 – 101.0672
TP1: 99.0648 (-1.9%)
TP2: 97.7946 (-3.1%)
TP3: 95.8894 (-5.0%)
SL: 103.5103 (+2.5%)
Plan: enter only inside the zone, close 50% at TP1, 25% at TP2, 25% at TP3, and move the stop to entry after TP1.
Why SHORT? 6/12 signals agree, 1 against.
• 4h trend down (below EMA50 & EMA200)
• 1h trend down (below EMA50 & EMA200)
• Sellers are driving the move (15m ADX 35.0)
Risk: Buyers have the momentum (4h RSI 56.5)
If it plays out:
If the setup works, price continues down toward the 4h EMA50 then EMA200, with sellers still in control as the ADX shows strong directional movement.
If it fails:
If 4h RSI pushes back above 55, it would prove buyers have momentum and I would exit the short at the stop loss.
Where would you place your invalidation level?
{spot}(SOLUSDT)
SOL is trading below stacked bearish averages on the 4h.
🔴 SHORT $SOL /USDT: expecting price to go DOWN
Bias: SHORT · Strong
Entry: 100.8728 – 101.0672
TP1: 99.0648 (-1.9%)
TP2: 97.7946 (-3.1%)
TP3: 95.8894 (-5.0%)
SL: 103.5103 (+2.5%)
Plan: enter only inside the zone, close 50% at TP1, 25% at TP2, 25% at TP3, and move the stop to entry after TP1.
Why SHORT? 6/12 signals agree, 1 against.
• 4h trend down (below EMA50 & EMA200)
• 1h trend down (below EMA50 & EMA200)
• Sellers are driving the move (15m ADX 35.0)
Risk: Buyers have the momentum (4h RSI 56.5)
If it plays out:
If the setup works, price continues down toward the 4h EMA50 then EMA200, with sellers still in control as the ADX shows strong directional movement.
If it fails:
If 4h RSI pushes back above 55, it would prove buyers have momentum and I would exit the short at the stop loss.
Where would you place your invalidation level?
23
·
--
Рост
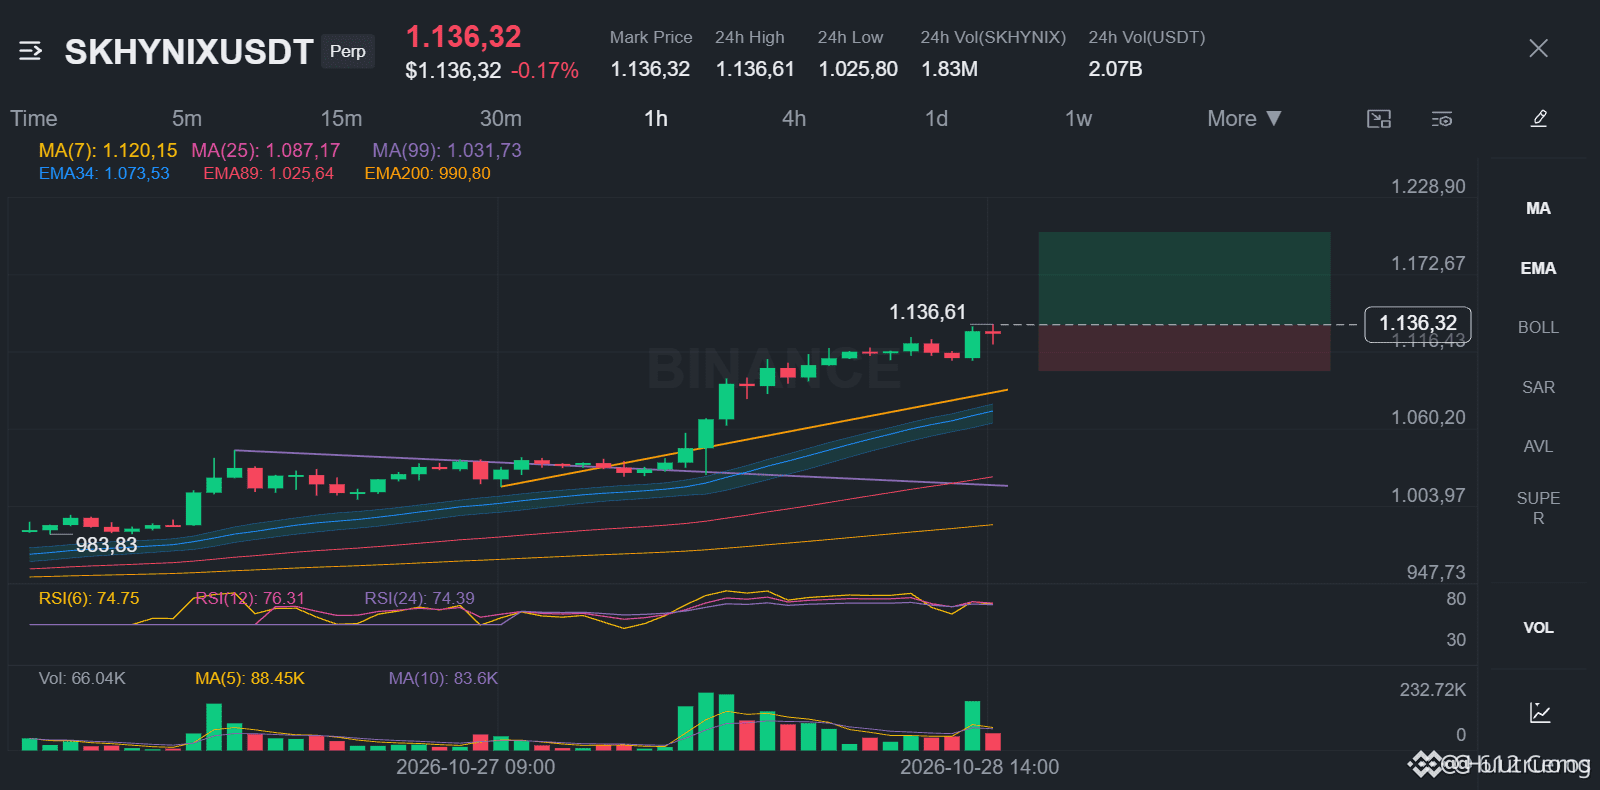
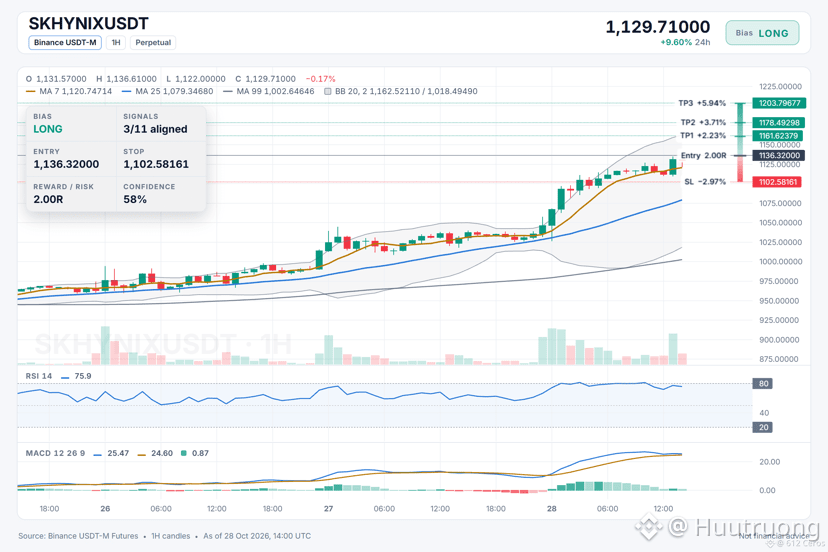
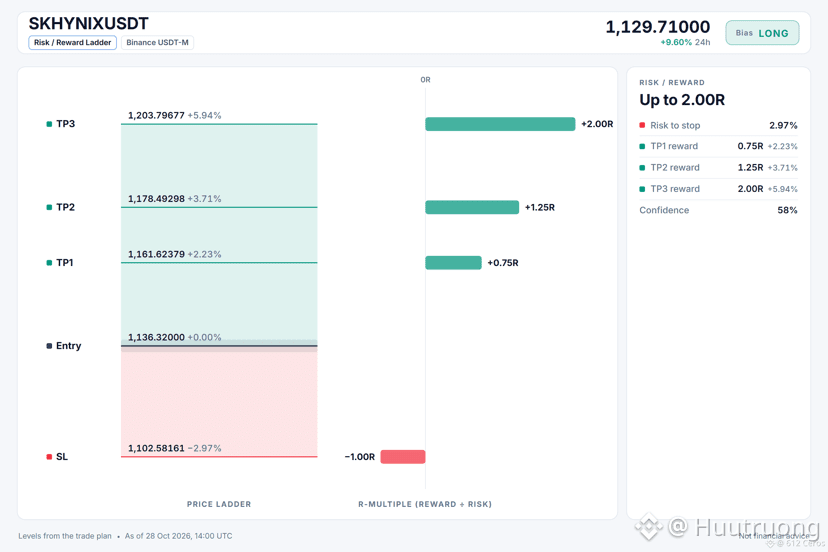
🟢 LONG $SKHYNIX /USDT: expecting price to go UP
Bias: LONG · Leaning
Entry: 1134.41702 – 1138.22298
TP1: 1161.62379 (+2.2%)
TP2: 1178.49298 (+3.7%)
TP3: 1203.79677 (+5.9%)
SL: 1102.58161 (-3.0%)
Plan: enter only inside the zone, close 50% at TP1, 25% at TP2, 25% at TP3, and move the stop to entry after TP1.
Note: moderate conviction only, keep size light.
Why is SKHYNIX still climbing when the daily trend is range-bound?
Why LONG? 3/11 signals agree, 1 against.
• 1h trend up (above EMA50 & EMA200)
• Buyers are driving the move (15m ADX 39.8)
• Stronger than BTC (+9.52% 24h vs BTC)
Risk: Price ran hot, pullbacks are common from here (4h RSI 82.6, overbought)
The 1h price sits above a bullish EMA stack and buyers control the move with ADX near 40. The 1h RSI reads 69.16, showing momentum without extreme overextension.
What is your invalidation level if the 1h trend breaks?
{future}(SKHYNIXUSDT)
🟢 LONG $SKHYNIX /USDT: expecting price to go UP
Bias: LONG · Leaning
Entry: 1134.41702 – 1138.22298
TP1: 1161.62379 (+2.2%)
TP2: 1178.49298 (+3.7%)
TP3: 1203.79677 (+5.9%)
SL: 1102.58161 (-3.0%)
Plan: enter only inside the zone, close 50% at TP1, 25% at TP2, 25% at TP3, and move the stop to entry after TP1.
Note: moderate conviction only, keep size light.
Why is SKHYNIX still climbing when the daily trend is range-bound?
Why LONG? 3/11 signals agree, 1 against.
• 1h trend up (above EMA50 & EMA200)
• Buyers are driving the move (15m ADX 39.8)
• Stronger than BTC (+9.52% 24h vs BTC)
Risk: Price ran hot, pullbacks are common from here (4h RSI 82.6, overbought)
The 1h price sits above a bullish EMA stack and buyers control the move with ADX near 40. The 1h RSI reads 69.16, showing momentum without extreme overextension.
What is your invalidation level if the 1h trend breaks?
23
·
--
Падение
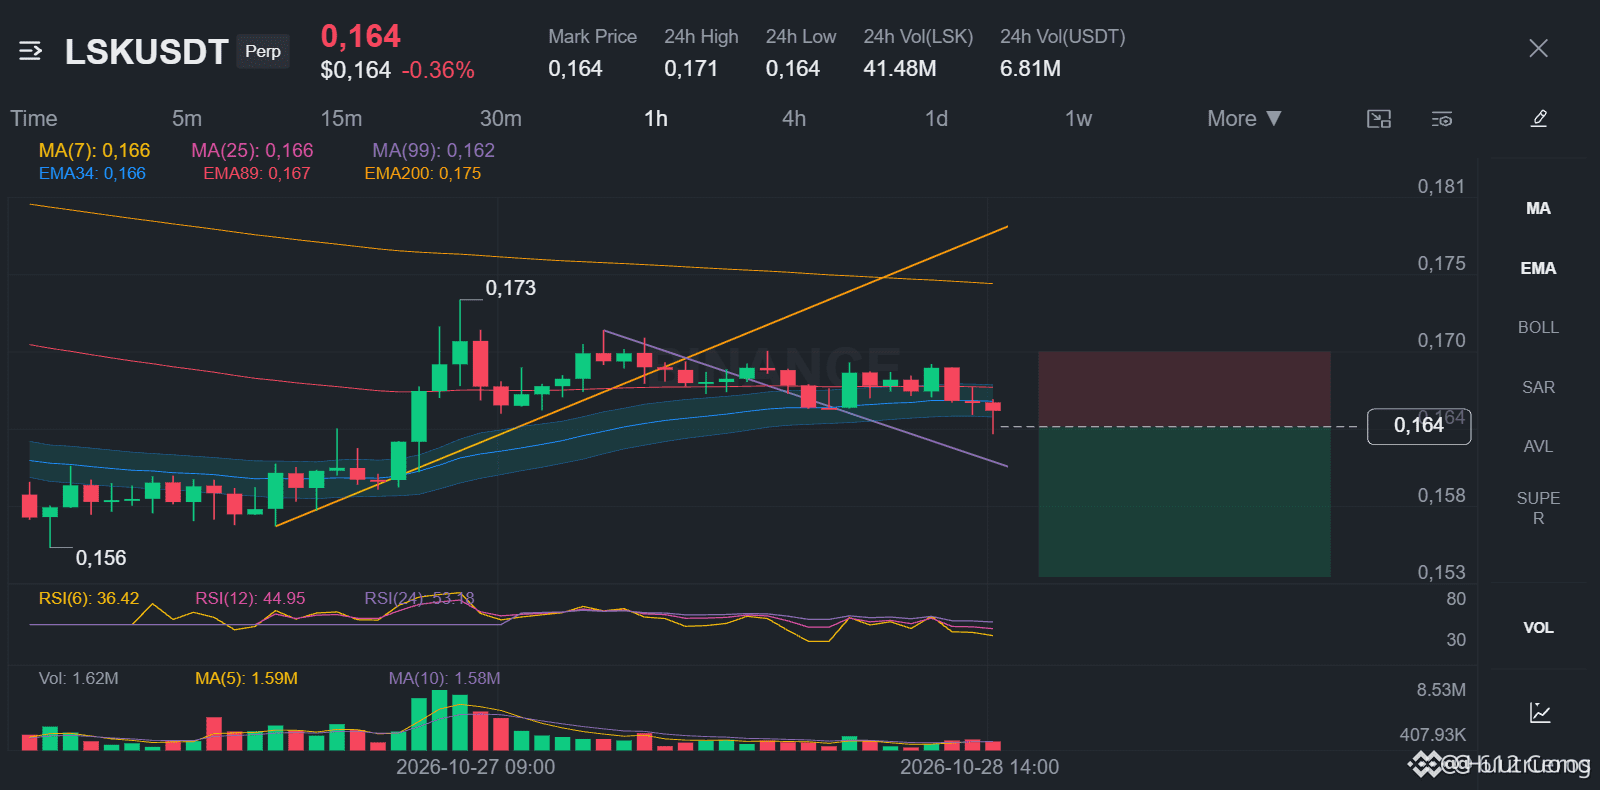
LSK is sliding in a clear bearish stack
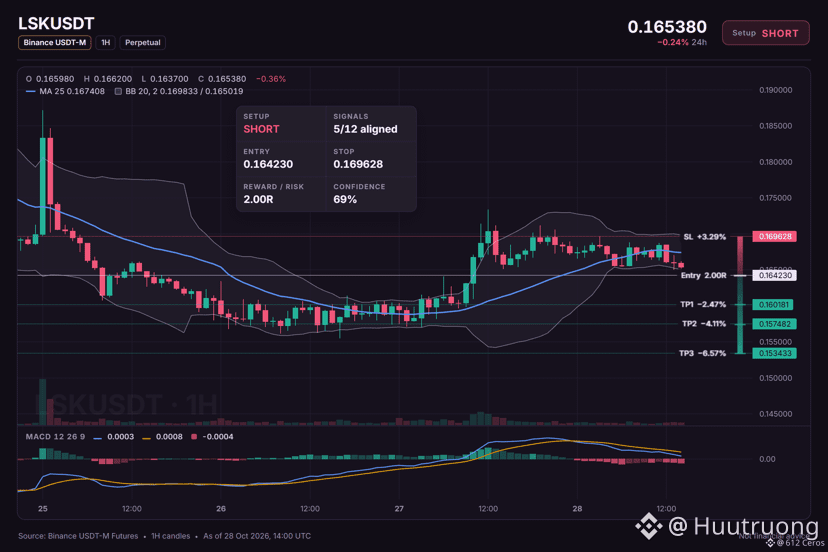
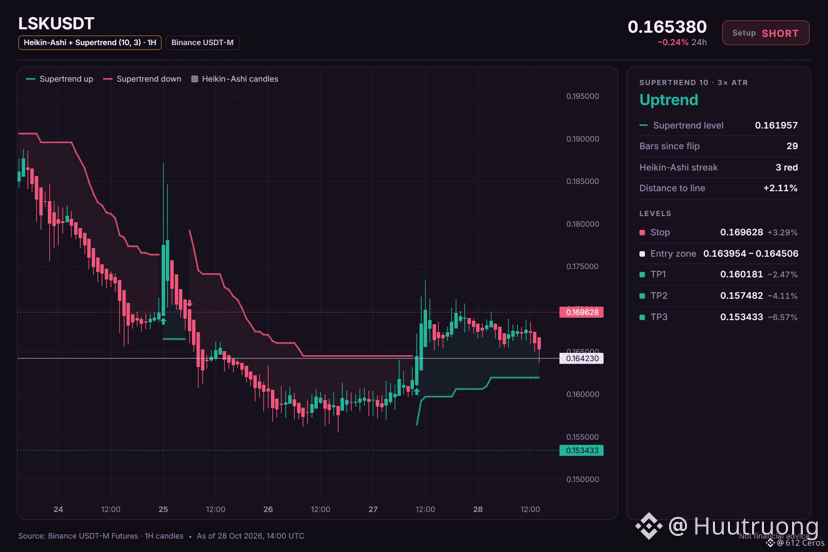
🔴 SHORT $LSK /USDT: expecting price to go DOWN
Bias: SHORT · Leaning
Entry: 0.163954 – 0.164506
TP1: 0.160181 (-2.5%)
TP2: 0.157482 (-4.1%)
TP3: 0.153433 (-6.6%)
SL: 0.169628 (+3.3%)
Plan: enter only inside the zone, close 50% at TP1, 25% at TP2, 25% at TP3, and move the stop to entry after TP1.
Note: moderate conviction only, keep size light.
Why SHORT? 5/12 signals agree, 0 against.
• 4h trend down (below EMA50 & EMA200)
• 1h trend down (below EMA50 & EMA200)
• Sellers are driving the move (15m ADX 21.7)
Q: Why short LSK on this pair?
A: The 4h trend is down, price below EMA50 and EMA200 in a bearish stack.
Q: When would this short direction be wrong?
A: The daily trend is range-bound, so a swing back up to the 1h EMA50 invalidates the setup.
What is your level if the 1h EMA50 fails to hold as resistance?
{spot}(LSKUSDT)
LSK is sliding in a clear bearish stack
🔴 SHORT $LSK /USDT: expecting price to go DOWN
Bias: SHORT · Leaning
Entry: 0.163954 – 0.164506
TP1: 0.160181 (-2.5%)
TP2: 0.157482 (-4.1%)
TP3: 0.153433 (-6.6%)
SL: 0.169628 (+3.3%)
Plan: enter only inside the zone, close 50% at TP1, 25% at TP2, 25% at TP3, and move the stop to entry after TP1.
Note: moderate conviction only, keep size light.
Why SHORT? 5/12 signals agree, 0 against.
• 4h trend down (below EMA50 & EMA200)
• 1h trend down (below EMA50 & EMA200)
• Sellers are driving the move (15m ADX 21.7)
Q: Why short LSK on this pair?
A: The 4h trend is down, price below EMA50 and EMA200 in a bearish stack.
Q: When would this short direction be wrong?
A: The daily trend is range-bound, so a swing back up to the 1h EMA50 invalidates the setup.
What is your level if the 1h EMA50 fails to hold as resistance?
24
Войдите, чтобы посмотреть больше материала
Присоединяйтесь к пользователям криптовалют по всему миру на Binance Square
⚡️ Получайте новейшую и полезную информацию о криптоактивах.
💬 Нам доверяет крупнейшая в мире криптобиржа.
👍 Получите достоверные аналитические данные от верифицированных создателей контента.
Эл. почта/номер телефона
В тренде
FedWatch
Просмотров: 16.3M
39,380 обсуждают
🚨 🇺🇸 PETER SCHIFF JUST THREW A BIG WARNING AT THE FED!
Peter Schiff is calling Kevin Warsh’s tough talk on inflation a “bluff,” and his prediction could have major implications for the markets.
Schiff believes the Fed could eventually return to money printing through quantitative easing (QE) and even cut interest rates next year, despite inflation continuing to rise.
Think about that for a moment.
🔥 Inflation could remain a problem. 🔥 The Fed could still move toward easier monetary policy. 🔥 More liquidity could flow into financial markets.
If this scenario plays out, it could create a very different market environment for stocks, gold, Bitcoin, and the wider crypto market.
But there’s a catch: if inflation stays high, the Fed could face a difficult choice between fighting rising prices and supporting the economy.
Will Warsh stick to a tough inflation policy, or will the Fed eventually change direction?
The next move could matter a lot for investors.
#FedWatch #EarningsSeason #USMidtermElections #BrazilCryptoExchangesMustApplyForLicensesByFriday #StanDruckenmillerBecomesInvestorInTradeXYZ
Jackson Liam
·Лайков: 4
·Просмотров: 8.3k
EarningsSeason
Просмотров: 6.4M
32,082 обсуждают
USMidtermElections
Просмотров: 40,850
614 обсуждают