

CryptoZeno
6.5k Публикации

CryptoZeno
Отправить жалобу
Заблокировать пользователя
On Chain Research and Market Insights with Smart Trading Signals

Владелец 龙虾
Трейдер с регулярными сделками
5.5 г
31 подписок(и/а)
9.8K+ подписчиков(а)
36.9K+ понравилось
Посты
Все
Цитирования
Видео
PINNED
·
--
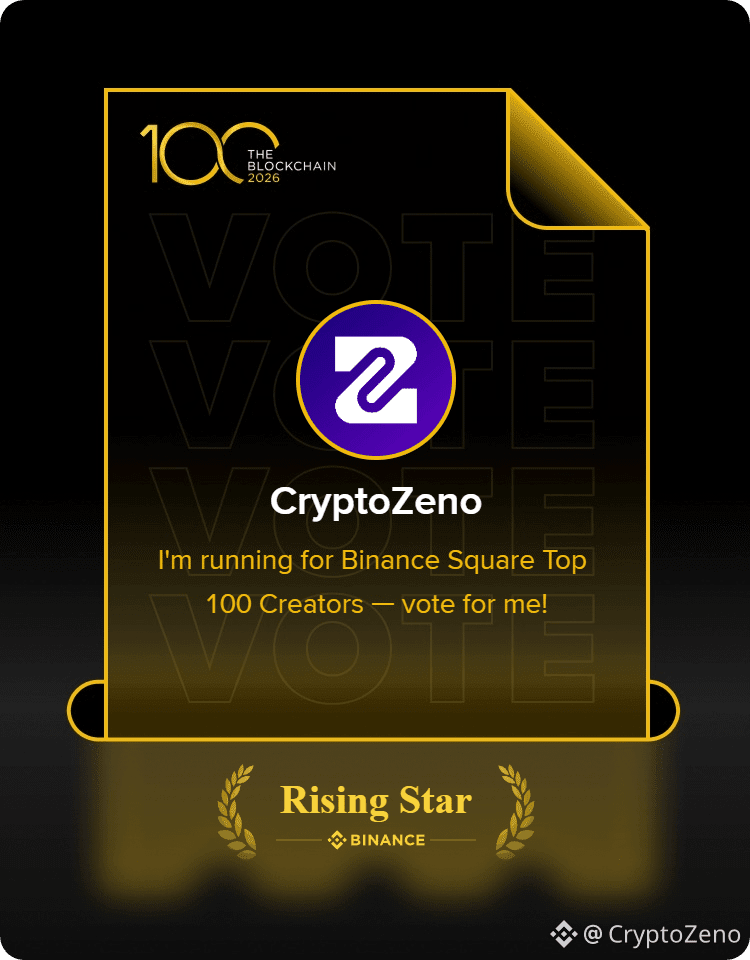
CRYPTOZENO IS NOMINATED FOR THE BLOCKCHAIN 100 AWARDS 2026 🏆
Vote for CryptoZeno for the Blockchain 100 Awards! [Vote now](https://app.binance.com/uni-qr/cact26user/516)
I'm excited to share that I've been nominated for the Rising Star category at The Blockchain 100 Awards 2026 on Binance Square!
Over the years, I've dedicated my time to sharing on chain research, market analysis, and trading insights with the crypto community. This nomination is a meaningful milestone in my journey as a content creator.
Your support would mean a lot to me. If you've ever found value in my research, analysis, or market updates, I'd truly appreciate your vote.
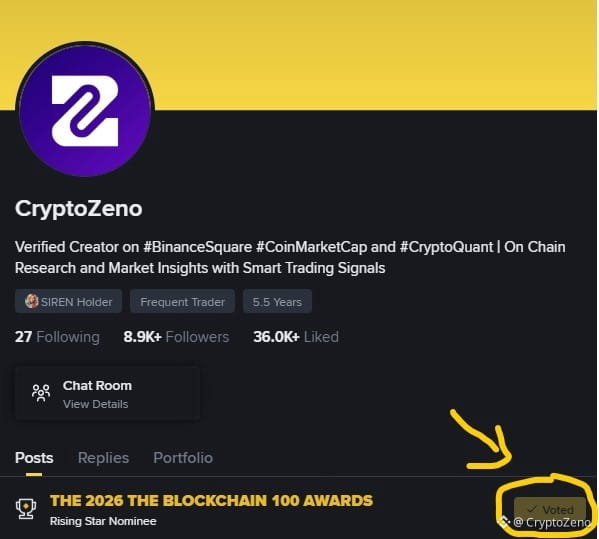
Voting is simple! Just visit my Binance Square profile, where you'll find the Blockchain 100 Awards voting section right below my profile information. You can cast your vote for me directly there.
Every vote counts, and I'm grateful to everyone who has supported CryptoZeno along the way. Let's make this milestone happen together! ❤️ [Vote now](https://app.binance.com/uni-qr/cact26user/516)
#Blockchain100 #BinanceSquare #CryptoZeno
CRYPTOZENO IS NOMINATED FOR THE BLOCKCHAIN 100 AWARDS 2026 🏆
Vote for CryptoZeno for the Blockchain 100 Awards! Vote now
I'm excited to share that I've been nominated for the Rising Star category at The Blockchain 100 Awards 2026 on Binance Square!
Over the years, I've dedicated my time to sharing on chain research, market analysis, and trading insights with the crypto community. This nomination is a meaningful milestone in my journey as a content creator.
Your support would mean a lot to me. If you've ever found value in my research, analysis, or market updates, I'd truly appreciate your vote.
Voting is simple! Just visit my Binance Square profile, where you'll find the Blockchain 100 Awards voting section right below my profile information. You can cast your vote for me directly there.
Every vote counts, and I'm grateful to everyone who has supported CryptoZeno along the way. Let's make this milestone happen together! ❤️ Vote now
#Blockchain100 #BinanceSquare #CryptoZeno
30
33
8k
·
--
Статья
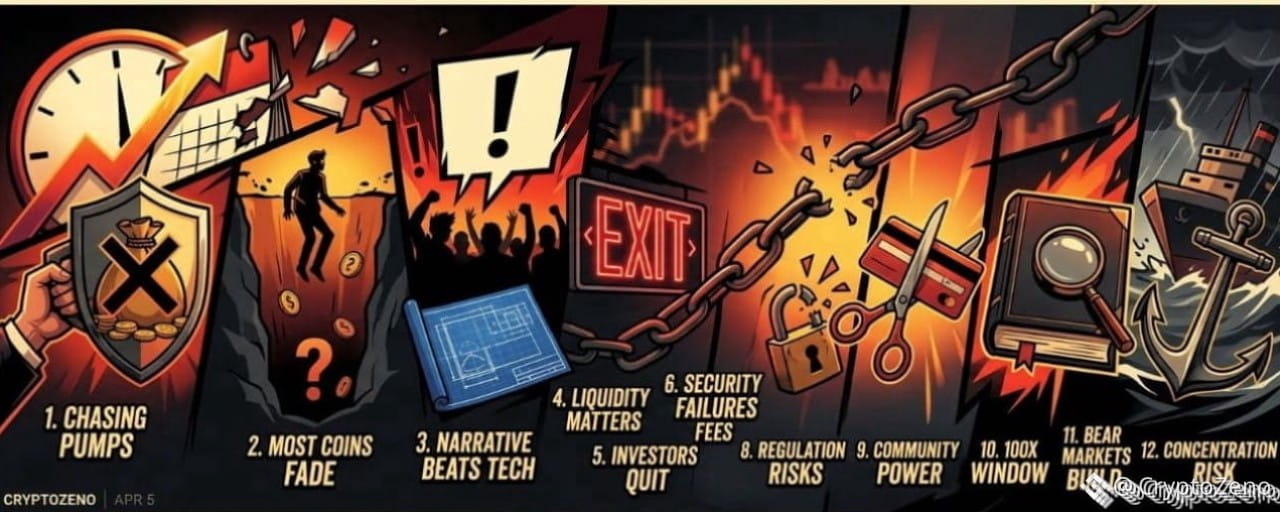
12 Brutal Mistakes I Made in 12 Years of CryptoSo You Don’t Have To Learn Them the Hard WayI’ve survived twelve years in crypto. I’ve made millions. I’ve lost millions. The gains teach you confidence. The losses teach you truth. These are the mistakes that cost me the most.
Chasing Pumps Is Just Providing Exit Liquidity Every time I bought into a coin already exploding, I convinced myself momentum would continue. Most of the time, I was simply late. When something is trending everywhere, you are rarely early. You are often the liquidity for someone smarter who entered before you.Most Coins Don’t Collapse. They Fade The majority of projects don’t die in dramatic crashes. They slowly lose volume, updates stop, the community shrinks, and attention disappears. One day you realize liquidity is gone and so is your capital.Narrative Often Beats Technology I backed technically superior projects that went nowhere. Meanwhile, tokens with powerful stories, branding, and community momentum outperformed. Markets reward belief and attention before they reward engineering.Liquidity Is More Important Than Paper Gains An unrealized gain means nothing if you cannot exit efficiently. Thin order books trap capital. Always assess depth, not just price.Most Investors Quit at the Worst Time Cycles are emotional weapons. People buy during euphoria and sell during despair. Many who left in bear markets watched prices recover without them. Longevity alone is an edge.Security Failures Hurt More Than Bad Trades I have been hacked, phished, and SIM-swapped. Poor operational security erased profits faster than volatility ever did. Capital without protection is temporary.Overtrading Transfers Wealth to Exchanges Constant activity feels productive. It rarely is. The more I traded, the more I paid in fees and mistakes. Holding strong assets through noise often outperformed aggressive trading.Regulation Changes the Game Overnight Governments move slowly until they don’t. Tokens built on regulatory gray zones can disappear quickly. Long-term survival requires anticipating policy risk.Community Is an Asset Class I underestimated culture. Memes, loyalty, and shared identity drive liquidity and resilience. A loud, committed community can sustain a project longer than strong fundamentals alone.The 100x Window Is Brief Life-changing returns happen early, quietly, and without consensus. Once everyone agrees something is a great opportunity, the asymmetric upside is usually gone.Bear Markets Build Real Advantage The quiet phases are when knowledge compounds. Reading, building, accumulating quality assets at depressed valuations created my largest long-term returns. Bull markets reward positioning built in silence.Concentration Without Risk Control Is Gambling I have seen fortunes disappear from a single oversized bet. Conviction must be balanced with survival. You cannot compound if you are wiped out.
Twelve years taught me this: crypto does not reward intelligence alone. It rewards discipline, patience, adaptability, and survival.
If even one of these lessons saves you from repeating my mistakes, you are already ahead of where I once was.
In crypto, staying in the game is often the biggest advantage of all.
#CryptoZeno #$1.5BInLeveragedCryptoBetsLiquidated
12 Brutal Mistakes I Made in 12 Years of CryptoSo You Don’t Have To Learn Them the Hard Way
I’ve survived twelve years in crypto. I’ve made millions. I’ve lost millions. The gains teach you confidence. The losses teach you truth. These are the mistakes that cost me the most.
Chasing Pumps Is Just Providing Exit Liquidity Every time I bought into a coin already exploding, I convinced myself momentum would continue. Most of the time, I was simply late. When something is trending everywhere, you are rarely early. You are often the liquidity for someone smarter who entered before you.Most Coins Don’t Collapse. They Fade The majority of projects don’t die in dramatic crashes. They slowly lose volume, updates stop, the community shrinks, and attention disappears. One day you realize liquidity is gone and so is your capital.Narrative Often Beats Technology I backed technically superior projects that went nowhere. Meanwhile, tokens with powerful stories, branding, and community momentum outperformed. Markets reward belief and attention before they reward engineering.Liquidity Is More Important Than Paper Gains An unrealized gain means nothing if you cannot exit efficiently. Thin order books trap capital. Always assess depth, not just price.Most Investors Quit at the Worst Time Cycles are emotional weapons. People buy during euphoria and sell during despair. Many who left in bear markets watched prices recover without them. Longevity alone is an edge.Security Failures Hurt More Than Bad Trades I have been hacked, phished, and SIM-swapped. Poor operational security erased profits faster than volatility ever did. Capital without protection is temporary.Overtrading Transfers Wealth to Exchanges Constant activity feels productive. It rarely is. The more I traded, the more I paid in fees and mistakes. Holding strong assets through noise often outperformed aggressive trading.Regulation Changes the Game Overnight Governments move slowly until they don’t. Tokens built on regulatory gray zones can disappear quickly. Long-term survival requires anticipating policy risk.Community Is an Asset Class I underestimated culture. Memes, loyalty, and shared identity drive liquidity and resilience. A loud, committed community can sustain a project longer than strong fundamentals alone.The 100x Window Is Brief Life-changing returns happen early, quietly, and without consensus. Once everyone agrees something is a great opportunity, the asymmetric upside is usually gone.Bear Markets Build Real Advantage The quiet phases are when knowledge compounds. Reading, building, accumulating quality assets at depressed valuations created my largest long-term returns. Bull markets reward positioning built in silence.Concentration Without Risk Control Is Gambling I have seen fortunes disappear from a single oversized bet. Conviction must be balanced with survival. You cannot compound if you are wiped out.
Twelve years taught me this: crypto does not reward intelligence alone. It rewards discipline, patience, adaptability, and survival.
If even one of these lessons saves you from repeating my mistakes, you are already ahead of where I once was.
In crypto, staying in the game is often the biggest advantage of all.
#CryptoZeno #$1.5BInLeveragedCryptoBetsLiquidated
4
3.3k
·
--
🎁 🧧 CLAIM YOUR RED PACKET! 👉 "FOLLOW"
✅ FOLLOW @CryptoZeno
❤️ Like
💬 Comment “Zeno”
Bigger red packets are coming soon with limited spots! FOLLOW so you don't miss out! 🧧
🎁 🧧 CLAIM YOUR RED PACKET! 👉 "FOLLOW"
✅ FOLLOW @CryptoZeno
❤️ Like
💬 Comment “Zeno”
Bigger red packets are coming soon with limited spots! FOLLOW so you don't miss out! 🧧
✅ FOLLOW @CryptoZeno
❤️ Like
💬 Comment “Zeno”
Bigger red packets are coming soon with limited spots! FOLLOW so you don't miss out! 🧧

306
17
598
·
--
BREAKING: CNN reports that North Korea was behind the $6 BILLION Binance hack.
The scale of this attack is absolutely insane, and it raises serious questions about the security of even the biggest exchanges in the industry.
BREAKING: CNN reports that North Korea was behind the $6 BILLION Binance hack.
The scale of this attack is absolutely insane, and it raises serious questions about the security of even the biggest exchanges in the industry.
The scale of this attack is absolutely insane, and it raises serious questions about the security of even the biggest exchanges in the industry.


4
1.2k
·
--
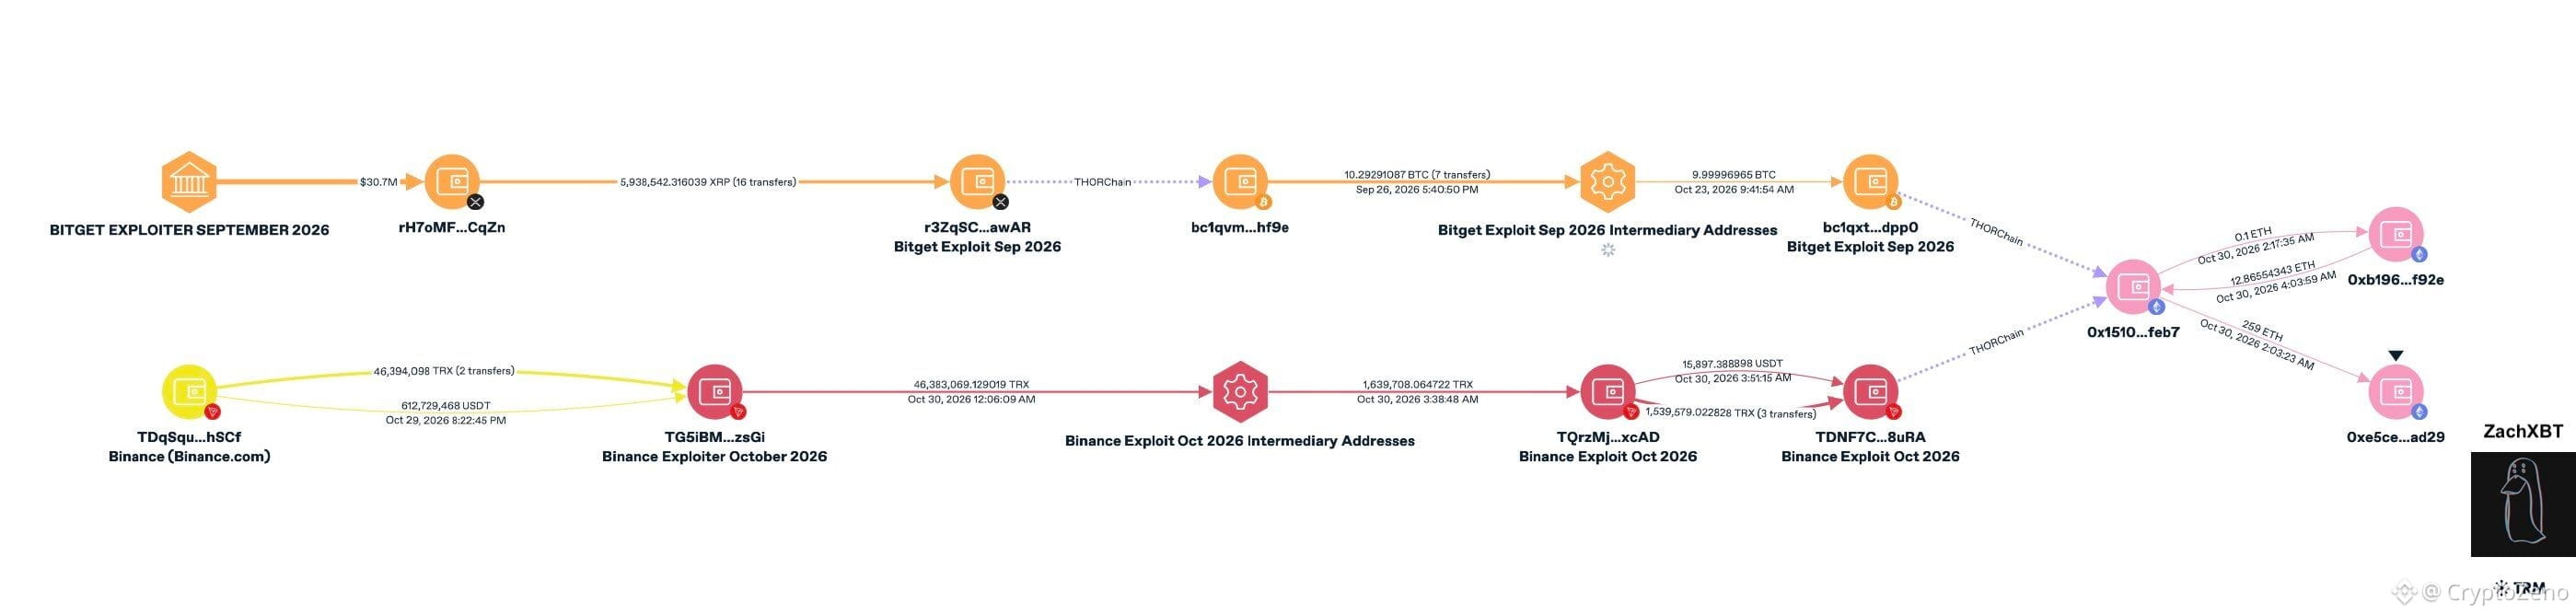
🚨UPDATE: North Korea’s TraderTraitor group, tied to the $388M Bitget exploit, is likely also behind the $6.3B Binance hack, says ZachXBT.
Stolen funds from both landed at one address.
🚨UPDATE: North Korea’s TraderTraitor group, tied to the $388M Bitget exploit, is likely also behind the $6.3B Binance hack, says ZachXBT.
Stolen funds from both landed at one address.
Stolen funds from both landed at one address.
3
141
·
--
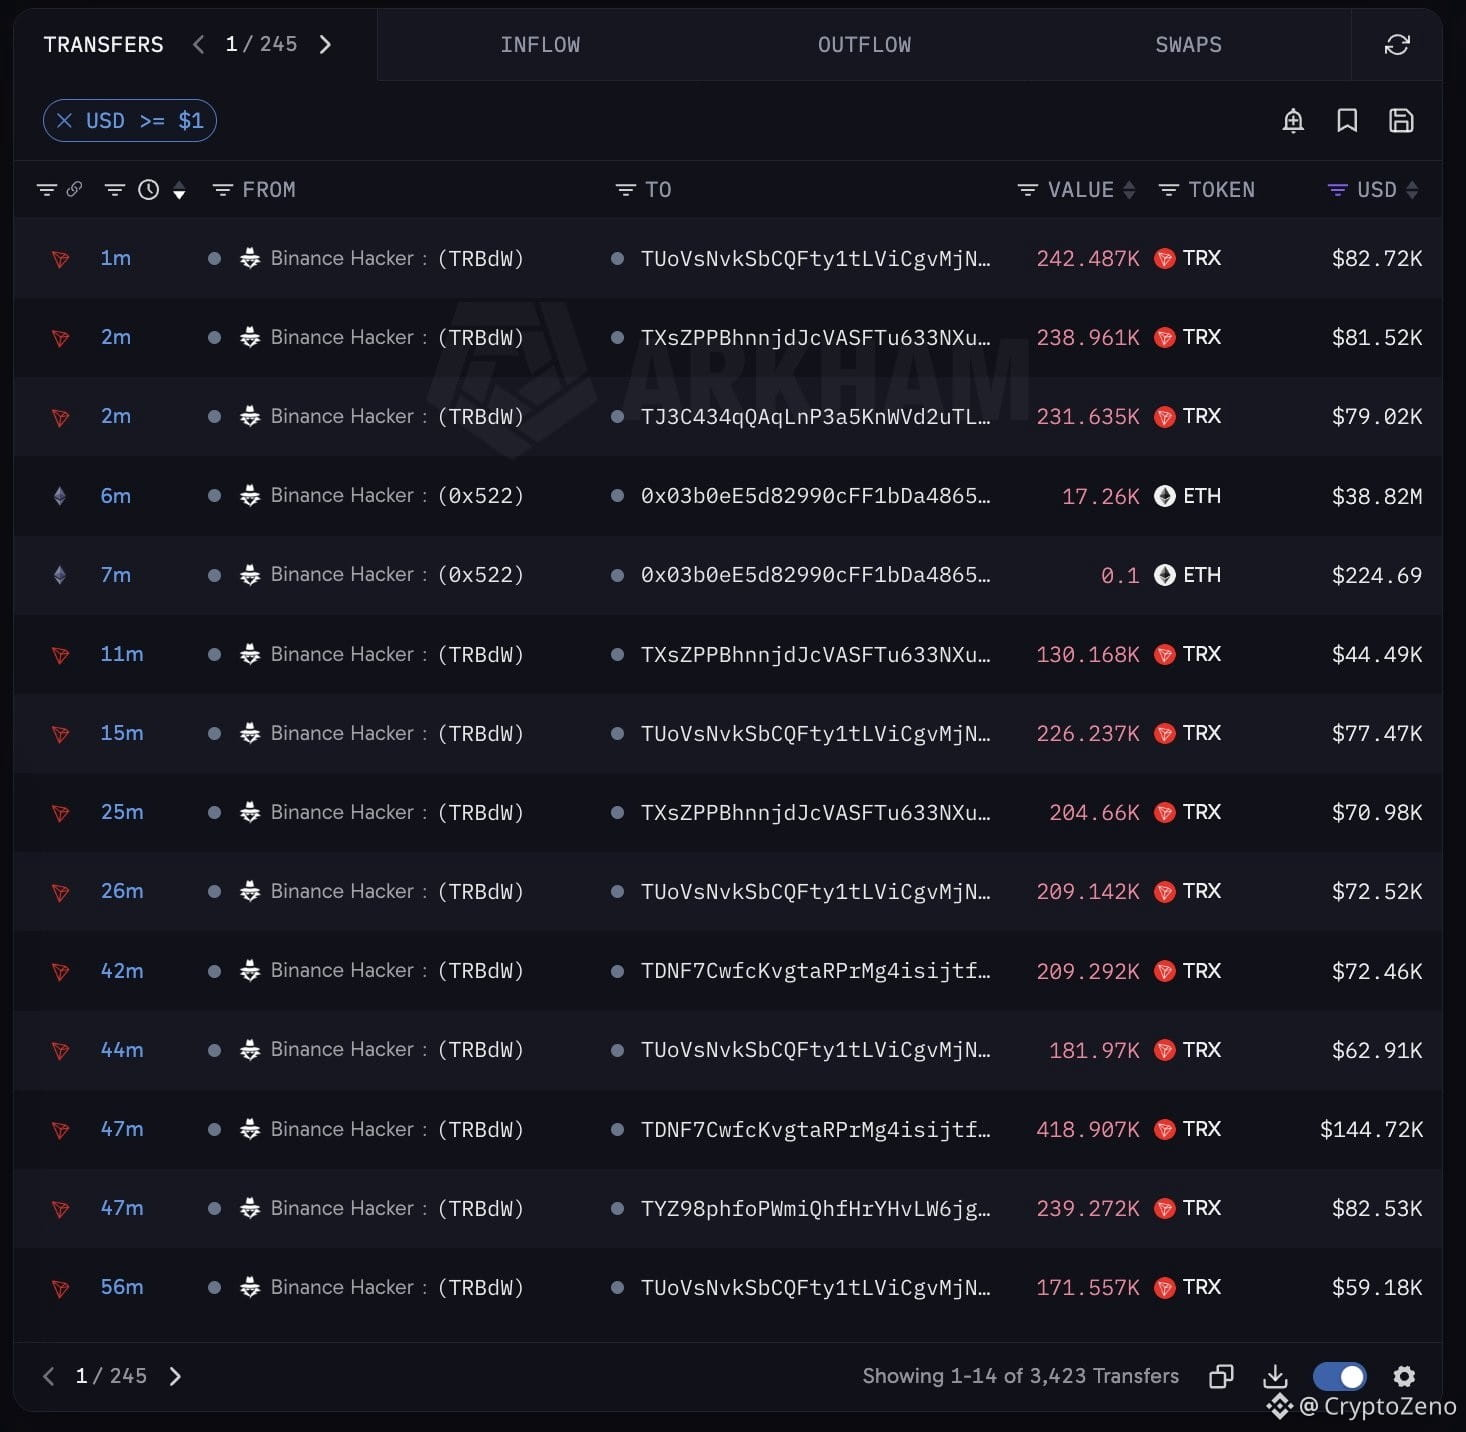
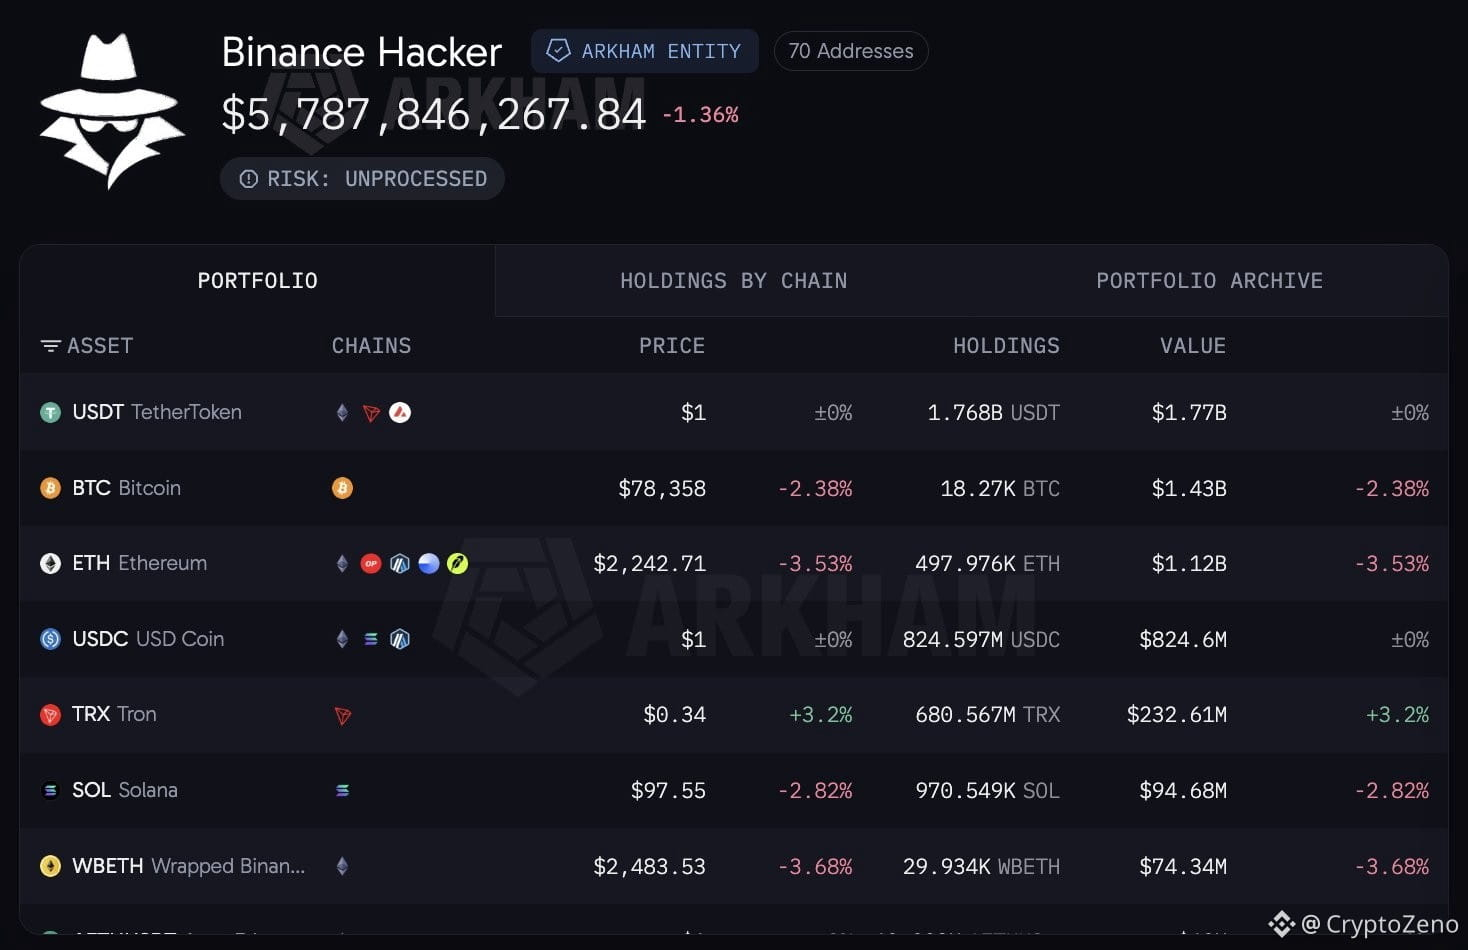
The Binance Hacker just sent $38.82M $ETH to a new wallet.
Is this going to Tornado Cash?
He still holds $1.12B ETH.
{future}(ETHUSDT)
The Binance Hacker just sent $38.82M $ETH to a new wallet.
Is this going to Tornado Cash?
He still holds $1.12B ETH.
Is this going to Tornado Cash?
He still holds $1.12B ETH.
3
262
·
--
🎁🎁 GET RANDOM GIFTS! 👉 "FOLLOW"
🎁 FOLLOW @CryptoUncle_Log
❤️ Like
💬 Comment “Zeno”
👥 Join group chat
Follow me and join my group chat for more big giveaways! 🎁
🎁🎁 GET RANDOM GIFTS! 👉 "FOLLOW"
🎁 FOLLOW @CryptoZeno
❤️ Like
💬 Comment “Zeno”
👥 Join group chat
Follow me and join my group chat for more big giveaways! 🎁
🎁 FOLLOW @CryptoZeno
❤️ Like
💬 Comment “Zeno”
👥 Join group chat
Follow me and join my group chat for more big giveaways! 🎁
394
1
23
394
·
--
🐋 WHALE WATCH : Every major crypto hack has been followed by new Bitcoin highs.
=> Mt. Gox (2014): BTC halved. Hit $19.7k by 2017 nearly 100x off the post collapse low.
=> Bitfinex (2016): BTC fell 20%. Back above pre hack levels within 3 months new all time highs in 2017.
=> Coincheck (2018): Hit during the bear market. BTC climbed from $3.1k to $29k by end of 2020 then $69k in 2021.
=> Binance (2019): BTC dipped 4%. Rallied 136% in 7 weeks.
=> FTX (2022): BTC fell 22% to $15.5k. Up 134% a year later new ATH of $73.7k by March 2024 375% off the low.
=> Bybit (2025): Largest hack on record at the time. BTC dipped 5% hit a new ATH exactly 3 months later went on to $126k.
=> Binance (2026): BTC down 3% so far. Binance says funds are SAFU. $2.4B of stolen funds already frozen.
The pattern holds. Past performance doesnt guarantee future results but the data is consistent.
{future}(BTCUSDT)
🐋 WHALE WATCH : Every major crypto hack has been followed by new Bitcoin highs.
=> Mt. Gox (2014): BTC halved. Hit $19.7k by 2017 nearly 100x off the post collapse low.
=> Bitfinex (2016): BTC fell 20%. Back above pre hack levels within 3 months new all time highs in 2017.
=> Coincheck (2018): Hit during the bear market. BTC climbed from $3.1k to $29k by end of 2020 then $69k in 2021.
=> Binance (2019): BTC dipped 4%. Rallied 136% in 7 weeks.
=> FTX (2022): BTC fell 22% to $15.5k. Up 134% a year later new ATH of $73.7k by March 2024 375% off the low.
=> Bybit (2025): Largest hack on record at the time. BTC dipped 5% hit a new ATH exactly 3 months later went on to $126k.
=> Binance (2026): BTC down 3% so far. Binance says funds are SAFU. $2.4B of stolen funds already frozen.
The pattern holds. Past performance doesnt guarantee future results but the data is consistent.

6
986
·
--
$BTC Nothing out of the ordinary.
{future}(BTCUSDT)
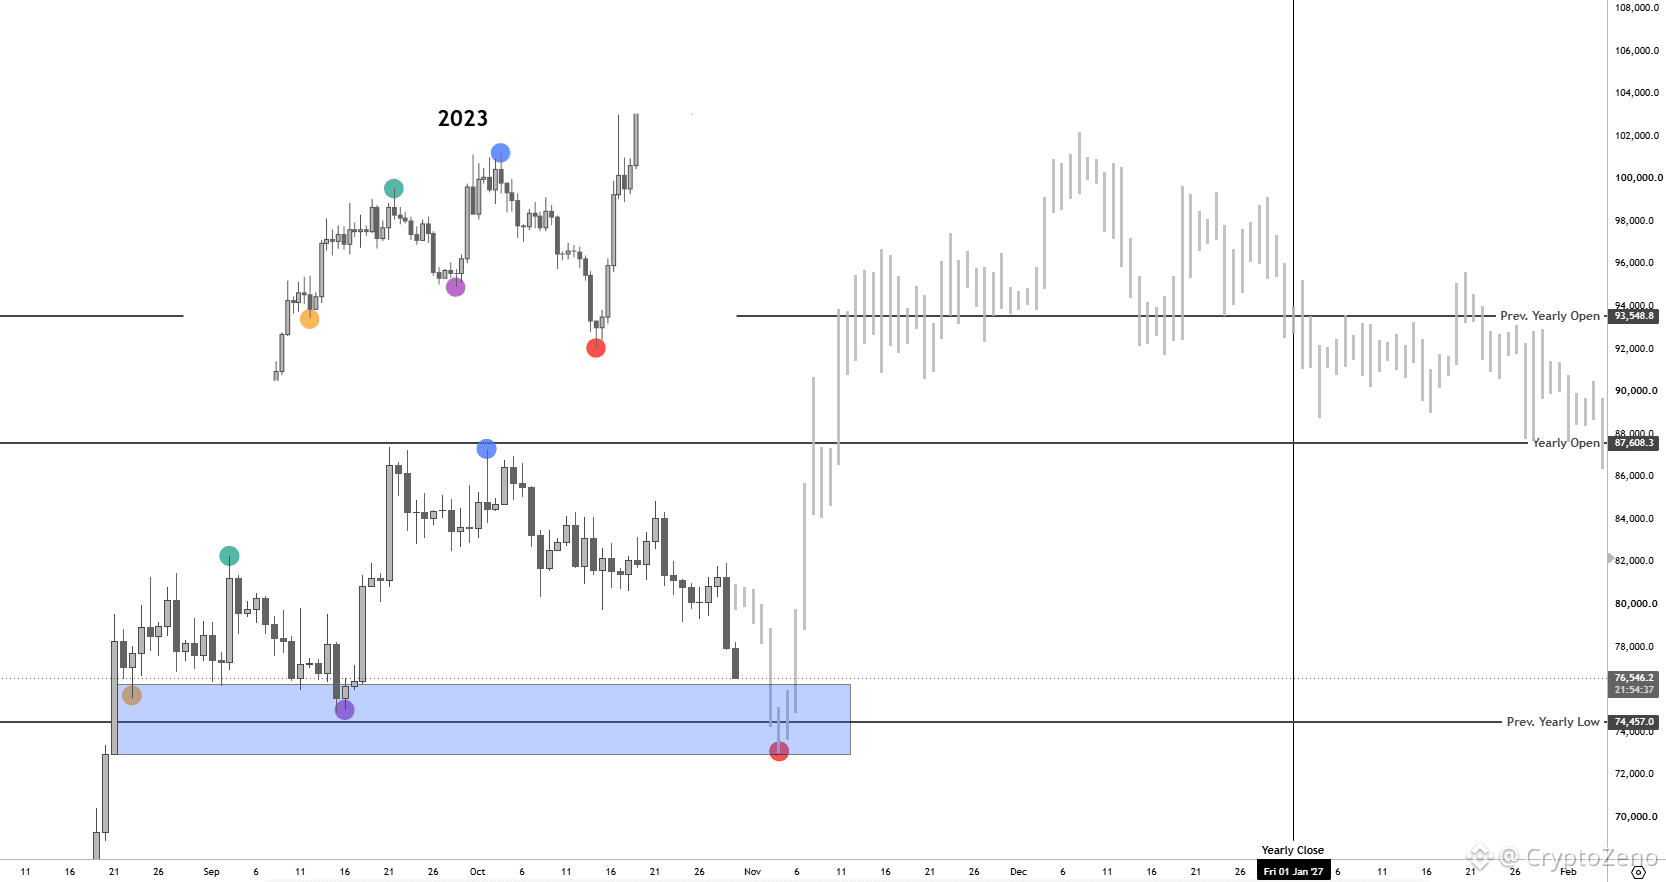
Shared the full thought process behind why we could tap this zone just yesterday, and we've seen it come into play shortly after.
This blue box (76.4K–72.9K) is where I'm planning to go heavy on longs and add to my Spot bags.
No changes to the plan. We're still bullish, and we're still expecting higher prices as long as this blue box holds.
Buy the Fear.
$BTC Nothing out of the ordinary.
Shared the full thought process behind why we could tap this zone just yesterday, and we've seen it come into play shortly after.
This blue box (76.4K–72.9K) is where I'm planning to go heavy on longs and add to my Spot bags.
No changes to the plan. We're still bullish, and we're still expecting higher prices as long as this blue box holds.
Buy the Fear.
CryptoZeno
·
--
$BTC Zoomed in w/ Last Cycle's Fractals
Now, We all know that we've been following the Last Cycle's PA pretty much to the dot so far. However, I don't solely rely on historical references as they're never guaranteed to play out again, and each cycle's PA is different from the last one in one way or another.
But the thing is, When I couple the Yearly Candle Time + Liquidity analysis I shared above with the last cycle's price action, They pretty much complement each other.
In fact, It feels less like a historical PA reference here and more like a visual representation of that thought process on the chart right now.
Based on this Fractal, The roadmap is the same:
--> Retest of the previous yearly candle's low to complete HTF Wave 2.
--> Pump back above the yearly open and close the year in green around 93.6k
--> Next yearly candle holds the current yearly open and continues towards the upside.
Pretty much what I shared in the post above, and both scenarios line up pretty well and complement each other.
So where I'm getting at is that if we lose the current lows, It would very likely mean we repeat something similar to what we saw back in 2023.
A HTF correction is due, and the 74k-72k region has always remained on my radar.
However, For that region to come into play, We first need to break below the 0.618 Fib on the 1D, sitting at 79.6k.
4
1.6k
·
--
A MASSIVE TOKENIZATION WAVE IS COMING TO CRYPTO.
9 days ago, we named real world asset tokenization as one of the biggest narratives of this cycle in this thread.
The signs are already here.
• DTCC, the system behind US stock settlement, now lets banks turn stocks, ETFs and Treasuries into blockchain tokens. JPMorgan, Bank of America, Citi, Morgan Stanley and Fidelity are among the first firms using it.
• Janus Henderson, a $500 billion asset manager, launched the first licensed tokenized fund tracking the Nasdaq-100.
• Aviva Investors put £50 million (about $66.7 million) into a tokenized version of its £22 billion money market fund on the XRP Ledger.
• Hong Kong approved 24/7 trading of tokenized funds for retail investors for the first time.
• Ondo brought tokenized Apple, Meta, Tesla and Google shares to Robinhood Chain.
• Securitize, one of the biggest tokenization firms, expanded to the Stellar blockchain.
• The owner of the New York Stock Exchange is planning a regulated US market for 24/7 perpetual futures built on Hyperliquid.
All of this happened in just 9 days.
{future}(BTCUSDT)
A MASSIVE TOKENIZATION WAVE IS COMING TO CRYPTO.
9 days ago, we named real world asset tokenization as one of the biggest narratives of this cycle in this thread.
The signs are already here.
• DTCC, the system behind US stock settlement, now lets banks turn stocks, ETFs and Treasuries into blockchain tokens. JPMorgan, Bank of America, Citi, Morgan Stanley and Fidelity are among the first firms using it.
• Janus Henderson, a $500 billion asset manager, launched the first licensed tokenized fund tracking the Nasdaq-100.
• Aviva Investors put £50 million (about $66.7 million) into a tokenized version of its £22 billion money market fund on the XRP Ledger.
• Hong Kong approved 24/7 trading of tokenized funds for retail investors for the first time.
• Ondo brought tokenized Apple, Meta, Tesla and Google shares to Robinhood Chain.
• Securitize, one of the biggest tokenization firms, expanded to the Stellar blockchain.
• The owner of the New York Stock Exchange is planning a regulated US market for 24/7 perpetual futures built on Hyperliquid.
All of this happened in just 9 days.
3
270
·
--
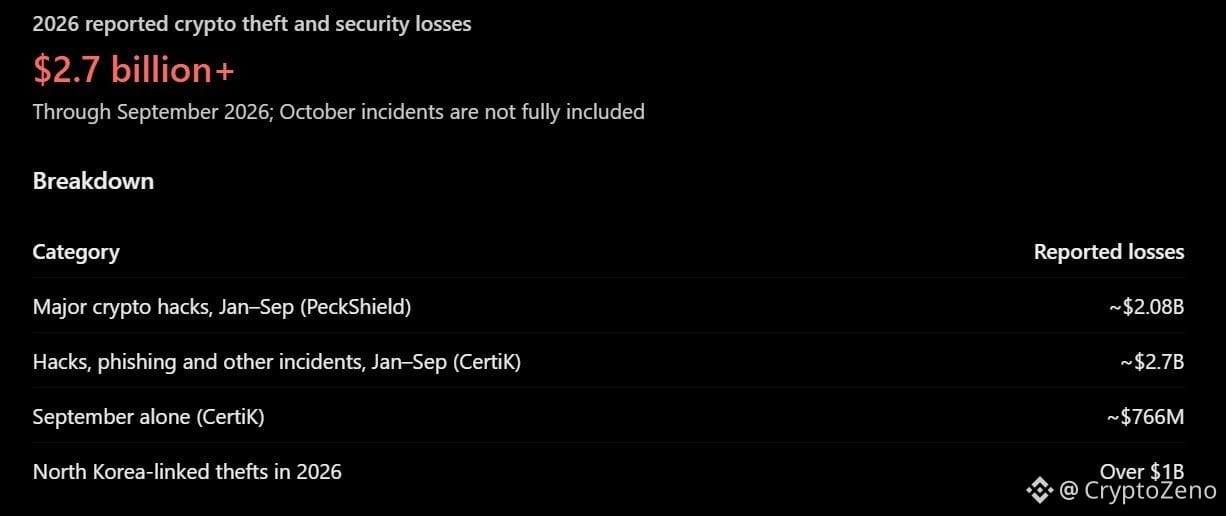
Over $2.7 BILLION has been lost to crypto hacks and security breaches in 2026 alone
And that's only through September
More than $1 BILLION has been attributed to North Korean hackers
We’ve built an entire financial system around protecting private keys and somehow BILLIONS keep disappearing every year
And that's only through September
More than $1 BILLION has been attributed to North Korean hackers
We’ve built an entire financial system around protecting private keys and somehow BILLIONS keep disappearing every year
4
1.6k
·
--
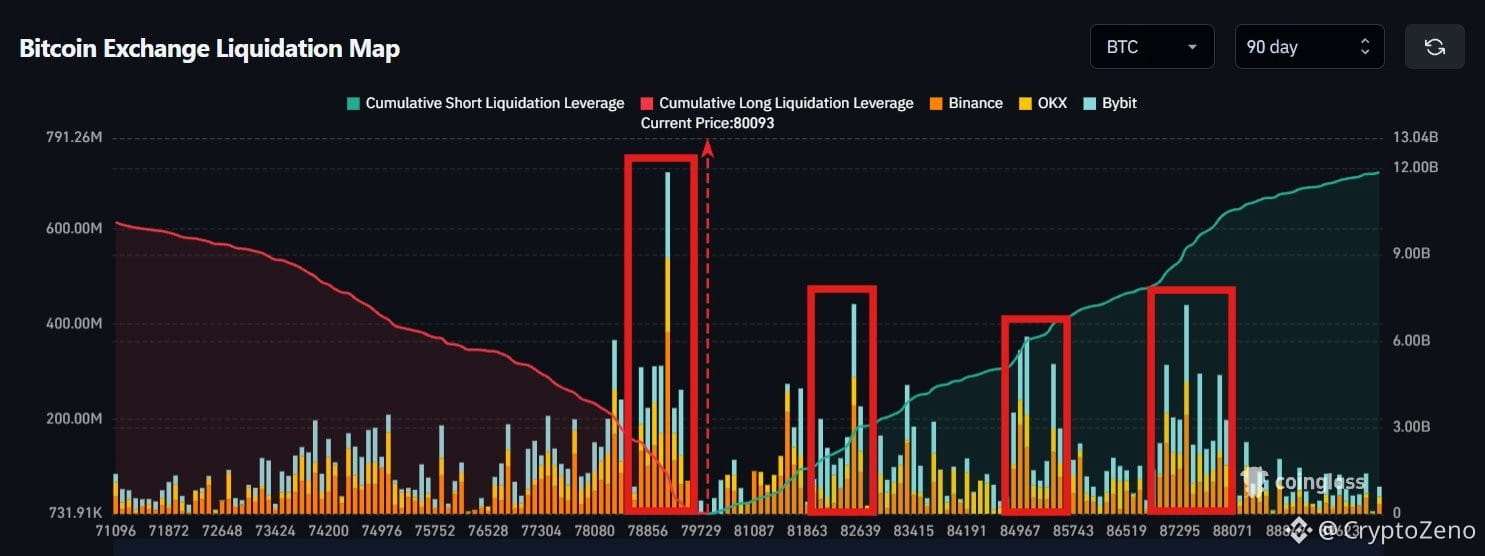
$BTC Looking at the higher timeframe liquidation map, four clusters stand out.
{future}(BTCUSDT)
The closest one sits around $79K, with over $2.5B in long liquidations.
Above price, we have three major clusters around $82K, $85K and $87K, containing more than $10B in short liquidations combined.
Interestingly, the total amount of liquidity is almost equally distributed on both sides, with slightly more sitting above price.
However, below $79K, there are no major clusters left as liquidity is spread out across a much wider price range.
While I still consider a sweep of $79K very likely, my overall bullish outlook remains unchanged.
I still favor the upside as the next major direction.
$BTC Looking at the higher timeframe liquidation map, four clusters stand out.
The closest one sits around $79K, with over $2.5B in long liquidations.
Above price, we have three major clusters around $82K, $85K and $87K, containing more than $10B in short liquidations combined.
Interestingly, the total amount of liquidity is almost equally distributed on both sides, with slightly more sitting above price.
However, below $79K, there are no major clusters left as liquidity is spread out across a much wider price range.
While I still consider a sweep of $79K very likely, my overall bullish outlook remains unchanged.
I still favor the upside as the next major direction.
6
701
·
--
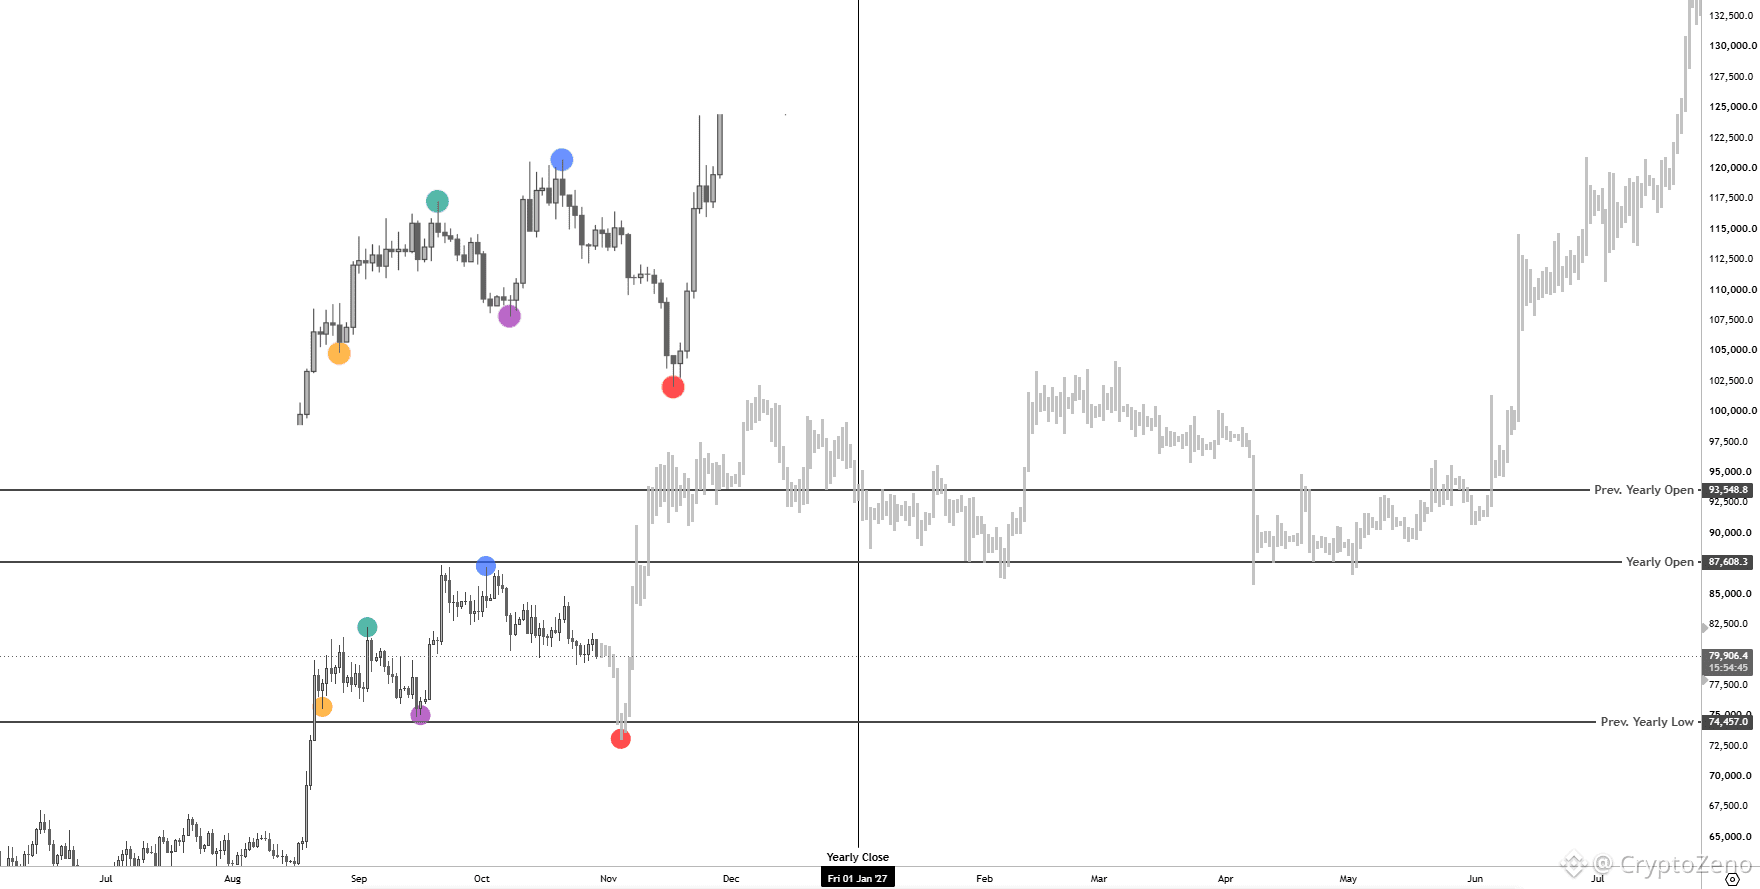
$BTC Zoomed in w/ Last Cycle's Fractals
{future}(BTCUSDT)
Now, We all know that we've been following the Last Cycle's PA pretty much to the dot so far. However, I don't solely rely on historical references as they're never guaranteed to play out again, and each cycle's PA is different from the last one in one way or another.
But the thing is, When I couple the Yearly Candle Time + Liquidity analysis I shared above with the last cycle's price action, They pretty much complement each other.
In fact, It feels less like a historical PA reference here and more like a visual representation of that thought process on the chart right now.
Based on this Fractal, The roadmap is the same:
--> Retest of the previous yearly candle's low to complete HTF Wave 2.
--> Pump back above the yearly open and close the year in green around 93.6k
--> Next yearly candle holds the current yearly open and continues towards the upside.
Pretty much what I shared in the post above, and both scenarios line up pretty well and complement each other.
So where I'm getting at is that if we lose the current lows, It would very likely mean we repeat something similar to what we saw back in 2023.
A HTF correction is due, and the 74k-72k region has always remained on my radar.
However, For that region to come into play, We first need to break below the 0.618 Fib on the 1D, sitting at 79.6k.
$BTC Zoomed in w/ Last Cycle's Fractals
Now, We all know that we've been following the Last Cycle's PA pretty much to the dot so far. However, I don't solely rely on historical references as they're never guaranteed to play out again, and each cycle's PA is different from the last one in one way or another.
But the thing is, When I couple the Yearly Candle Time + Liquidity analysis I shared above with the last cycle's price action, They pretty much complement each other.
In fact, It feels less like a historical PA reference here and more like a visual representation of that thought process on the chart right now.
Based on this Fractal, The roadmap is the same:
--> Retest of the previous yearly candle's low to complete HTF Wave 2.
--> Pump back above the yearly open and close the year in green around 93.6k
--> Next yearly candle holds the current yearly open and continues towards the upside.
Pretty much what I shared in the post above, and both scenarios line up pretty well and complement each other.
So where I'm getting at is that if we lose the current lows, It would very likely mean we repeat something similar to what we saw back in 2023.
A HTF correction is due, and the 74k-72k region has always remained on my radar.
However, For that region to come into play, We first need to break below the 0.618 Fib on the 1D, sitting at 79.6k.
1
4
502
·
--
$BTC This yearly candle is important.
{future}(BTCUSDT)
My base scenario was that we would deviate above the yearly open and tap 93.6k before retracing back below 87.4k and closing the yearly candle in red.
Then, when the 2027 yearly candle opens, it would first fill some of the wick of the current year's candle, where we'd get a retest of the 74.5k region before continuing towards the upside.
Now, Putting a Wave Count on this thesis, It would look something like this:
Deviation above 93k = Monthly Wave 1.
Yearly close below 87.4k, making the candle close in red.
The 2027 candle fills some of the wick of the 2026 candle = Monthly Wave 2 around the 74k region.
Following that wick fill, We pump towards the upside inside Wave 3 and create a new ATH.
This was my overall time, price + liquidity thesis behind the Wave Count I'm tracking on the Weekly/Monthly, and it's still pretty much valid as long as we keep holding the 0.618 Fib and the trendline on the Daily.
However, The catch is that if we lose that 0.618 Fib / trendline on the Daily and actually complete Wave 2 in the start of next month, It would change the timeline significantly.
Meaning that the imbalance which should ideally be cleared by next year's candle would instead be filled during the current yearly session.
Now, Given that we have liquidity stacked above the yearly open as of now, A tap into the 76k-74k region for completing Wave 2 within this year would mean we're likely to pump for the rest of Q4 and close the yearly candle in green, potentially around the 93.3k region.
From there, The next yearly candle would only come down to the 87.4k region for a minor retest before continuing higher.
So if we complete the Weekly Wave 2 in the upcoming days, It would mean we're setting up for a bigger impulse before the end of the year, and November-December could take us into the 93k-96k region.
$BTC This yearly candle is important.
My base scenario was that we would deviate above the yearly open and tap 93.6k before retracing back below 87.4k and closing the yearly candle in red.
Then, when the 2027 yearly candle opens, it would first fill some of the wick of the current year's candle, where we'd get a retest of the 74.5k region before continuing towards the upside.
Now, Putting a Wave Count on this thesis, It would look something like this:
Deviation above 93k = Monthly Wave 1.
Yearly close below 87.4k, making the candle close in red.
The 2027 candle fills some of the wick of the 2026 candle = Monthly Wave 2 around the 74k region.
Following that wick fill, We pump towards the upside inside Wave 3 and create a new ATH.
This was my overall time, price + liquidity thesis behind the Wave Count I'm tracking on the Weekly/Monthly, and it's still pretty much valid as long as we keep holding the 0.618 Fib and the trendline on the Daily.
However, The catch is that if we lose that 0.618 Fib / trendline on the Daily and actually complete Wave 2 in the start of next month, It would change the timeline significantly.
Meaning that the imbalance which should ideally be cleared by next year's candle would instead be filled during the current yearly session.
Now, Given that we have liquidity stacked above the yearly open as of now, A tap into the 76k-74k region for completing Wave 2 within this year would mean we're likely to pump for the rest of Q4 and close the yearly candle in green, potentially around the 93.3k region.
From there, The next yearly candle would only come down to the 87.4k region for a minor retest before continuing higher.
So if we complete the Weekly Wave 2 in the upcoming days, It would mean we're setting up for a bigger impulse before the end of the year, and November-December could take us into the 93k-96k region.
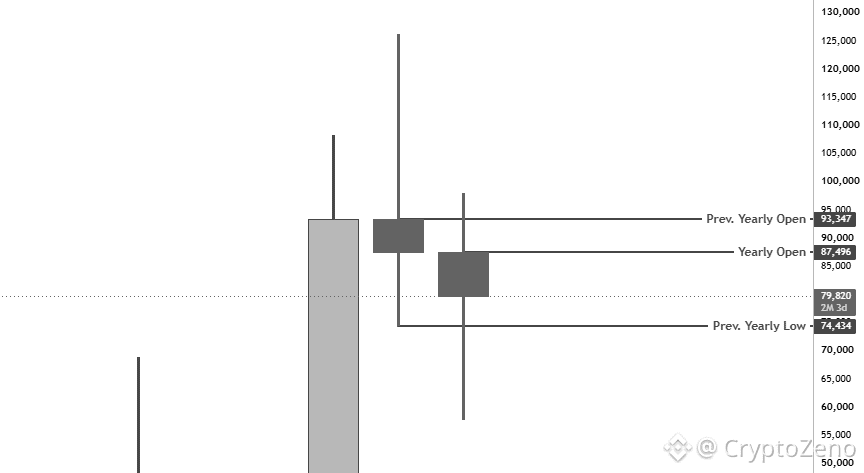
3
357
·
--
$BTC Yesterday's FOMC breakout didn't last long.
{future}(BTCUSDT)
Buyers failed to sustain the move, sending price back into the range and below the weekly open.
Now all eyes are on the ascending trendline and the range lows, both of which are still holding.
What's keeping me optimistic is the order flow.
Spot participants continue to buy while perp sellers are trying to push price lower.
As long as spot demand remains strong, I expect buyers to keep defending these levels.
But if spot starts selling as well, things could get ugly pretty quickly.
$BTC Yesterday's FOMC breakout didn't last long.
Buyers failed to sustain the move, sending price back into the range and below the weekly open.
Now all eyes are on the ascending trendline and the range lows, both of which are still holding.
What's keeping me optimistic is the order flow.
Spot participants continue to buy while perp sellers are trying to push price lower.
As long as spot demand remains strong, I expect buyers to keep defending these levels.
But if spot starts selling as well, things could get ugly pretty quickly.
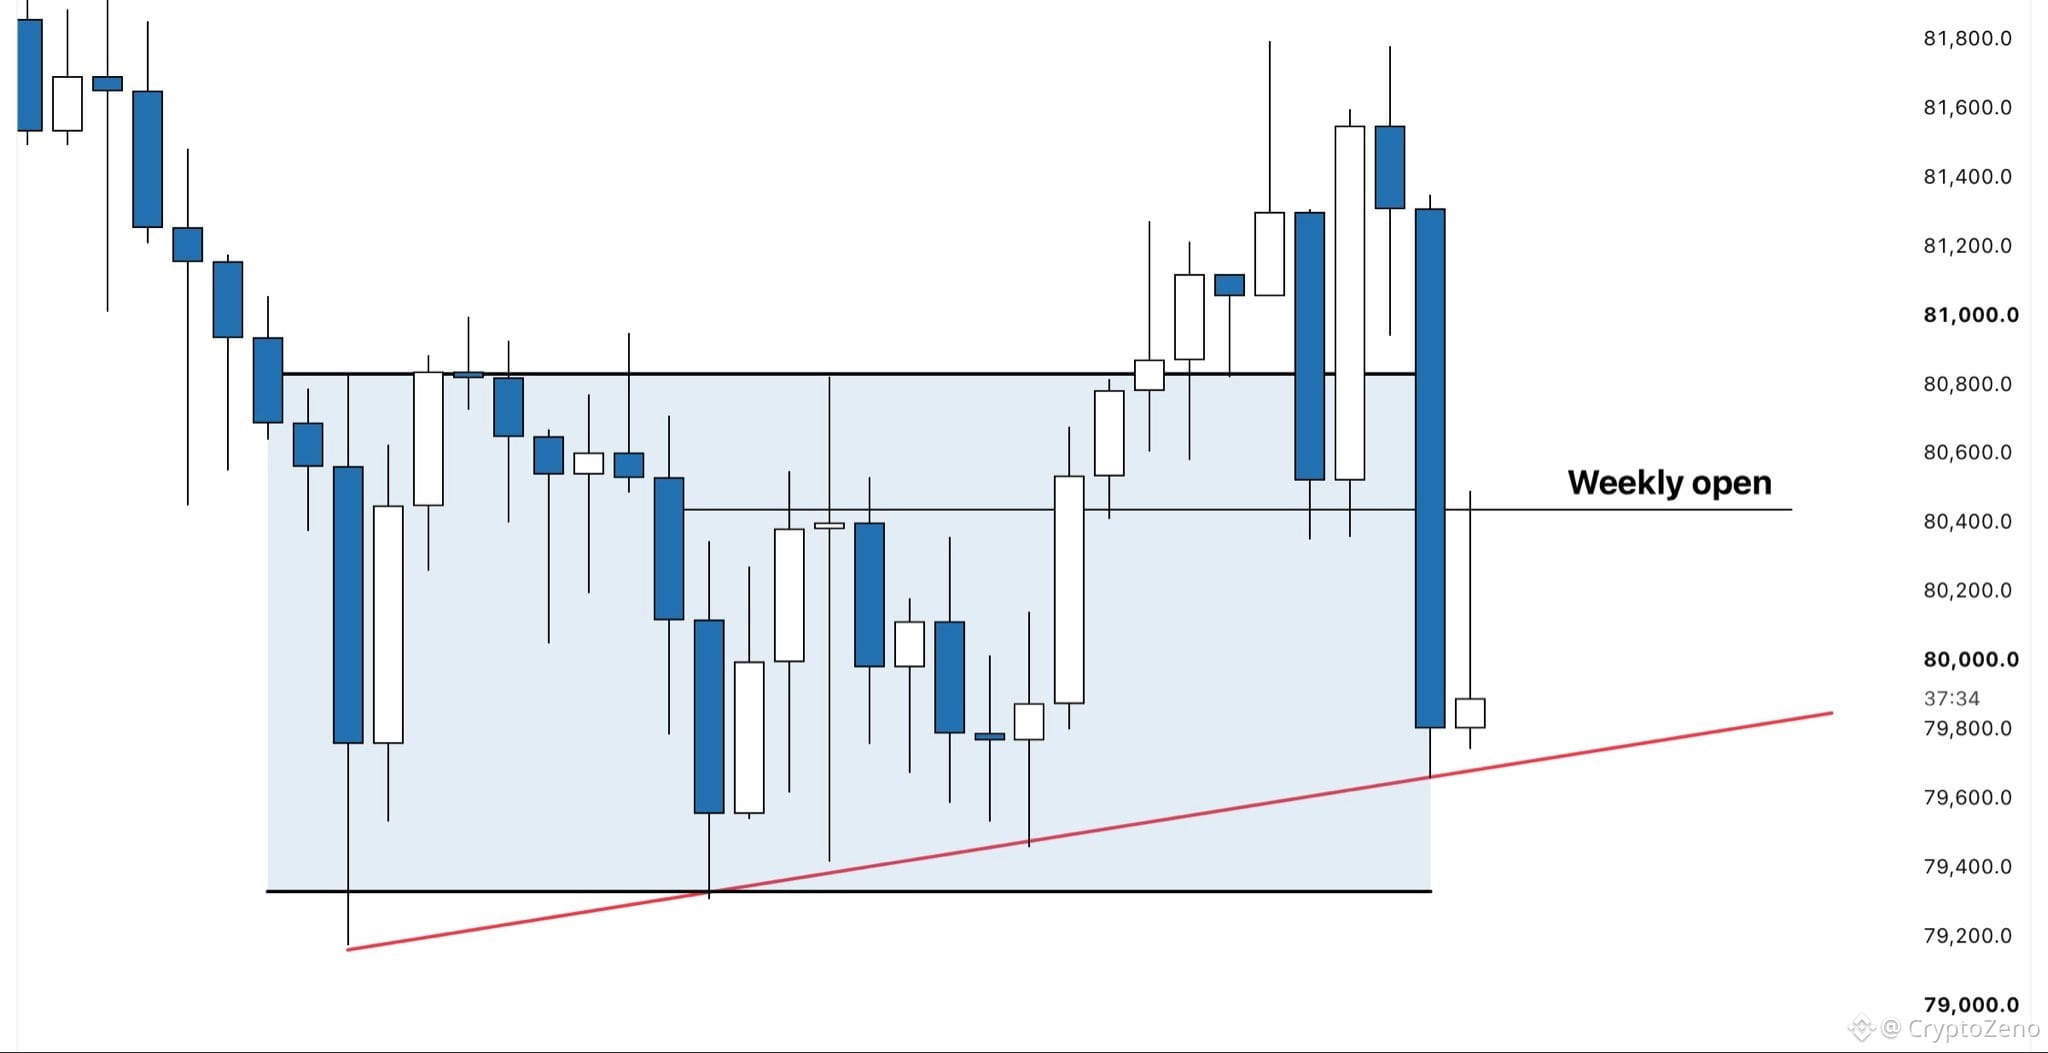
4
218
·
--
THIS IS ACTUALLY CRAZY!
A 19 year old named Trenton Johnston stole 185 $BTC worth $13 MILLION with just one phone call.
He called pretending to be Google and Trezor support and told the victim their wallet was getting hacked.
They panicked and handed over their keys.
He blew the money on a Lamborghini, a Rolls-Royce and private jets.
Then went and bragged about it on Signal and Discord.
11 days later, cops caught him for speeding in that same Rolls-Royce.
The victim lost all his life savings, but this guy only got a 25-month sentence.
If you're in crypto, never share your keys with anyone. Not even "support."
{future}(BTCUSDT)
THIS IS ACTUALLY CRAZY!
A 19 year old named Trenton Johnston stole 185 $BTC worth $13 MILLION with just one phone call.
He called pretending to be Google and Trezor support and told the victim their wallet was getting hacked.
They panicked and handed over their keys.
He blew the money on a Lamborghini, a Rolls-Royce and private jets.
Then went and bragged about it on Signal and Discord.
11 days later, cops caught him for speeding in that same Rolls-Royce.
The victim lost all his life savings, but this guy only got a 25-month sentence.
If you're in crypto, never share your keys with anyone. Not even "support."
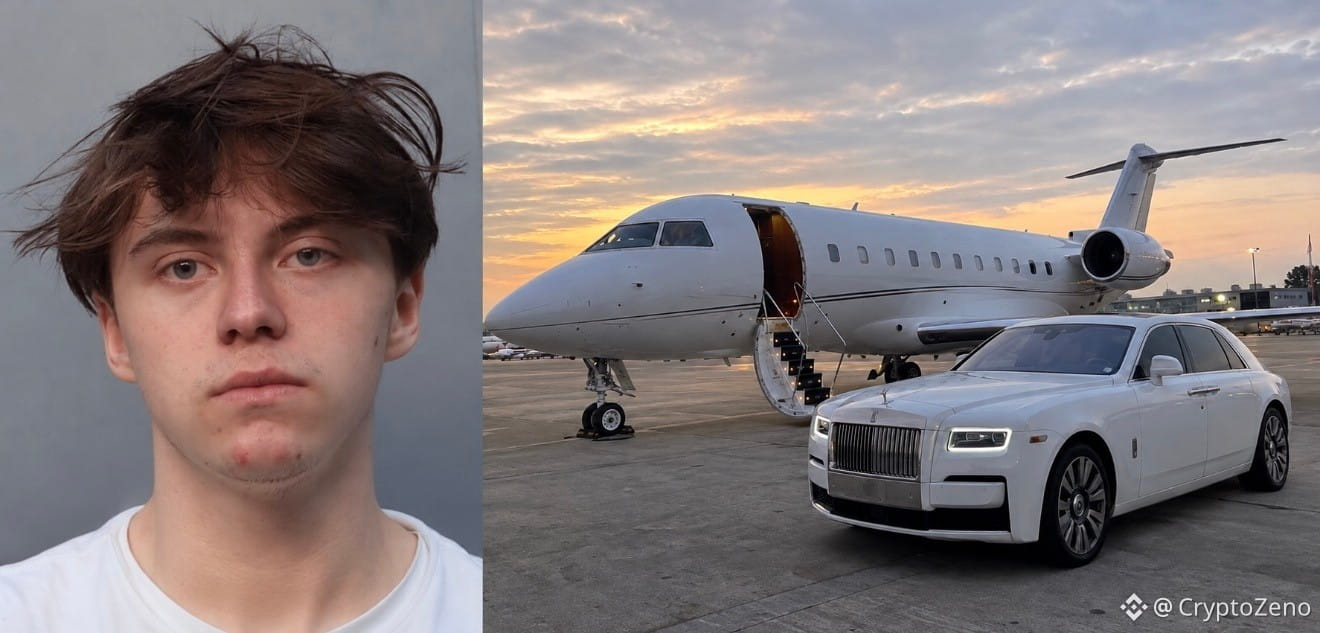
1
5
315
·
--
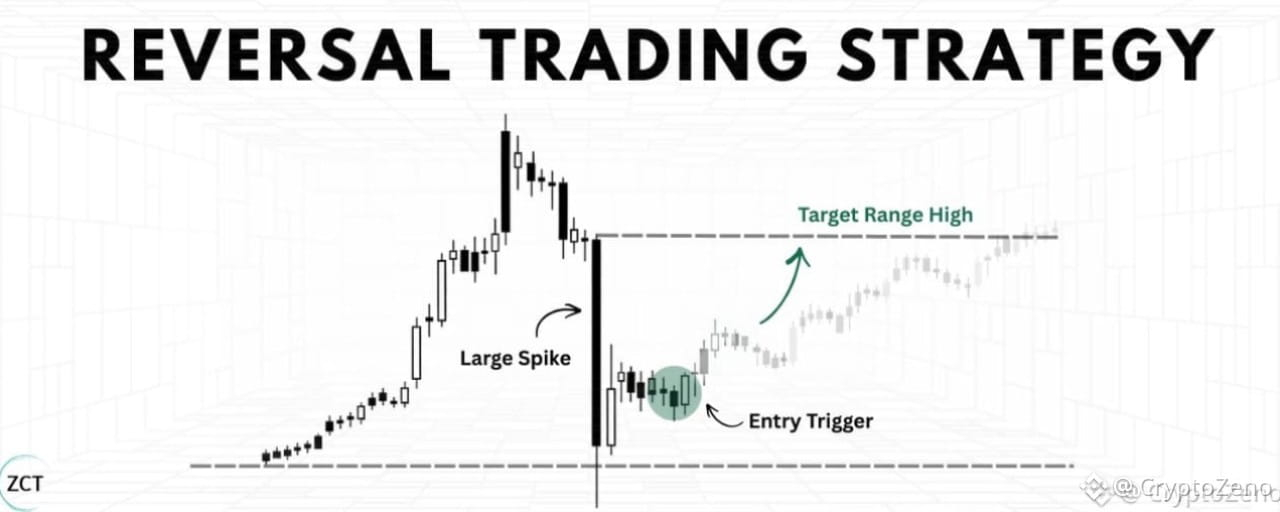
Статья
My Reversal Trading StrategyMy job everyday is to come to the table, look around and decide where could certain hands move price or force itself into the books in order to move price.
At least on the lower time frames I do this through tools like open interest, funding rates, live liquidations, delta, plus some intuition from repeatedly seeing the same patterns of liquidity repeated after years of watching the same market. These are the tools which give me the ability across a fragmented BTC market to identify where people are positioning, which side they are on, and which moves could force their hand.
I like to frame my thinking around a single quesiton before getting into a position:
Has the market priced this in yet?
If it hasn't been priced in then there's edge in what i'm trying to execute from. If I see the market has priced it in already then the edge has diminished and the trade is no longer there.
A good example of this is when looking for trapped traders, specifically looking at whether open interest has decreased or not to spot whether those "trapped positions" have forced their position back into the market.
The end goal is to position myself into the market early enough to exploit something Ive seen which I believe the market hasn't priced in yet.
Another great example of this, is through understanding liquidity in particular how thin books can allow for exaggerated price movements. If you pair that alongside trapped positioning you will very often get a very nice mean reversion setup.
A common misconception is that "thin books" can only be identified in real time and through looking at the dom. This is not true. Using volume candles or looking at how far price moved in relation to how much volume pushed it can help answer this question too. Alongside identifying surges in open interest to help identify trapped positions.
It's about finding your thesis for why you should get paid from the trade you want to take, then going to the technical board and figuring out which tools will help identify this in real time.
Don't pick random tools and use them because they look fancy, think about where your edge comes from (at route level) then decide which tools allow you to spot that mispriced event faster and in a more reliable manner than anyone else could.
A fast move into a predictable stop/tp zone that happens unusually fast relative to local regime is one thing I commonly look for. These moves are often engineered, meaning someone/group of people have forced price to a certain local level for liquidity purposes.
> Force price up
> Stops/liquidations triggered
> Limit sell orders filled
> No real conviction
> Price reverses
This requires some level of intuition to reliably identify, but in essence upon a break of a level I want to see excessive buying in the form of aggressive stops being hit or liquidations being forced into the book. Both offer up opportunity for opposing side limits to be filled, and if the move was manufactured or deliberately pushed up in this manner, theres no real conviction behind it, allows for a easy reversal.
It all comes down the fact that if I know why i'm looking for something at a certain location, that can be transferred over much easier than just punting random levels without reasoning.
Think about who you are trading against and how you can profit off that info before it is priced in, you are in the research business.
#CryptoZeno #CanGoogleDefindItsCore $BTC $Q
My Reversal Trading Strategy
My job everyday is to come to the table, look around and decide where could certain hands move price or force itself into the books in order to move price.
At least on the lower time frames I do this through tools like open interest, funding rates, live liquidations, delta, plus some intuition from repeatedly seeing the same patterns of liquidity repeated after years of watching the same market. These are the tools which give me the ability across a fragmented BTC market to identify where people are positioning, which side they are on, and which moves could force their hand.
I like to frame my thinking around a single quesiton before getting into a position:
Has the market priced this in yet?
If it hasn't been priced in then there's edge in what i'm trying to execute from. If I see the market has priced it in already then the edge has diminished and the trade is no longer there.
A good example of this is when looking for trapped traders, specifically looking at whether open interest has decreased or not to spot whether those "trapped positions" have forced their position back into the market.
The end goal is to position myself into the market early enough to exploit something Ive seen which I believe the market hasn't priced in yet.
Another great example of this, is through understanding liquidity in particular how thin books can allow for exaggerated price movements. If you pair that alongside trapped positioning you will very often get a very nice mean reversion setup.
A common misconception is that "thin books" can only be identified in real time and through looking at the dom. This is not true. Using volume candles or looking at how far price moved in relation to how much volume pushed it can help answer this question too. Alongside identifying surges in open interest to help identify trapped positions.
It's about finding your thesis for why you should get paid from the trade you want to take, then going to the technical board and figuring out which tools will help identify this in real time.
Don't pick random tools and use them because they look fancy, think about where your edge comes from (at route level) then decide which tools allow you to spot that mispriced event faster and in a more reliable manner than anyone else could.
A fast move into a predictable stop/tp zone that happens unusually fast relative to local regime is one thing I commonly look for. These moves are often engineered, meaning someone/group of people have forced price to a certain local level for liquidity purposes.
> Force price up
> Stops/liquidations triggered
> Limit sell orders filled
> No real conviction
> Price reverses
This requires some level of intuition to reliably identify, but in essence upon a break of a level I want to see excessive buying in the form of aggressive stops being hit or liquidations being forced into the book. Both offer up opportunity for opposing side limits to be filled, and if the move was manufactured or deliberately pushed up in this manner, theres no real conviction behind it, allows for a easy reversal.
It all comes down the fact that if I know why i'm looking for something at a certain location, that can be transferred over much easier than just punting random levels without reasoning.
Think about who you are trading against and how you can profit off that info before it is priced in, you are in the research business.
#CryptoZeno #CanGoogleDefindItsCore $BTC $Q
224
17
319
·
--
Статья
How Limit Orders Help You Trade Precisely When the Market Gets VolatileLimit Order is a type of trade order that lets you set the exact price you want to buy or sell assets (such as crypto, stock…). Unlike a Market Order, which executes immediately at the current market price, a Limit Order only executes when the market reaches the price you set.
Market Orders are useful when you need to enter or exit immediately and don’t care about small price differences. Limit Orders are for people who want price control, can wait, or trade low-liquidity tokens.
What is Limit Order?
How Limit Orders help preventing Slippage
Slippage is the difference between the price you expect and the price you actually get when your order executes. According to research from the Sei, total slippage costs in 2024 exceeded $2.7B, up 34% from the previous year.
Slippage is usually driven by a combination of market conditions and execution mechanics. It often occurs when liquidity is low, meaning there are not enough matching orders at the desired price. During periods of high volatility, prices can move rapidly while an order is being processed.
Large trade sizes can also cause slippage by consuming multiple price levels. On DEXs, AMM mechanics amplify this effect, as large trades shift the token ratio in the pool and push the execution price away from the expected level.
What is slippage?
How does a Limit Order solve the slippage problem?
By placing a Limit Order, you clearly define the maximum price you are willing to buy or the minimum price you are willing to sell. The order will never execute at a worse price than what you set, helping you avoid negative slippage even in volatile or low-liquidity markets.
Common Types of Limit Orders
Buy Limit Order
You place a buy order at a price lower than the current price. The order executes only when the price drops to your specified level or lower. This fits when you believe the price may dip before moving up.
For example, if BTC is trading at $70,500 and you believe a short-term pullback is likely, you can place a buy limit order at $70,000. The order will only execute if the market trades at that price or lower. This approach helps avoid buying into temporary price spikes and gives you more control over entry price.
Buy Limit Order
Sell Limit Order
You place a sell order at a price higher than the current price. The order executes only when the price rises to your specified level or higher. This is commonly used to take profit at a target price.
Suppose BTC is trading at $60,000 and your target is $80,000. By placing a sell limit order at $80,000, the trade will execute automatically once the price reaches that level. If the market fails to rally, the order remains open. This method enables disciplined profit-taking without constant monitoring.
Sell Limit Order
Stop-Limit Order
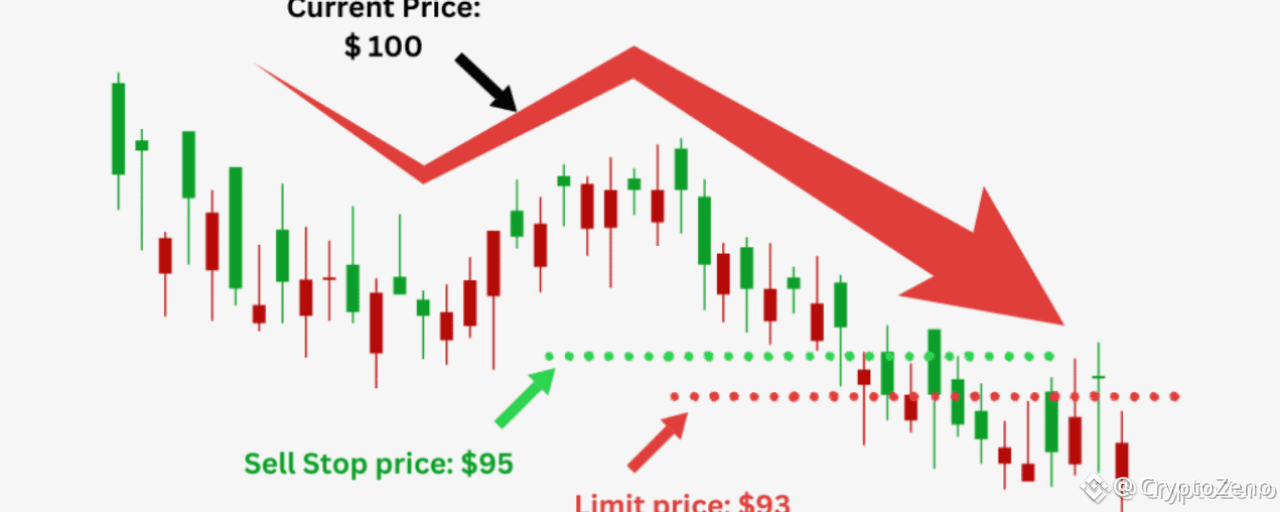
This combines a Stop Order and a Limit Order. You set two prices: a Stop Price (trigger price) and a Limit Price (execution price). When the market hits the Stop Price, the Limit Order becomes active.
For example, you bought SOL at $120 and it is now trading at $135. To protect profits, you set a stop price at $128 and a limit price at $126.
When the market hits $128, a sell limit order at $126 becomes active. The trade executes only if liquidity exists at that price, avoiding extreme slippage during sharp moves.
Stop-Limit Order
Differences between Limit Order vs Market Order
The main difference between limit orders and market orders comes down to the trade-off between price certainty and execution speed. A market order prioritizes immediate execution, making it useful when speed matters, but it exposes traders to slippage, especially during high volatility or when liquidity is thin.
A limit order, on the other hand, lets you define the exact price you are willing to trade at, offering better cost control and discipline. The downside is that execution is not guaranteed, and fast-moving markets can leave limit orders unfilled.
Differences between Limit Order vs Market Order
Pros and Cons of Limit Orders
Pros
First, limit orders give you full control over execution price. You choose exactly where you want to buy or sell, rather than accepting whatever the market offers at that moment. This is especially useful in choppy conditions, where small price differences can meaningfully affect long-term returns.
Second, because a limit order only executes at your chosen price or better, it protects you from unexpected slippage during volatile moves. Even when the market spikes or drops quickly, you will never be filled at a worse price than intended, which helps preserve your risk-reward assumptions.
Third, once a limit order is placed, it works for you in the background. You do not need to watch the chart constantly or react emotionally to short-term price movements. When price reaches your level, the trade executes automatically, making execution more systematic and less stressful.
Finally, using limit orders encourages patience and discipline. Instead of chasing price or reacting to sudden momentum, you commit to predefined levels aligned with your strategy. Over time, this reduces FOMO-driven decisions and helps maintain consistency across different market conditions.
Pros of Limit Order
Cons
The biggest downside of limit orders is that execution is not always guaranteed. If the market moves close to your price but never actually trades at it, the order remains unfilled. In strong trends, this can mean watching price move away without you.
Furthermore, even if the market touches your limit price, a limit order may not fully execute. If available liquidity at that level is limited, only part of your order will be filled, while the rest stays open. This can be frustrating during fast or crowded markets.
Markets do not always move cleanly. Price can reverse sharply or continue trending in your favor without ever touching your limit level. In those cases, a strict limit order may cause you to miss an otherwise profitable trade, especially during high-momentum moves.
Limit Orders are a must-have tool for any serious trader, especially in prediction markets where liquidity is often low and spreads are wide. They help you control your trading price, avoid slippage, and trade with more discipline.
As a leading Trading Terminal Aggregator, Whales Prediction provides everything from professional charts and order book depth to smart money tracking and multiple order types, including Limit Orders. It’s a solid platform for both beginners learning prediction markets and experienced traders optimizing their strategies.
#CryptoZeno #CanMicrosoftDeliverOnAI $BTC $XRP
How Limit Orders Help You Trade Precisely When the Market Gets Volatile
Limit Order is a type of trade order that lets you set the exact price you want to buy or sell assets (such as crypto, stock…). Unlike a Market Order, which executes immediately at the current market price, a Limit Order only executes when the market reaches the price you set.
Market Orders are useful when you need to enter or exit immediately and don’t care about small price differences. Limit Orders are for people who want price control, can wait, or trade low-liquidity tokens.
What is Limit Order?
How Limit Orders help preventing Slippage
Slippage is the difference between the price you expect and the price you actually get when your order executes. According to research from the Sei, total slippage costs in 2024 exceeded $2.7B, up 34% from the previous year.
Slippage is usually driven by a combination of market conditions and execution mechanics. It often occurs when liquidity is low, meaning there are not enough matching orders at the desired price. During periods of high volatility, prices can move rapidly while an order is being processed.
Large trade sizes can also cause slippage by consuming multiple price levels. On DEXs, AMM mechanics amplify this effect, as large trades shift the token ratio in the pool and push the execution price away from the expected level.
What is slippage?
How does a Limit Order solve the slippage problem?
By placing a Limit Order, you clearly define the maximum price you are willing to buy or the minimum price you are willing to sell. The order will never execute at a worse price than what you set, helping you avoid negative slippage even in volatile or low-liquidity markets.
Common Types of Limit Orders
Buy Limit Order
You place a buy order at a price lower than the current price. The order executes only when the price drops to your specified level or lower. This fits when you believe the price may dip before moving up.
For example, if BTC is trading at $70,500 and you believe a short-term pullback is likely, you can place a buy limit order at $70,000. The order will only execute if the market trades at that price or lower. This approach helps avoid buying into temporary price spikes and gives you more control over entry price.
Buy Limit Order
Sell Limit Order
You place a sell order at a price higher than the current price. The order executes only when the price rises to your specified level or higher. This is commonly used to take profit at a target price.
Suppose BTC is trading at $60,000 and your target is $80,000. By placing a sell limit order at $80,000, the trade will execute automatically once the price reaches that level. If the market fails to rally, the order remains open. This method enables disciplined profit-taking without constant monitoring.
Sell Limit Order
Stop-Limit Order
This combines a Stop Order and a Limit Order. You set two prices: a Stop Price (trigger price) and a Limit Price (execution price). When the market hits the Stop Price, the Limit Order becomes active.
For example, you bought SOL at $120 and it is now trading at $135. To protect profits, you set a stop price at $128 and a limit price at $126.
When the market hits $128, a sell limit order at $126 becomes active. The trade executes only if liquidity exists at that price, avoiding extreme slippage during sharp moves.
Stop-Limit Order
Differences between Limit Order vs Market Order
The main difference between limit orders and market orders comes down to the trade-off between price certainty and execution speed. A market order prioritizes immediate execution, making it useful when speed matters, but it exposes traders to slippage, especially during high volatility or when liquidity is thin.
A limit order, on the other hand, lets you define the exact price you are willing to trade at, offering better cost control and discipline. The downside is that execution is not guaranteed, and fast-moving markets can leave limit orders unfilled.
Differences between Limit Order vs Market Order
Pros and Cons of Limit Orders
Pros
First, limit orders give you full control over execution price. You choose exactly where you want to buy or sell, rather than accepting whatever the market offers at that moment. This is especially useful in choppy conditions, where small price differences can meaningfully affect long-term returns.
Second, because a limit order only executes at your chosen price or better, it protects you from unexpected slippage during volatile moves. Even when the market spikes or drops quickly, you will never be filled at a worse price than intended, which helps preserve your risk-reward assumptions.
Third, once a limit order is placed, it works for you in the background. You do not need to watch the chart constantly or react emotionally to short-term price movements. When price reaches your level, the trade executes automatically, making execution more systematic and less stressful.
Finally, using limit orders encourages patience and discipline. Instead of chasing price or reacting to sudden momentum, you commit to predefined levels aligned with your strategy. Over time, this reduces FOMO-driven decisions and helps maintain consistency across different market conditions.
Pros of Limit Order
Cons
The biggest downside of limit orders is that execution is not always guaranteed. If the market moves close to your price but never actually trades at it, the order remains unfilled. In strong trends, this can mean watching price move away without you.
Furthermore, even if the market touches your limit price, a limit order may not fully execute. If available liquidity at that level is limited, only part of your order will be filled, while the rest stays open. This can be frustrating during fast or crowded markets.
Markets do not always move cleanly. Price can reverse sharply or continue trending in your favor without ever touching your limit level. In those cases, a strict limit order may cause you to miss an otherwise profitable trade, especially during high-momentum moves.
Limit Orders are a must-have tool for any serious trader, especially in prediction markets where liquidity is often low and spreads are wide. They help you control your trading price, avoid slippage, and trade with more discipline.
As a leading Trading Terminal Aggregator, Whales Prediction provides everything from professional charts and order book depth to smart money tracking and multiple order types, including Limit Orders. It’s a solid platform for both beginners learning prediction markets and experienced traders optimizing their strategies.
#CryptoZeno #CanMicrosoftDeliverOnAI $BTC $XRP
220
17
323
·
--
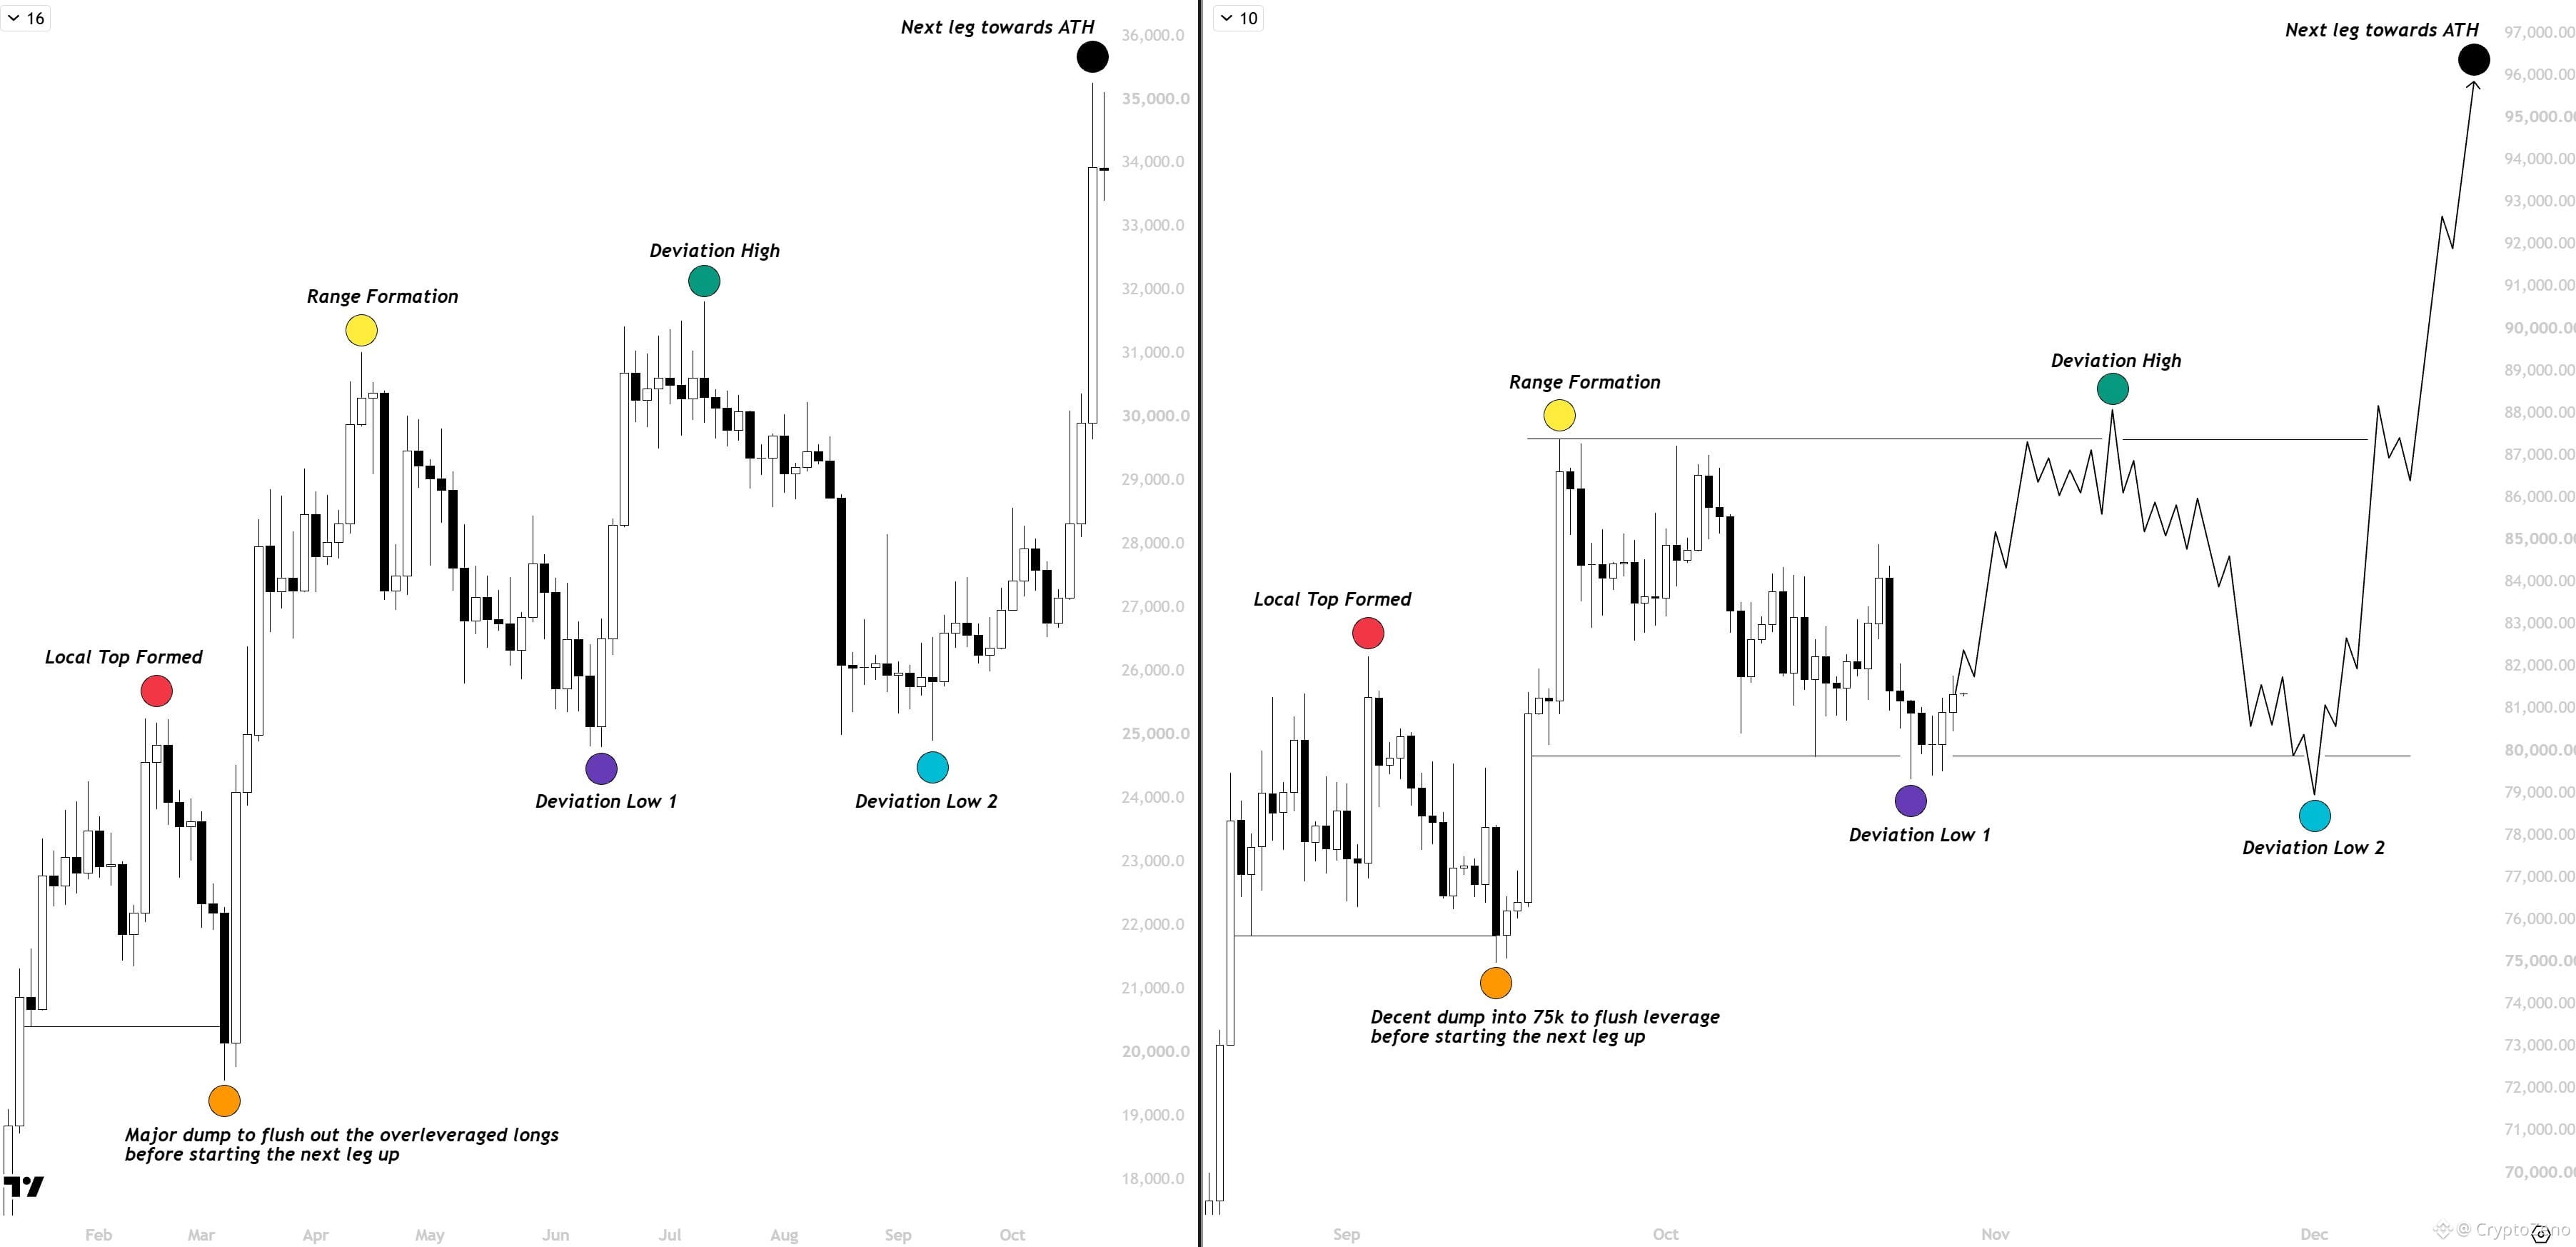
$BTC Price dumped into our bottom pivot window (28-30th),
{future}(BTCUSDT)
It didn't went for the sweep of the mFVG (75k) following our last fractal and is now starting to form bottom like structure here,
Considering it, I think we have already got the flush in the last pullback (to 75k),
This is still an idea for now but looking at the time pivot and the current market structure.
It looks like we have formed our purple dot and now it's time to hunt the cluster of liquidity above 88k and form the green dot there.
I am swing long from 79.8k and will be adding some alts if we get any pullback (SOL, ETH, HYPE).
$BTC Price dumped into our bottom pivot window (28-30th),
It didn't went for the sweep of the mFVG (75k) following our last fractal and is now starting to form bottom like structure here,
Considering it, I think we have already got the flush in the last pullback (to 75k),
This is still an idea for now but looking at the time pivot and the current market structure.
It looks like we have formed our purple dot and now it's time to hunt the cluster of liquidity above 88k and form the green dot there.
I am swing long from 79.8k and will be adding some alts if we get any pullback (SOL, ETH, HYPE).
2
2
7
7.1k
Войдите, чтобы посмотреть больше материала
Присоединяйтесь к пользователям криптовалют по всему миру на Binance Square
⚡️ Получайте новейшую и полезную информацию о криптоактивах.
💬 Нам доверяет крупнейшая в мире криптобиржа.
👍 Получите достоверные аналитические данные от верифицированных создателей контента.
Эл. почта/номер телефона
В тренде
$1.5BInLeveragedCryptoBetsLiquidated
Просмотров: 4,301
64 обсуждают
#$1.5BInLeveragedCryptoBetsLiquidated
📉 Kripto fiyatları düşünce, kaldıraçla yükselişe oynayanların pozisyonları otomatik kapatıldı. 24 saatte toplam 1,53 milyar dolarlık işlem tasfiye edildi; bunun yaklaşık %83,8’i fiyatların yükseleceğine bahis oynayan “long” pozisyonlardı. Bu rakam, yatırımcıların cebinden çıkan nakdin değil, kapatılan pozisyonların toplam değerinin ölçüsü. 💸
⚙️ Kaldıraç, az parayla daha büyük bir işlem açmak gibi. Fiyat ters yönde yeterince hareket edince teminat yetmiyor ve borsa pozisyonu zorla kapatıyor. Bu satışlar düşüşü daha da hızlandırabiliyor. Haber, satış dalgasını Binance’teki güvenlik ihlali sonrasına bağlıyor
🔄 Fiyatlar toparlanınca bu kez düşüşe oynayan bazı “short” pozisyonlar da tasfiye edildi; onları kapatmak için alım yapılması yükselişi besleyebiliyor.$LSK $IDOL $Q
Sat_Stacker
·Лайков: 0
·Просмотров: 781
KOSPIFalls3.53%BackBelow6000
Просмотров: 8,320
280 обсуждают
USMidtermElections
Просмотров: 124,332
1,552 обсуждают