

cryptos talker
45 Публикации

cryptos talker
Отправить жалобу
Заблокировать пользователя
8 подписок(и/а)
72 подписчиков(а)
30 понравилось
Посты
Портфель
Все
Цитирования
Активно
·
--
Рост
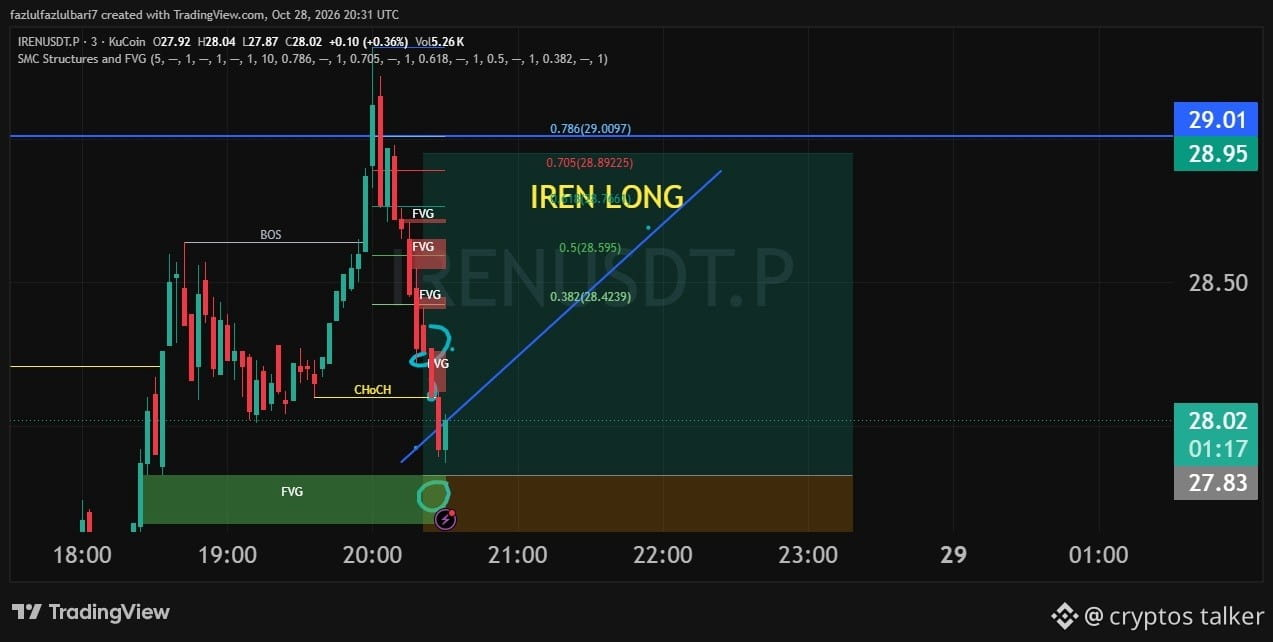
🚀 IREN/USDT — BULLISH LONG SETUP 📈
IREN is showing a potential bullish reversal opportunity on the 3-minute chart! 🔥
After a sharp pullback, price is approaching a key demand zone around 27.83–28.00, where buyers could step in and push the price higher.
🎯 Potential Targets:
TP1: 28.42
TP2: 28.60
TP3: 28.89
TP4: 29.01
🛡️ Key Support: 27.83
📈 Bullish Bias: A strong bounce from the demand zone could trigger an upside move.
⚠️ Important: Wait for bullish confirmation before entering. If price breaks below the support zone, the setup may be invalidated.
Will IREN pump toward $29.00? 👀🚀
#IREN #IRENUSDT #CryptoTrading #TechnicalAnalysis #TradingSignals #Altcoins
$IREN
{future}(IRENUSDT)
🚀 IREN/USDT — BULLISH LONG SETUP 📈
IREN is showing a potential bullish reversal opportunity on the 3-minute chart! 🔥
After a sharp pullback, price is approaching a key demand zone around 27.83–28.00, where buyers could step in and push the price higher.
🎯 Potential Targets:
TP1: 28.42
TP2: 28.60
TP3: 28.89
TP4: 29.01
🛡️ Key Support: 27.83
📈 Bullish Bias: A strong bounce from the demand zone could trigger an upside move.
⚠️ Important: Wait for bullish confirmation before entering. If price breaks below the support zone, the setup may be invalidated.
Will IREN pump toward $29.00? 👀🚀
#IREN #IRENUSDT #CryptoTrading #TechnicalAnalysis #TradingSignals #Altcoins
$IREN
87
·
--
Падение
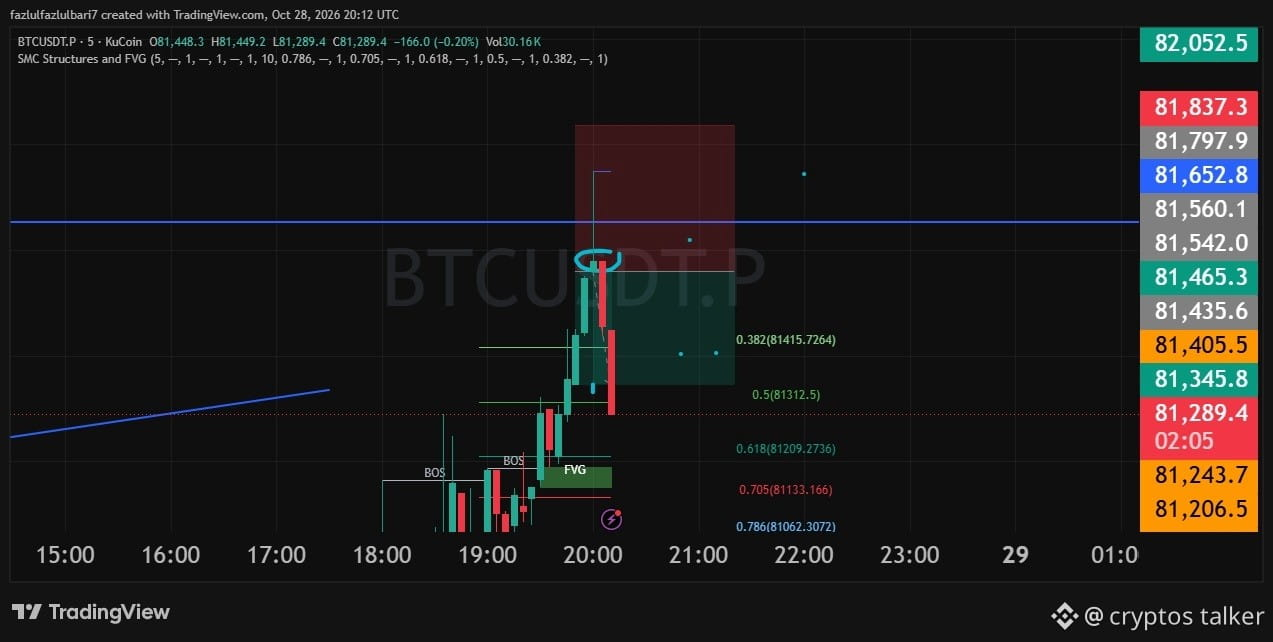
📉 BTC SHORT SETUP — MORE DOWNSIDE EXPECTED! 🐻
BTC faced strong rejection near the $81,465–$81,540 resistance zone, followed by a sharp bearish candle. More downside could be coming if sellers maintain control.
🎯 Short Targets:
TP1: $81,210
TP2: $81,130
TP3: $81,060
🛑 Invalidation: Above $81,560–$81,650
⚠️ Watch for a weak retest before entering. A break below $81,200 could strengthen bearish momentum.
#BTC #Bitcoin #CryptoTrading #TechnicalAnalysis #BTCUSDT $BTC
146
·
--
Рост
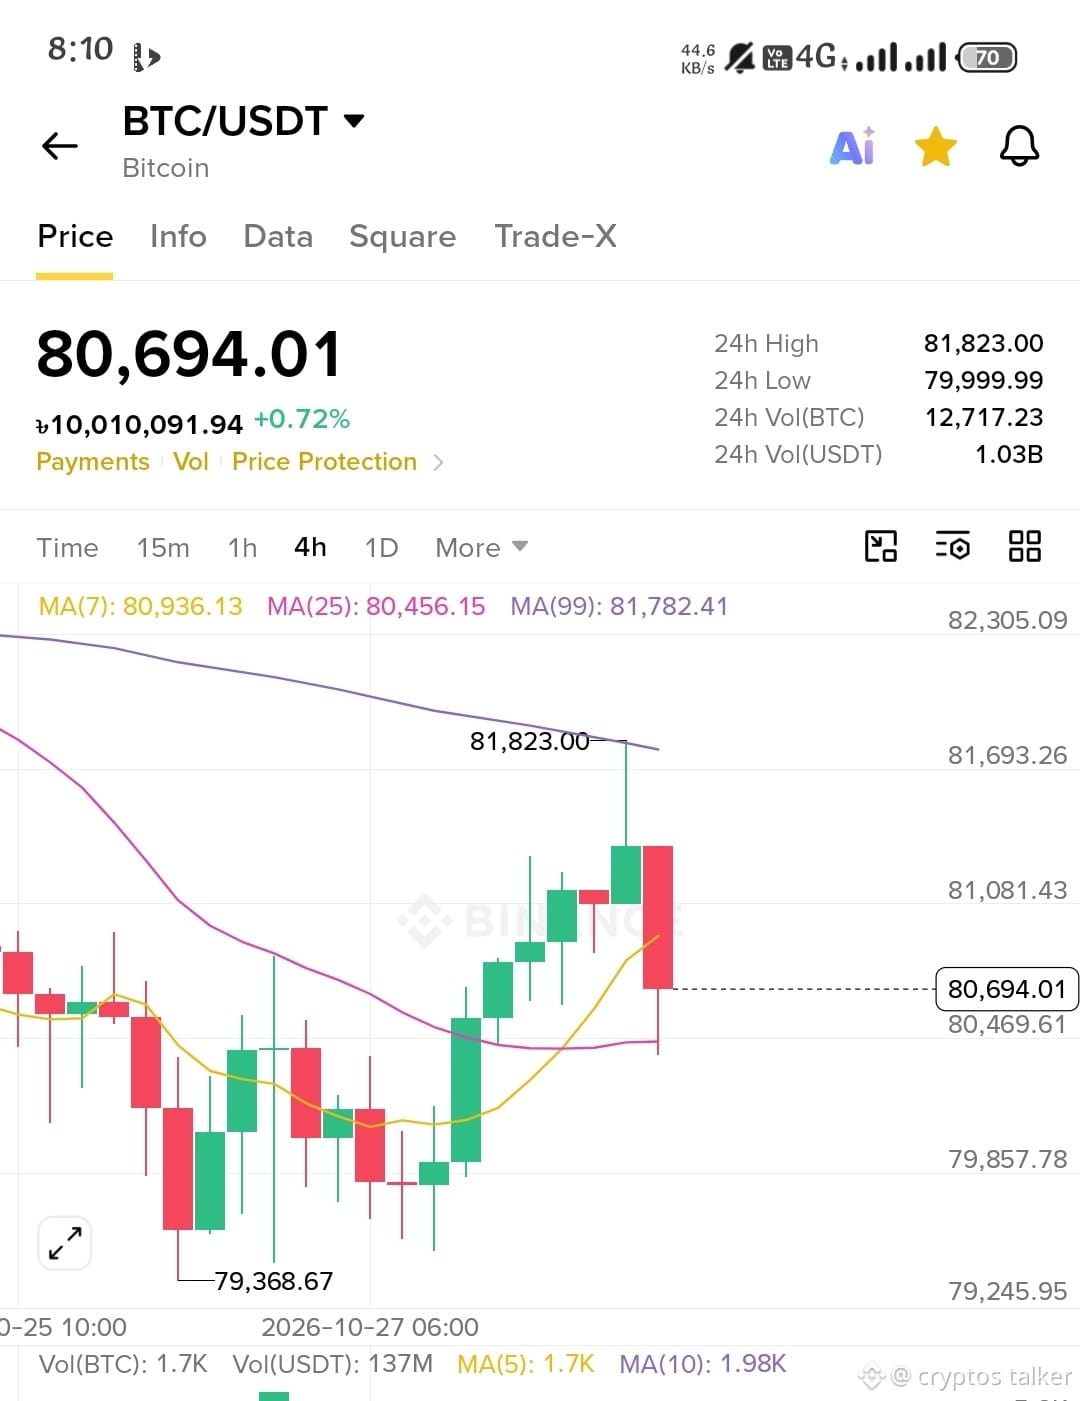
btc📊 BTC/USDT Technical Analysis | Binance
Bitcoin is approaching a key resistance zone. Traders should watch for a confirmed breakout or rejection before entering a position.
🔹 Resistance Levels:
• R1: $81,400–$81,600
• R2: $81,960–$82,000
• R3: $83,100
🔹 Support Levels:
• S1: $80,150–$80,570
• S2: $79,200–$79,850
• S3: $78,100–$78,800
🟢 Bullish Scenario: A confirmed breakout above $81,960 could open the door toward $82,400 and $83,100.
🔴 Bearish Scenario: A breakdown below $80,150 could lead to further downside toward $79,500.
⚠️ Trading Strategy: Wait for confirmation, manage your risk, and avoid emotional entries. These levels are potential scenarios, not guaranteed predictions.
💬 What's your BTC prediction? $83K or $79K first?
#BTC #Bitcoin #Binance #CryptoAnalysis #BTCUSDT #TechnicalAnalysis #CryptoTrading
$BTC $
1
111
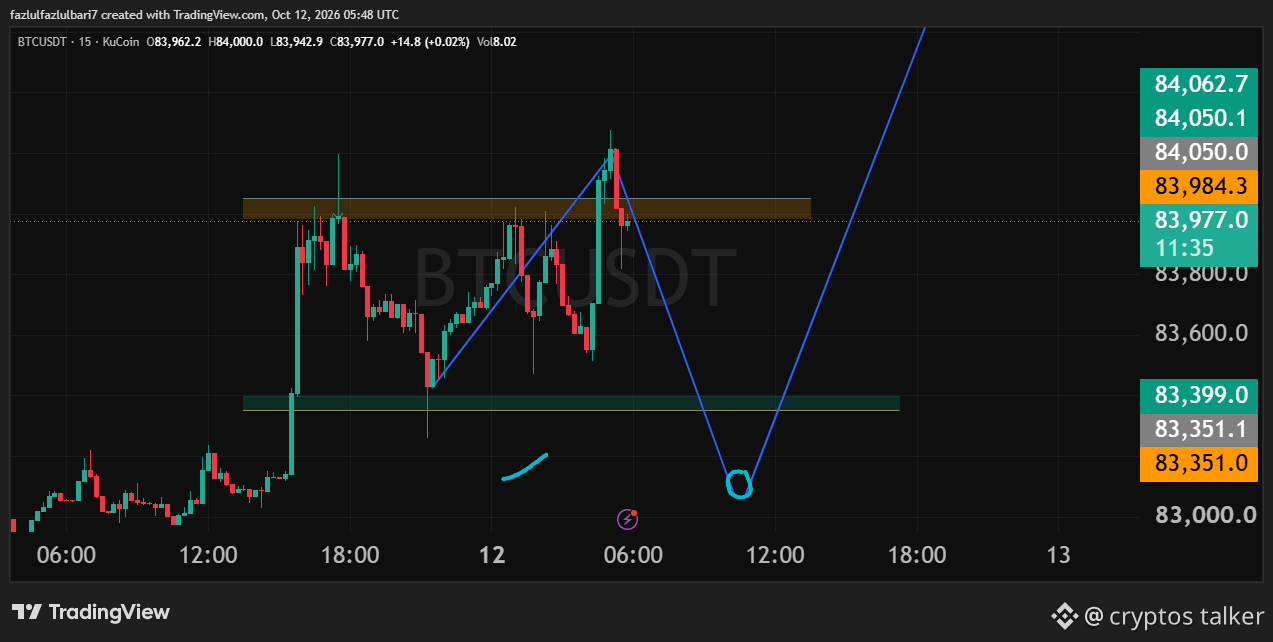
📊 BTC/USDT Technical Analysis | 15M Timeframe
Bitcoin is facing strong resistance around $83,980–$84,050 after a sharp upward move. The latest candles show rejection from this zone, indicating a possible short-term pullback.
🔴 Resistance: $83,980–$84,050
🟢 Major Support: $83,350–$83,400
📉 SHORT SETUP
Entry: $83,950–$84,050 (after bearish confirmation)
TP1: $83,700
TP2: $83,500
TP3: $83,400
Stop Loss: $84,150
📈 LONG SETUP
Entry: $83,350–$83,450 (after a confirmed bounce)
TP1: $83,700
TP2: $83,980
TP3: $84,050
Stop Loss: $83,200
🎯 Market Outlook:
A pullback toward the $83,350–$83,400 support zone is possible. If BTC breaks above $84,050 and holds, bullish continuation toward $84,200–$84,400 could follow.
⚠️ Trading Strategy: Don't chase the price. Wait for confirmation before entering any trade and always manage your risk.
This analysis is based on the 15-minute chart and is not financial advice.
#BTC #Bitcoin #BTCUSDT #CryptoAnalysis #TechnicalAnalysis #CryptoTrading
105
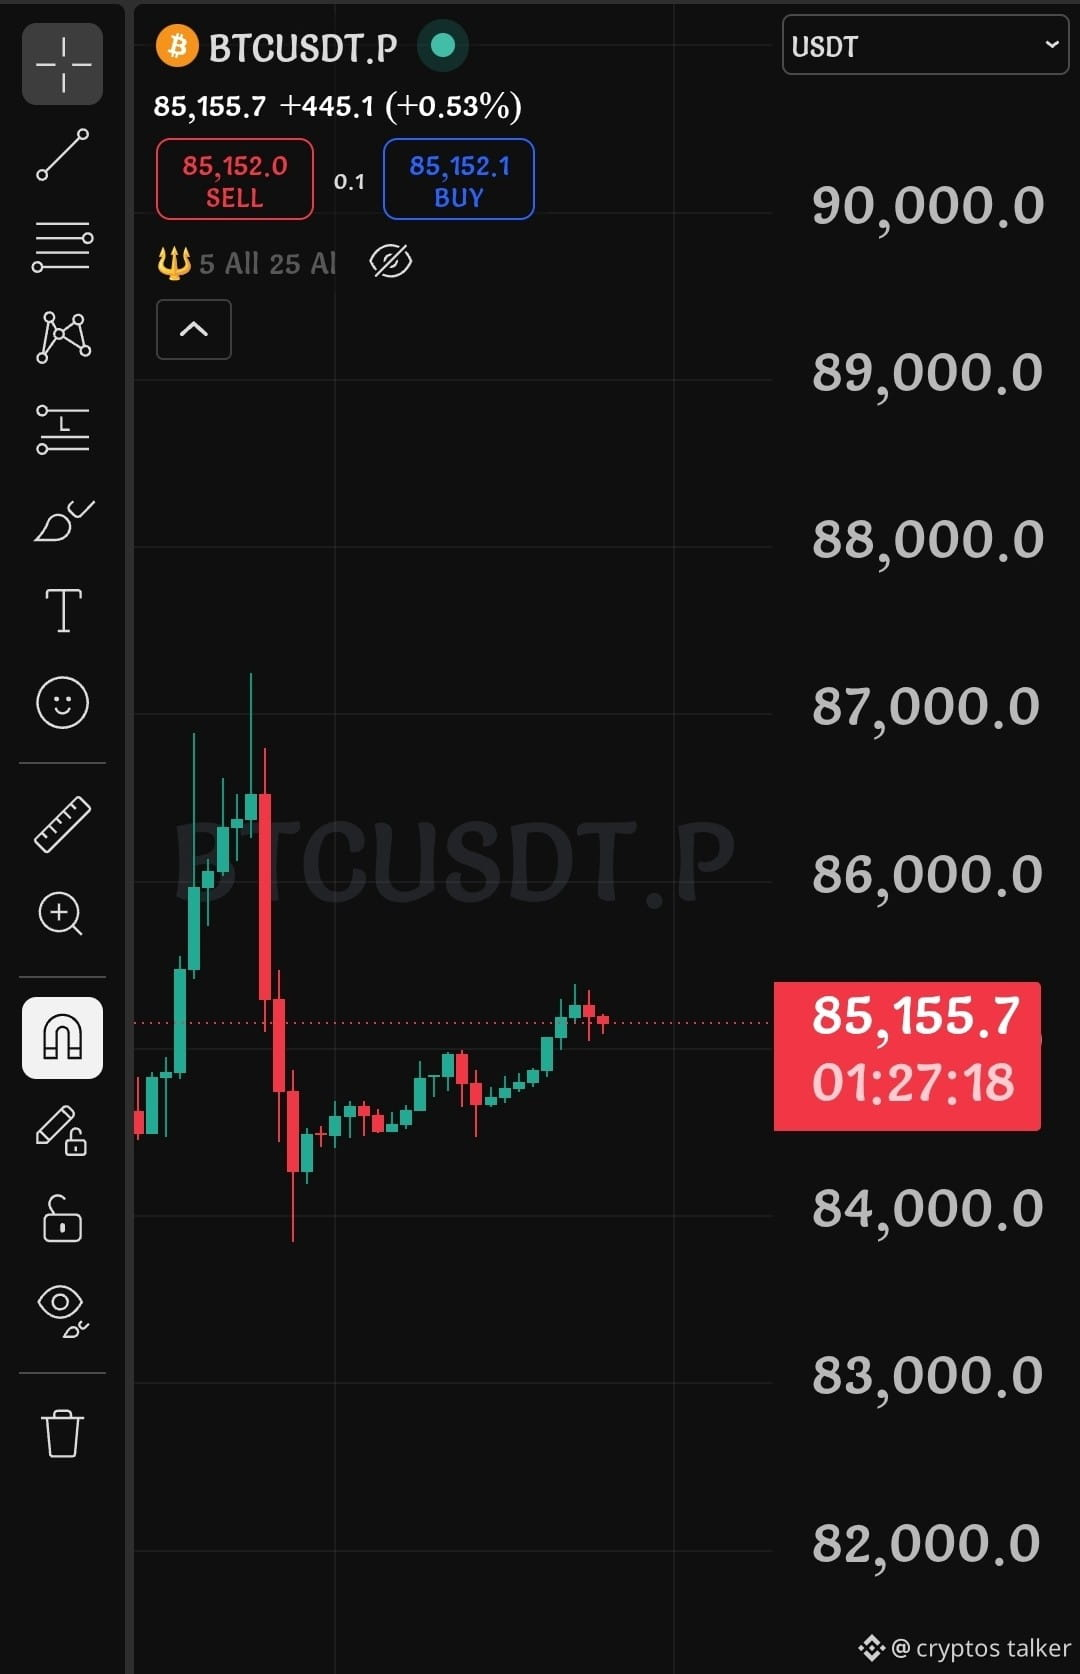
BTC/USDT Technical Analysis 📊
Current Price: ~$85,155
🟢 LONG Trade Setup
Entry: $85,000 – $85,200
TP1: $85,500
TP2: $86,000
TP3: $86,500
Stop Loss: $84,650
Key Levels
Resistance: $85,400–$85,600
Next Resistance: $86,000 / $86,500
Support: $84,700–$84,800
Major Support: $84,200–$84,400
Analysis: BTC is showing a short-term bullish recovery with higher lows after bouncing from the $84K area. A clean breakout and retest above $85,500 could trigger further upside toward $86K–$86.5K.
⚠️ Invalidation: If BTC breaks and closes below $84,650, the bullish setup becomes invalid and downside toward $84,200–$83,800 becomes possible.
Bias: 🟢 Slightly Bullish
Use proper risk management; this is a technical setup, not financial advice.
$BTC
{future}(BTCUSDT)
BTC/USDT Technical Analysis 📊
Current Price: ~$85,155
🟢 LONG Trade Setup
Entry: $85,000 – $85,200
TP1: $85,500
TP2: $86,000
TP3: $86,500
Stop Loss: $84,650
Key Levels
Resistance: $85,400–$85,600
Next Resistance: $86,000 / $86,500
Support: $84,700–$84,800
Major Support: $84,200–$84,400
Analysis: BTC is showing a short-term bullish recovery with higher lows after bouncing from the $84K area. A clean breakout and retest above $85,500 could trigger further upside toward $86K–$86.5K.
⚠️ Invalidation: If BTC breaks and closes below $84,650, the bullish setup becomes invalid and downside toward $84,200–$83,800 becomes possible.
Bias: 🟢 Slightly Bullish
Use proper risk management; this is a technical setup, not financial advice.
$BTC
78
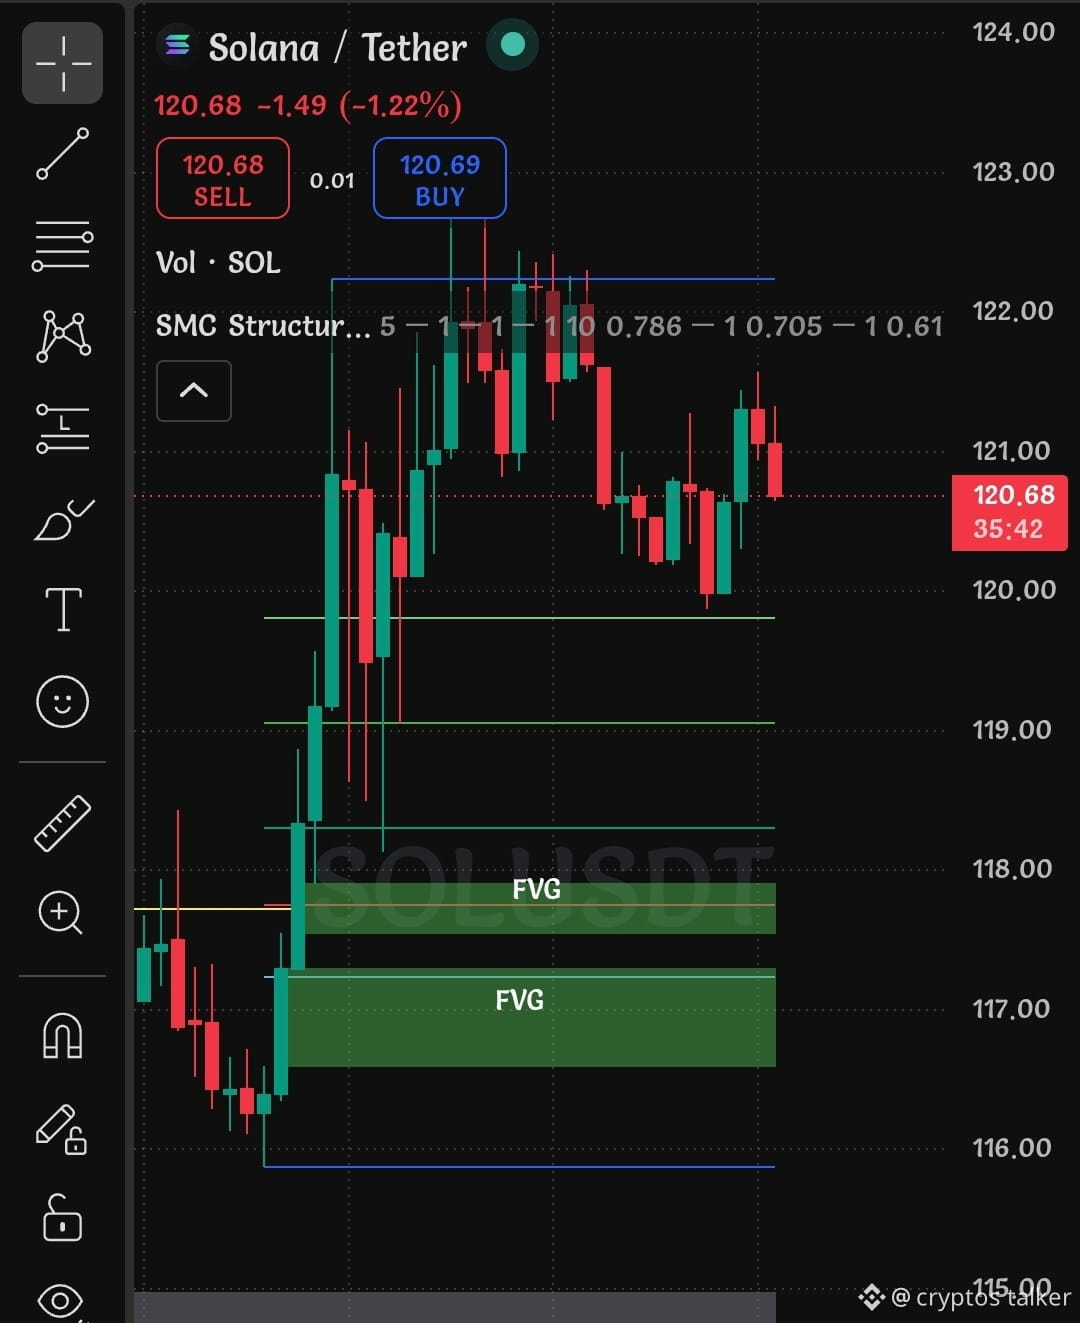
🟣 SOL/USDT — Technical Analysis
Current Price: ~$120.9
Solana is currently trading around $121, with buyers attempting to maintain the recent bullish momentum. The most important short-term level is $123, because a clean breakout could confirm another upward move.
Key Resistance Levels:
$123
$128
$135
$140
Key Support Levels:
$118
$115
$110
$105
Technical Outlook:
SOL is currently holding above the $118 support zone. If buyers push the price above $123 with strong volume, the next potential targets are $128 and $135.
On the other hand, rejection from $123 followed by a breakdown below $118 could trigger a short-term correction toward $115 or even $110.
Prediction:
My short-term outlook remains bullish above $118. A confirmed breakout above $123 could create enough momentum for SOL to test the $128–$135 region.
Trade Idea:
🟢 Long above $123
🎯 TP1: $128
🎯 TP2: $132
🎯 TP3: $135
🛑 SL: Below $118.50
This is technical analysis, not financial advice. Trade with proper risk management$SOL
{future}(SOLUSDT)
🟣 SOL/USDT — Technical Analysis
Current Price: ~$120.9
Solana is currently trading around $121, with buyers attempting to maintain the recent bullish momentum. The most important short-term level is $123, because a clean breakout could confirm another upward move.
Key Resistance Levels:
$123
$128
$135
$140
Key Support Levels:
$118
$115
$110
$105
Technical Outlook:
SOL is currently holding above the $118 support zone. If buyers push the price above $123 with strong volume, the next potential targets are $128 and $135.
On the other hand, rejection from $123 followed by a breakdown below $118 could trigger a short-term correction toward $115 or even $110.
Prediction:
My short-term outlook remains bullish above $118. A confirmed breakout above $123 could create enough momentum for SOL to test the $128–$135 region.
Trade Idea:
🟢 Long above $123
🎯 TP1: $128
🎯 TP2: $132
🎯 TP3: $135
🛑 SL: Below $118.50
This is technical analysis, not financial advice. Trade with proper risk management$SOL
29
Войдите, чтобы посмотреть больше материала
Присоединяйтесь к пользователям криптовалют по всему миру на Binance Square
⚡️ Получайте новейшую и полезную информацию о криптоактивах.
💬 Нам доверяет крупнейшая в мире криптобиржа.
👍 Получите достоверные аналитические данные от верифицированных создателей контента.
Эл. почта/номер телефона
В тренде
FedWatch
Просмотров: 16.3M
39,340 обсуждают
🚨 🇺🇸 PETER SCHIFF JUST THREW A BIG WARNING AT THE FED!
Peter Schiff is calling Kevin Warsh’s tough talk on inflation a “bluff,” and his prediction could have major implications for the markets.
Schiff believes the Fed could eventually return to money printing through quantitative easing (QE) and even cut interest rates next year, despite inflation continuing to rise.
Think about that for a moment.
🔥 Inflation could remain a problem. 🔥 The Fed could still move toward easier monetary policy. 🔥 More liquidity could flow into financial markets.
If this scenario plays out, it could create a very different market environment for stocks, gold, Bitcoin, and the wider crypto market.
But there’s a catch: if inflation stays high, the Fed could face a difficult choice between fighting rising prices and supporting the economy.
Will Warsh stick to a tough inflation policy, or will the Fed eventually change direction?
The next move could matter a lot for investors.
#FedWatch #EarningsSeason #USMidtermElections #BrazilCryptoExchangesMustApplyForLicensesByFriday #StanDruckenmillerBecomesInvestorInTradeXYZ
Jackson Liam
·Лайков: 3
·Просмотров: 8.2k
EarningsSeason
Просмотров: 6.4M
32,053 обсуждают
USMidtermElections
Просмотров: 37,090
599 обсуждают